- Aldine homes for sale
- Atascocita homes for sale
- Channelview homes for sale
- Cloverleaf homes for sale
- Galena Park homes for sale
- Hedwig Village homes for sale
- Hilshire Village homes for sale
- Houston homes for sale
- Humble homes for sale
- Hunters Creek Village homes for sale
- Jacinto City homes for sale
- Jersey Village homes for sale
- Kingwood homes for sale
- Piney Point Village homes for sale
- Porter homes for sale
- Sheldon homes for sale
- Southside Place homes for sale
- Spring homes for sale
- Spring Valley Village homes for sale
- West University Place homes for sale
77039, TX - homes for sale
83 of 83 results displayed
- New
 $349,900Active6 beds 3 baths1,009 sq. ft.
4422 Sandydale Lane, Houston, TX 77039
MLS# 20438279Listed by: COMPASS RE TEXAS, LLC - HOUSTON - New
 $290,000Active0.66 Acres
00 Lauder Road, Houston, TX 77039
MLS# 23749359Listed by: RED DOOR REALTY & ASSOCIATES - New
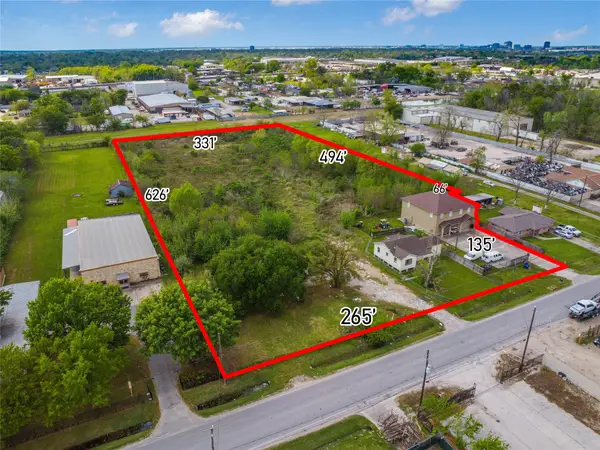 $1,400,000Active4.57 Acres
13301 & 13309 Reeveston Road, Houston, TX 77039
MLS# 28134812Listed by: REAL BROKER, LLC - New
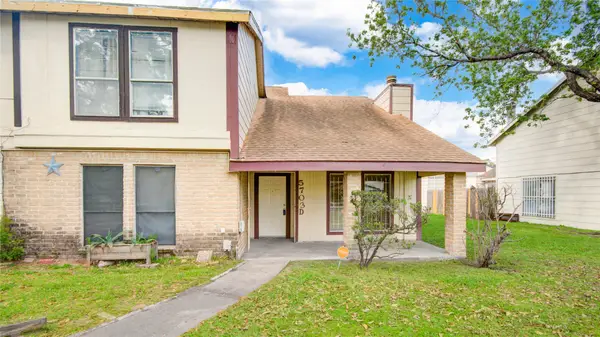 $165,000Active3 beds 2 baths1,698 sq. ft.
5703 Easthampton Drive #D, Houston, TX 77039
MLS# 96800366Listed by: WALZEL PROPERTIES - CORPORATE OFFICE  $75,000Active3 beds 3 baths1,511 sq. ft.
5747 Easthampton #D, Houston, TX 77039
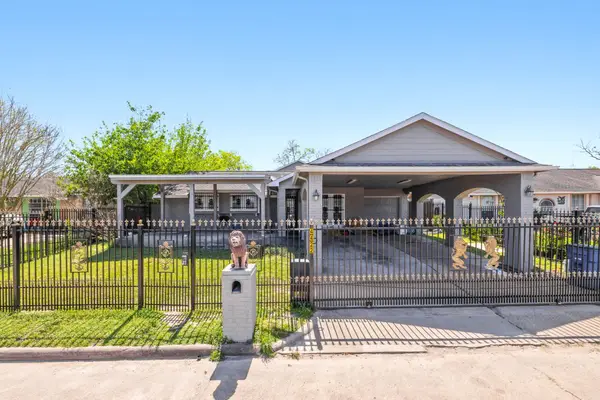
MLS# 39983527Listed by: KEY 2 TEXAS REALTY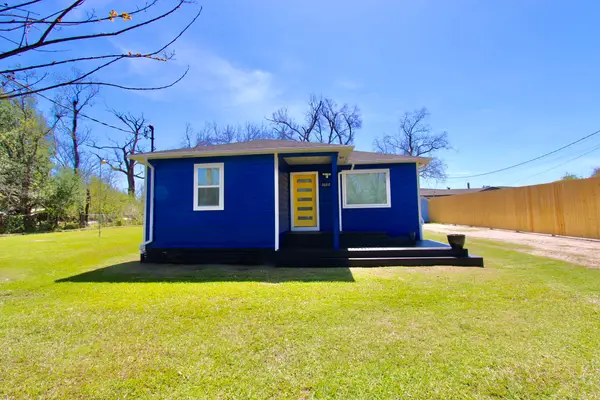 $499,000Active3 beds 2 baths2,143 sq. ft.
2022 Ladin Drive, Houston, TX 77039
MLS# 74379025Listed by: RENOVATOR REALTY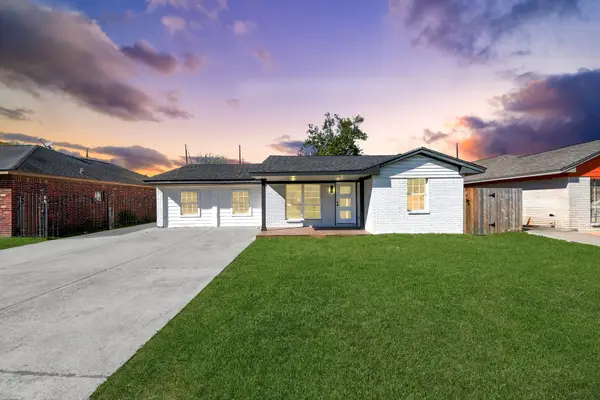 $248,000Pending5 beds 3 baths1,737 sq. ft.
3807 Cherry Meadow Drive, Houston, TX 77039
MLS# 52377975Listed by: REALTY OF AMERICA, LLC $85,000Active3 beds 2 baths1,698 sq. ft.
12207 W Village Drive #B, Houston, TX 77039
MLS# 65369240Listed by: REAL BROKER, LLC $100,000Active3 beds 3 baths1,623 sq. ft.
12251 W Village Drive #B, Houston, TX 77039
MLS# 58847267Listed by: REAL BROKER, LLC $299,000Active3 beds 2 baths1,912 sq. ft.
4546 Connorvale Road, Houston, TX 77039
MLS# 35003724Listed by: SIERRA GROUP REALTY $695,000Active3 Acres
13423 Chrisman Road, Houston, TX 77039
MLS# 59895345Listed by: KELLER WILLIAMS HOUSTON CENTRAL $199,999Active4 beds 2 baths1,512 sq. ft.
4519 Anice Street, Houston, TX 77039
MLS# 34906912Listed by: NB ELITE REALTY $80,000Active2 beds 2 baths1,340 sq. ft.
12251 W Village Drive #A, Houston, TX 77039
MLS# 51490163Listed by: REAL BROKER, LLC $139,000Pending3 beds 2 baths1,698 sq. ft.
12203 W Village Drive #C, Houston, TX 77039
MLS# 49970332Listed by: 21ST CENTURY REALTY GROUP,LLC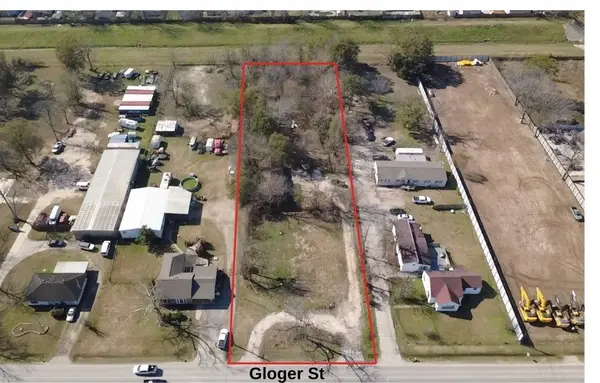 $415,000Active1.58 Acres
11921 Gloger Street, Houston, TX 77039
MLS# 94380992Listed by: THE REYNA GROUP $340,000Active4 beds 3 baths2,810 sq. ft.
4734 Otterbury Drive, Houston, TX 77039
MLS# 49950531Listed by: FITZ & CO. REAL ESTATE $190,000Active3 beds 2 baths990 sq. ft.
3502 Pine Meadow Lane, Houston, TX 77039
MLS# 88246299Listed by: CITY GROUP PROPERTIES $410,000Active0.4 Acres
5618 Etheline Drive, Houston, TX 77039
MLS# 30962532Listed by: RE/MAX UNIVERSAL $90,000Active3 beds 3 baths1,782 sq. ft.
12254 Wild Pine Drive #A, Houston, TX 77039
MLS# 4584913Listed by: KELLER WILLIAMS REALTY METROPOLITAN $234,900Active3 beds 2 baths1,368 sq. ft.
1825 Isom Street, Houston, TX 77039
MLS# 4612295Listed by: J. LINDSEY PROPERTIES $84,990Active2 beds 2 baths1,496 sq. ft.
12211 W Village Drive #B, Houston, TX 77039
MLS# 51947865Listed by: TRILLIONAIRE REALTY $255,000Active3 beds 2 baths1,515 sq. ft.
11923 Shady Meadow Street, Houston, TX 77039
MLS# 65291209Listed by: REVILO REAL ESTATE $70,000Active2 beds 3 baths1,190 sq. ft.
12411 W Village Drive #C, Houston, TX 77039
MLS# 12978797Listed by: REAL BROKER, LLC $1,399,000Active5 beds 5 baths3,926 sq. ft.
2230 Gault Road, Houston, TX 77039
MLS# 65136074Listed by: REAL BROKER, LLC $229,999Active4 beds 2 baths1,258 sq. ft.
4502 Charriton Drive, Houston, TX 77039
MLS# 4315337Listed by: 1ST TEXAS REALTY SERVICES $125,000Active2 beds 2 baths1,619 sq. ft.
12207 W Village Drive #D, Houston, TX 77039
MLS# 30721462Listed by: DESIGNED REALTY GROUP $90,000Active2 beds 3 baths1,313 sq. ft.
12262 Wild Pine Drive #A, Houston, TX 77039
MLS# 90571856Listed by: EATON REAL ESTATE COMPANY,LLC $220,000Active0.49 Acres
11769 Gloger Street, Houston, TX 77039
MLS# 82490285Listed by: THISISLIVIN PROPERTIES, LLC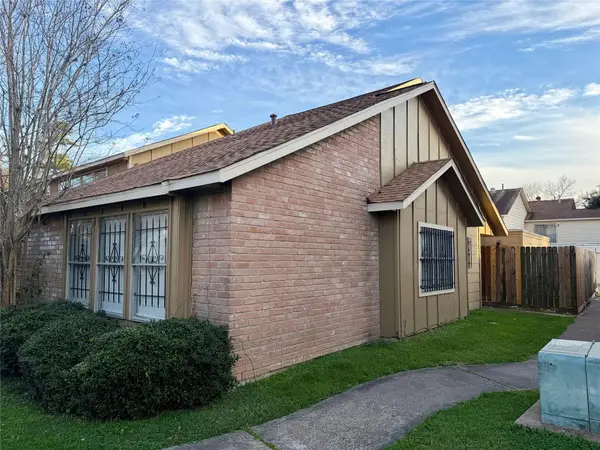 $110,000Active3 beds 2 baths1,563 sq. ft.
12235 W Village Drive #D, Houston, TX 77039
MLS# 82112700Listed by: KELLER WILLIAMS PLATINUM $395,000Active4 beds 4 baths2,150 sq. ft.
2511 Connorvale Road, Houston, TX 77039
MLS# 87383326Listed by: NEXT TREND REALTY LLC $80,000Active2 beds 2 baths1,340 sq. ft.
12319 W Village Drive #D, Houston, TX 77039
MLS# 29880658Listed by: RA BROKERS $210,000Pending3 beds 2 baths1,654 sq. ft.
4627 Hollybrook Lane, Houston, TX 77039
MLS# 21956608Listed by: EXP REALTY LLC $194,999Active3 beds 2 baths1,744 sq. ft.
1527 Debeney Drive, Houston, TX 77039
MLS# 5924494Listed by: PAK HOME REALTY $180,000Active3 beds 2 baths1,563 sq. ft.
4414 Debeney Drive, Houston, TX 77039
MLS# 23810253Listed by: FIV REALTY CO TEXAS LLC $170,000Active3 beds 3 baths1,340 sq. ft.
4903 Connorvale Road, Houston, TX 77039
MLS# 52876762Listed by: COLDWELL BANKER REALTY - GREATER NORTHWEST $575,000Active2 Acres
4705 Lauder Road, Houston, TX 77039
MLS# 70022525Listed by: PRIME REALTY GROUP $115,000Active2 beds 2 baths1,623 sq. ft.
12247 W Village Drive #E, Houston, TX 77039
MLS# 72041166Listed by: GO REAL ESTATE $104,990Active2 beds 2 baths1,659 sq. ft.
12207 W Village Drive #A, Houston, TX 77039
MLS# 97400729Listed by: BETTER HOMES AND GARDENS REAL ESTATE GARY GREENE - THE WOODLANDS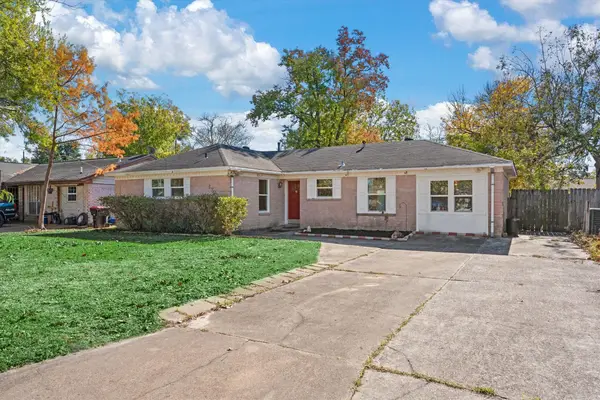 $175,000Pending4 beds 2 baths1,400 sq. ft.
3706 Pear Meadow Lane, Houston, TX 77039
MLS# 54993721Listed by: REAL BROKER, LLC $109,999Active2 beds 2 baths1,496 sq. ft.
12211 W Village Drive #C, Houston, TX 77039
MLS# 83064430Listed by: 1ST TEXAS REALTY SERVICES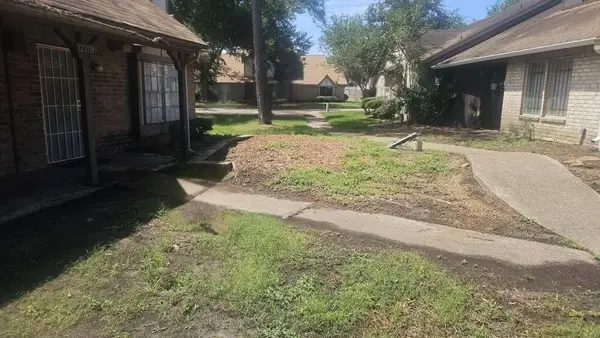 $109,999Active3 beds 2 baths1,748 sq. ft.
12311 W Village Drive #C, Houston, TX 77039
MLS# 16726326Listed by: 1ST TEXAS REALTY SERVICES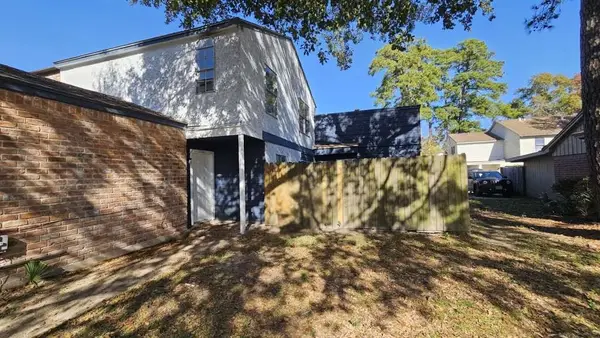 $151,999Active3 beds 2 baths1,410 sq. ft.
12439 W Village Drive #D, Houston, TX 77039
MLS# 93408516Listed by: 1ST TEXAS REALTY SERVICES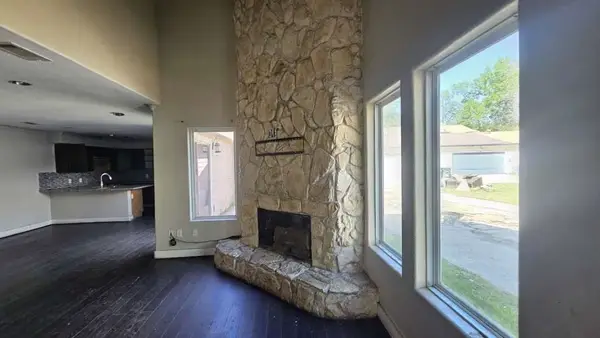 $117,999Active3 beds 3 baths1,623 sq. ft.
5755 Easthampton Drive #C, Houston, TX 77039
MLS# 53867507Listed by: 1ST TEXAS REALTY SERVICES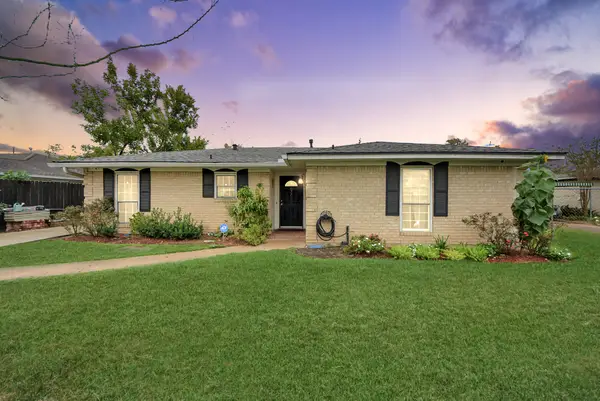 $308,000Active4 beds 3 baths2,134 sq. ft.
2443 Lauder Road, Houston, TX 77039
MLS# 60545533Listed by: WALZEL PROPERTIES - CORPORATE OFFICE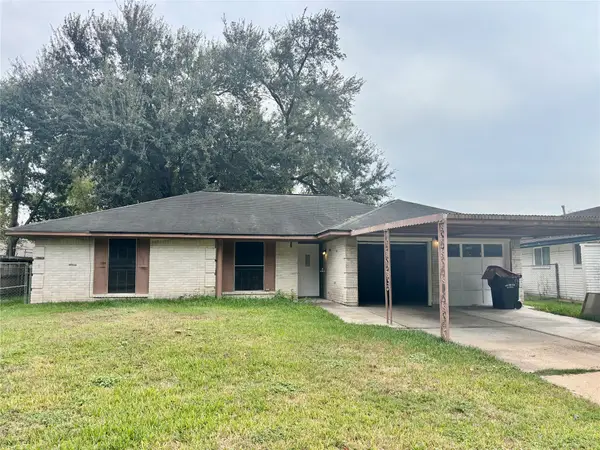 $218,900Active3 beds 2 baths1,355 sq. ft.
4906 Hollybrook Lane, Houston, TX 77039
MLS# 79925511Listed by: PRIME REALTY GROUP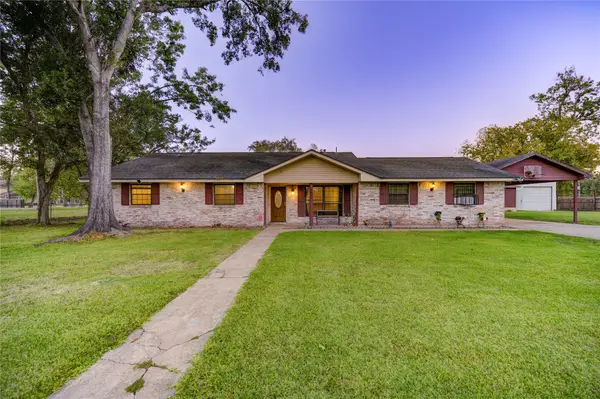 $364,999Active3 beds 2 baths2,311 sq. ft.
2807 Verhalen Avenue, Houston, TX 77039
MLS# 69992042Listed by: JLA REALTY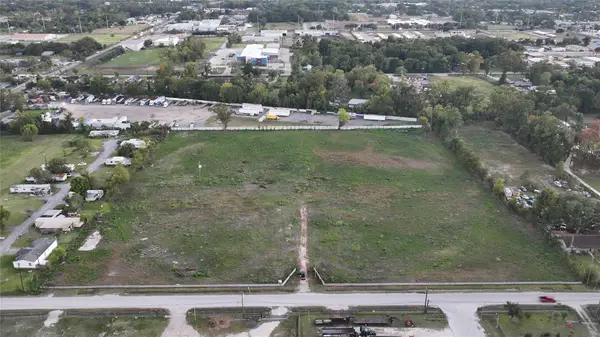 $1,500,000Active9.62 Acres
1826 Gault Road, Houston, TX 77039
MLS# 30883372Listed by: COLDWELL BANKER UNIVERSAL $115,000Active2 beds 3 baths1,721 sq. ft.
5810 Twisted Pine Court #C, Houston, TX 77039
MLS# 65856059Listed by: STONE & FIELDS $229,900Active3 beds 2 baths1,251 sq. ft.
4803 Bethany Lane, Houston, TX 77039
MLS# 92011914Listed by: THE AGENCY TEAM $110,000Active0.21 Acres
14537 Maeline St Street, Houston, TX 77039
MLS# 6032403Listed by: GEORGE E. JOHNSON PROPERTIES LLC $1,200,000Active1.25 Acres
11781 Eastex Freeway, Houston, TX 77039
MLS# 40316992Listed by: SANMORE REALTY $78,000Active3 beds 3 baths1,320 sq. ft.
12427 W Village Drive #B, Houston, TX 77039
MLS# 5425264Listed by: FATHOM REALTY $199,900Active3 beds 2 baths1,629 sq. ft.
5203 Sandydale Lane, Houston, TX 77039
MLS# 95291568Listed by: O'HARA & COMPANY REAL ESTATE $87,000Pending3 beds 3 baths1,560 sq. ft.
12203 Wild Pine Drive #B, Houston, TX 77039
MLS# 78118740Listed by: CB&A, REALTORS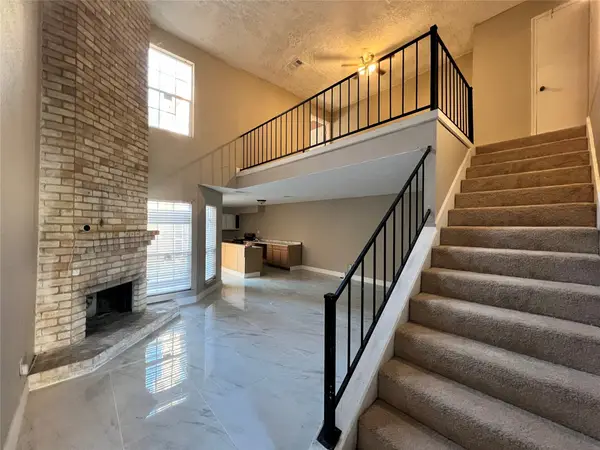 $99,990Active3 beds 2 baths1,534 sq. ft.
12239 W Village Drive #B, Houston, TX 77039
MLS# 86726188Listed by: DALTON WADE INC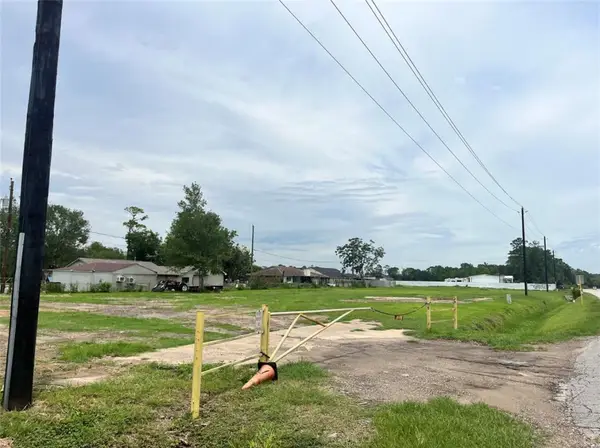 $390,000Active0.16 Acres
0 Lauder Road, Houston, TX 77039
MLS# 59499483Listed by: NEXT TREND REALTY LLC $200,000Active3 beds 2 baths700 sq. ft.
1810 Connorvale Rd Road, Houston, TX 77039
MLS# 43641085Listed by: RED DOOR REALTY & ASSOCIATES $90,000Active2 beds 2 baths1,619 sq. ft.
12223 W Village Drive #D, Houston, TX 77039
MLS# 65492951Listed by: 5TH STREAM REALTY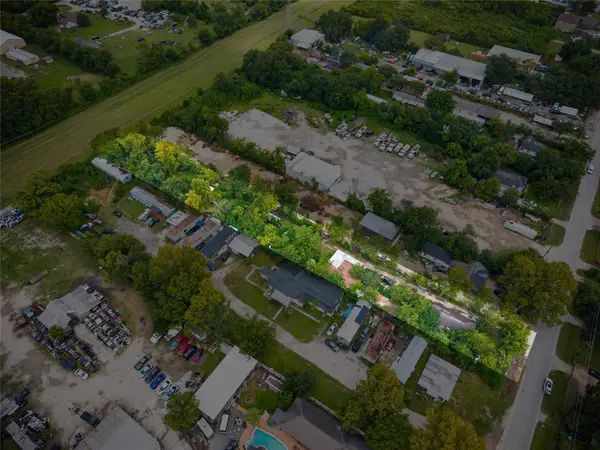 $535,000Active1 Acres
13113 Reeveston Road, Houston, TX 77039
MLS# 6790301Listed by: VIVE REALTY LLC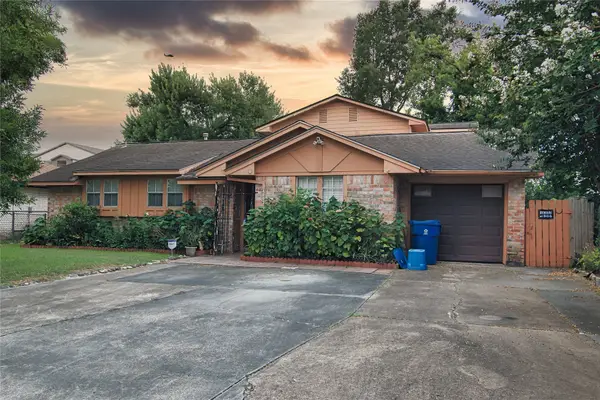 $195,000Active4 beds 4 baths2,407 sq. ft.
4002 Charriton Drive, Houston, TX 77039
MLS# 70078124Listed by: WELCH REALTY $85,000Active3 beds 4 baths1,494 sq. ft.
12411 W Village Drive #D, Houston, TX 77039
MLS# 8613192Listed by: RA BROKERS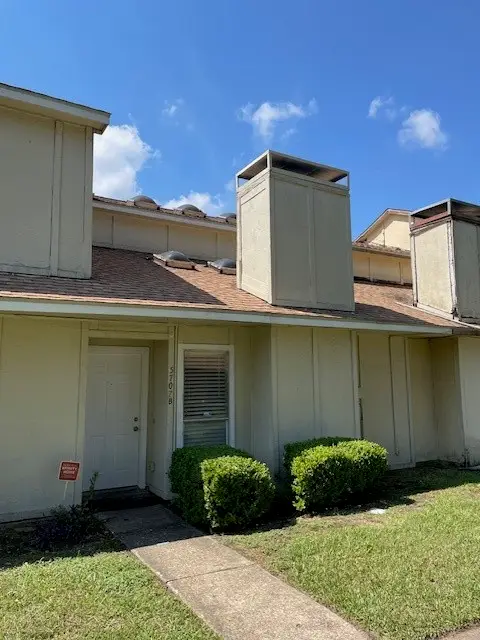 $110,000Active3 beds 2 baths1,493 sq. ft.
5707 Easthampton Drive #B, Houston, TX 77039
MLS# 90442687Listed by: RA BROKERS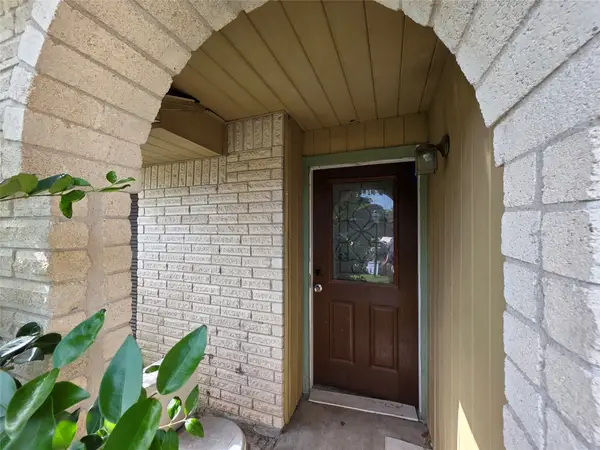 $178,500Pending4 beds 4 baths1,325 sq. ft.
12123 Steeple Lane, Houston, TX 77039
MLS# 25569140Listed by: EXP REALTY LLC $625,000Active3 beds 2 baths4,148 sq. ft.
13310 Robertcrest Street #B, Houston, TX 77039
MLS# 83716142Listed by: PROXY REALTY, INC. $110,900Active2 beds 3 baths1,555 sq. ft.
12223 Wild Pine Drive #D, Houston, TX 77039
MLS# 10025443Listed by: LISTING SPARK $103,999Pending2 beds 2 baths1,056 sq. ft.
5791 Easthampton Drive #A, Houston, TX 77039
MLS# 6695588Listed by: 1ST TEXAS REALTY SERVICES $219,999Active3 beds 2 baths1,485 sq. ft.
4739 Sandydale Lane, Houston, TX 77039
MLS# 87920614Listed by: 1ST TEXAS REALTY SERVICES $99,999Active2 beds 3 baths1,196 sq. ft.
12330 Wild Pine Drive #A, Houston, TX 77039
MLS# 37723672Listed by: EATON REAL ESTATE COMPANY,LLC $80,000Active1 beds 2 baths980 sq. ft.
12242 W Village Drive #A, Houston, TX 77039
MLS# 83539398Listed by: RE/MAX UNIVERSAL $127,000Active3 beds 3 baths1,527 sq. ft.
12223 Wild Pine Drive #C, Houston, TX 77039
MLS# 19057352Listed by: NIKITA GLOBAL REALTY $110,000Active3 beds 2 baths1,728 sq. ft.
12239 W Village Drive #A, Houston, TX 77039
MLS# 71876389Listed by: RA BROKERS $105,000Active2 beds 2 baths1,340 sq. ft.
12215 Wild Pine Drive #C, Houston, TX 77039
MLS# 98212443Listed by: CADENCE REALTY SERVICES $87,000Active0.2 Acres
0 Verhalen Avenue, Houston, TX 77039
MLS# 55752979Listed by: RE/MAX REAL ESTATE ASSOC. $164,899Active3 beds 3 baths1,880 sq. ft.
5802 Twisted Pine Court #D, Houston, TX 77039
MLS# 14930717Listed by: 1ST TEXAS REALTY SERVICES $135,000Active3 beds 3 baths1,623 sq. ft.
12222 Wild Pine Drive #C, Houston, TX 77039
MLS# 17917195Listed by: AMERISTATE REALTY $95,000Active2 beds 2 baths1,313 sq. ft.
12314 Wild Pine Drive #D, Houston, TX 77039
MLS# 84368369Listed by: RA BROKERS $360,000Active3 beds 2 baths2,020 sq. ft.
2710 Woodgate Street, Houston, TX 77039
MLS# 51141573Listed by: HOMESMART $750,000Active3.02 Acres
1730 Strawn Road, Houston, TX 77039
MLS# 39512044Listed by: COLDWELL BANKER REALTY - LAKE CONROE/WILLIS $850,000Active3.18 Acres
1722 Strawn Road, Houston, TX 77039
MLS# 43907357Listed by: COLDWELL BANKER REALTY - LAKE CONROE/WILLIS $950,000Active3.41 Acres
1720 Strawn Road, Houston, TX 77039
MLS# 56849407Listed by: COLDWELL BANKER REALTY - LAKE CONROE/WILLIS $4,800,000Active-- beds -- baths2,698 sq. ft.
13917 Chrisman Road, Houston, TX 77039
MLS# 57675978Listed by: PRIME REALTY GROUP $355,000Active4 beds 2 baths1,772 sq. ft.
2715 Toyah Avenue, Houston, TX 77039
MLS# 16952813Listed by: HOMESMART $2,300,000Active7.5 Acres
1916 Gault Road, Houston, TX 77039
MLS# 55448942Listed by: COLDWELL BANKER REALTY - LAKE CONROE/WILLIS
Local realty services provided by:CENTURY 21 Lucky Money Real Estate
Copyright 2026, Houston Realtors Information Service, Inc. All information provided is deemed reliable but is not guaranteed and should be independently verified. IDX information is provided exclusively for consumers' personal, non-commercial use, it may not be used for any purpose other than to identify prospective properties consumers may be interested in purchasing, and the data is deemed reliable but is not guaranteed accurate by the MLS.
Popular searches near 77039
Popular neighborhoods near 77039
- Acres Home, Houston homes for sale
- Aldine Gardens, Houston homes for sale
- Canyon Gate at Park Lakes, Humble homes for sale
- East Houston, Houston homes for sale
- East Little York / Homestead, Houston homes for sale
- Eastex-Jensen Area, Houston homes for sale
- Fall Creek, Humble homes for sale
- Greater Greenspoint, Houston homes for sale
- Hidden Valley, Houston homes for sale
- Trinity / Houston Gardens, Houston homes for sale
- Houston Suburban Heights, Houston homes for sale
- IAH, Humble homes for sale
- Independence Heights, Houston homes for sale
- Meadowviewland, Houston homes for sale
- North Houston, Houston homes for sale
- Northfield Place, Houston homes for sale
- Northpoint, Houston homes for sale
- Northside, Houston homes for sale
- Remington Ranch, Houston homes for sale
- Scenic Woods, Houston homes for sale
Counties near Houston, 77039
- Austin County homes for sale
- Brazoria County homes for sale
- Brazos County homes for sale
- Chambers County homes for sale
- Colorado County homes for sale
- Fort Bend County homes for sale
- Galveston County homes for sale
- Grimes County homes for sale
- Hardin County homes for sale
- Harris County homes for sale
- Jefferson County homes for sale
- Liberty County homes for sale
- Madison County homes for sale
- Montgomery County homes for sale
- Polk County homes for sale
- San Jacinto County homes for sale
- Walker County homes for sale
- Waller County homes for sale
- Washington County homes for sale
- Wharton County homes for sale
Protect your home and budget from life's surprises with an Assurant Home Warranty, backed by a partner that supports you through every step of homeownership. Explore Plans.
©2026 Century 21 Real Estate LLC. All rights reserved. CENTURY 21®, the CENTURY 21 Logo and C21® are service marks owned by Century 21 Real Estate LLC. Century 21 Real Estate LLC fully supports the principles of the Fair Housing Act and the Equal Opportunity Act. Each office is independently owned and operated. Listing information is deemed reliable but not guaranteed accurate.