- Back Central, Lowell homes for sale
- Belvidere, Lowell homes for sale
- Centralville, Lowell homes for sale
- Crystal Lake, Manchester homes for sale
- Downtown Lowell, Lowell homes for sale
- Goffes Falls, Manchester homes for sale
- Highlands, Manchester homes for sale
- Highlands, Lowell homes for sale
- Lower Belvidere, Lowell homes for sale
- Lower Highlands, Lowell homes for sale
- Lower South Willow, Manchester homes for sale
- North End, Nashua homes for sale
- Outside the Belt, Manchester homes for sale
- Pawtucketville, Lowell homes for sale
- Sacred Heart, Lowell homes for sale
- South End, Nashua homes for sale
- South Lowell, Lowell homes for sale
- Southeast Manchester, Manchester homes for sale
- The Acre, Lowell homes for sale
- Tree Streets, Nashua homes for sale
Hudson, NH - homes for sale
13 of 13 results displayed
 $599,900Active3 beds 3 baths2,004 sq. ft.
24 B Windsor Lane #10, Hudson, NH 03051
MLS# 5078644Listed by: BHHS VERANI LONDONDERRY
- Open Sat, 11am to 2pmNew
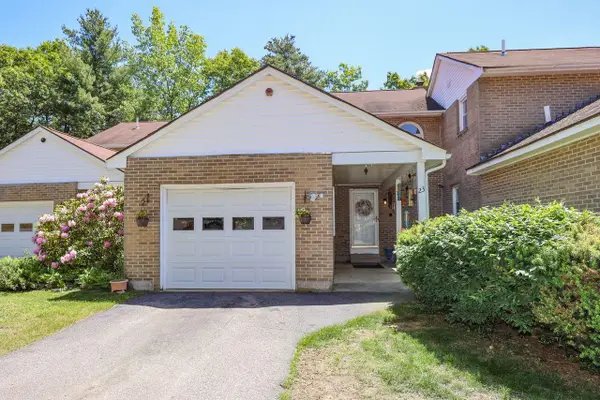 $390,000Active2 beds 2 baths1,235 sq. ft.
23 Bonnie Heights Lane #7, Hudson, NH 03051
MLS# 5093895Listed by: COLDWELL BANKER REALTY BEDFORD NH - New
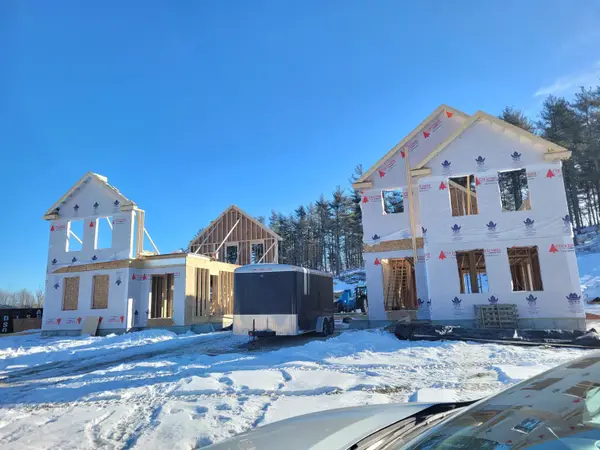
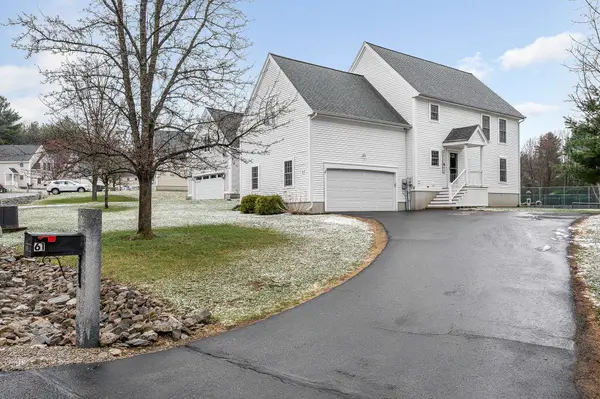 $589,900Active3 beds 3 baths1,920 sq. ft.
61 Barbara Lane, Hudson, NH 03051
MLS# 5093217Listed by: RE/MAX INNOVATIVE PROPERTIES  $625,000Pending2 beds 2 baths1,677 sq. ft.
125 Brody Lane, Hudson, NH 03051
MLS# 5092978Listed by: ROUSSEL REALTY, LLC $450,000Active3 beds 2 baths1,611 sq. ft.
55 Melendy Road #B, Hudson, NH 03051
MLS# 5092723Listed by: LPT REALTY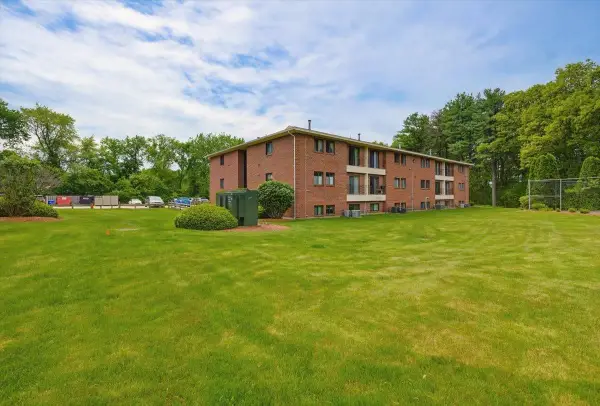 $284,900Active2 beds 1 baths974 sq. ft.
525 Abbott Farm Lane, Hudson, NH 03051
MLS# 5091190Listed by: LAER REALTY PARTNERS/CHELMSFORD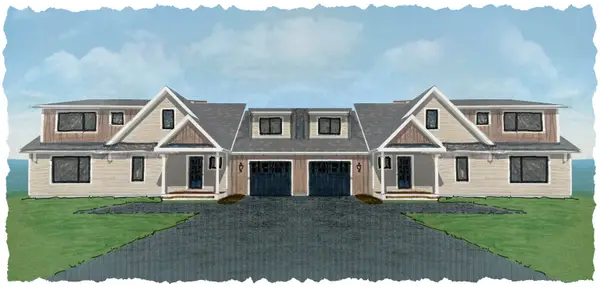 $624,900Pending3 beds 3 baths2,046 sq. ft.
31B Windsor Lane #4, Hudson, NH 03051
MLS# 5084084Listed by: BHHS VERANI LONDONDERRY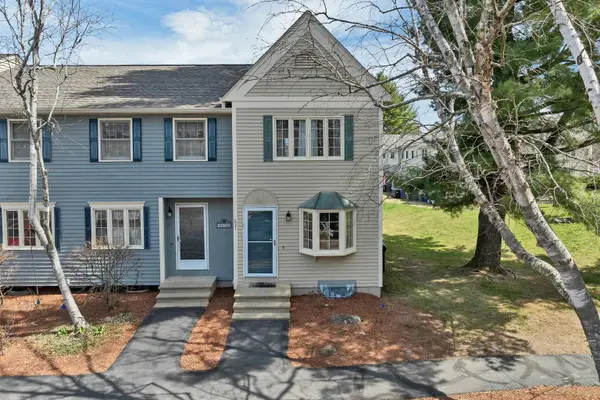 $399,900Active2 beds 2 baths1,036 sq. ft.
631 Fox Hollow Drive, Hudson, NH 03051
MLS# 5083325Listed by: KELLER WILLIAMS REALTY METRO-CONCORD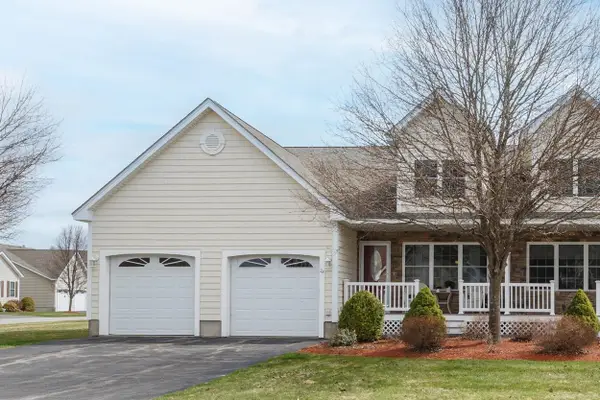 $590,000Pending2 beds 2 baths2,018 sq. ft.
2A Taunton Lane, Hudson, NH 03051
MLS# 5082781Listed by: BHHS VERANI LONDONDERRY $624,900Pending3 beds 3 baths2,046 sq. ft.
31A Windsor Lane #4, Hudson, NH 03051
MLS# 5081889Listed by: BHHS VERANI LONDONDERRY $525,000Active3 beds 2 baths2 sq. ft.
39 Library Street, Hudson, NH 03051
MLS# 5044145Listed by: NAI NORWOOD GROUP $365,000Active3 beds 1 baths2 sq. ft.
37 Library Street, Hudson, NH 03051
MLS# 5044143Listed by: NAI NORWOOD GROUP $599,999Pending2 beds 2 baths1,557 sq. ft.
113 Brody Lane, Hudson, NH 03051
MLS# 5038289Listed by: DOHERTY PROPERTIES, LLC
Local realty services provided by:CENTURY 21 Farm & Forest
Copyright 2026 Prime MLS, Inc. All rights reserved. This information is deemed reliable, but not guaranteed. The data relating to real estate displayed on this Site comes in part from the IDX Program of Prime MLS. The information being provided is for consumers’ personal, noncommercial use and may not be used for any purpose other than to identify prospective properties consumers may be interested in purchasing. Data last updated June 17, 2026 NH_NNEREN Member Broker: Nicholas Maclure
Neighborhoods near Hudson, NH
Zip codes near Hudson, NH
- 01463 homes for sale
- 01826 homes for sale
- 01827 homes for sale
- 01850 homes for sale
- 01851 homes for sale
- 01854 homes for sale
- 01863 homes for sale
- 01879 homes for sale
- 03049 homes for sale
- 03051 homes for sale
- 03052 homes for sale
- 03053 homes for sale
- 03054 homes for sale
- 03060 homes for sale
- 03062 homes for sale
- 03063 homes for sale
- 03064 homes for sale
- 03076 homes for sale
- 03079 homes for sale
- 03087 homes for sale
Popular searches near Hudson, NH
- Dracut homes for sale
- Dunstable homes for sale
- East Merrimack homes for sale
- East Pepperell homes for sale
- Hollis homes for sale
- Hudson town homes for sale
- Litchfield homes for sale
- Londonderry town homes for sale
- Londonderry homes for sale
- Lowell homes for sale
- Merrimack homes for sale
- Nashua homes for sale
- North Chelmsford homes for sale
- Pelham homes for sale
- Pepperell homes for sale
- Pepperell town homes for sale
- Salem homes for sale
- Tyngsboro homes for sale
- Tyngsborough homes for sale
- Windham homes for sale
Protect your home and budget from life's surprises with an Assurant Home Warranty, backed by a partner that supports you through every step of homeownership. Explore Plans.
©2026 Century 21 Real Estate LLC. All rights reserved. CENTURY 21®, the CENTURY 21 Logo and C21® are service marks owned by Century 21 Real Estate LLC. Century 21 Real Estate LLC fully supports the principles of the Fair Housing Act and the Equal Opportunity Act. Each office is independently owned and operated. Listing information is deemed reliable but not guaranteed accurate.