- Affton, Saint Louis homes for sale
- Arnold, Arnold homes for sale
- Barnhart, Barnhart homes for sale
- Bella Villa, Saint Louis homes for sale
- Concord, Saint Louis homes for sale
- Crystal City, Crystal City homes for sale
- Fenton, Fenton homes for sale
- Forest Haven, Imperial homes for sale
- Green Park, Saint Louis homes for sale
- High Ridge, High Ridge homes for sale
- Imperial, Imperial homes for sale
- Lakeshire, Saint Louis homes for sale
- Lemay, Saint Louis homes for sale
- Mehlville, Saint Louis homes for sale
- Murphy, Fenton homes for sale
- Oakville, Saint Louis homes for sale
- St. George, Saint Louis homes for sale
- Sappington, Saint Louis homes for sale
- South County, Saint Louis homes for sale
- Sunset Hills, Saint Louis homes for sale
Imperial, MO - homes for sale
21 of 21 results displayed
- New
 $224,900Active2 beds 1 baths886 sq. ft.
1121 Wolf Hollow Road, Imperial, MO 63052
MLS# 26027455Listed by: EXIT ELITE REALTY - New
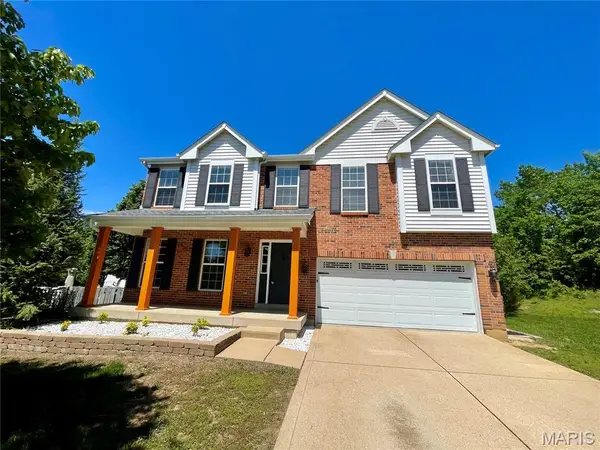 $384,500Active4 beds 3 baths2,800 sq. ft.
3 Oak Mill Court, Imperial, MO 63052
MLS# 26025428Listed by: AUSTIN REALTY - Open Sat, 1 to 3pmNew
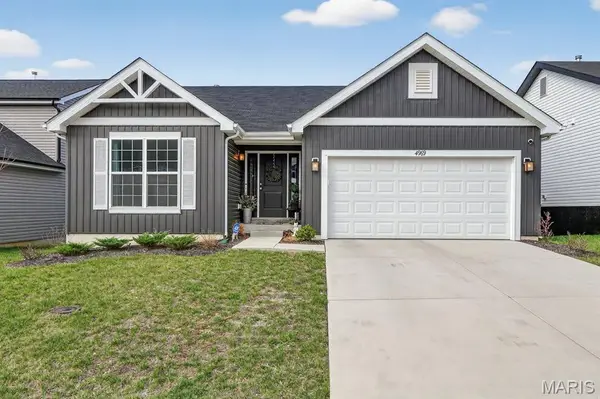 $349,900Active3 beds 2 baths1,279 sq. ft.
4969 Knotty Alder Drive, Imperial, MO 63052
MLS# 26026200Listed by: THE AGENCY  $309,900Pending3 beds 3 baths1,509 sq. ft.
5170 Darkmoor Lane, Imperial, MO 63052
MLS# 26024092Listed by: GATEWAY REAL ESTATE $239,900Active-- beds -- baths2,684 sq. ft.
1213 Noah Drive, Imperial, MO 63052
MLS# 26023209Listed by: SALIENT REALTY GROUP, LLC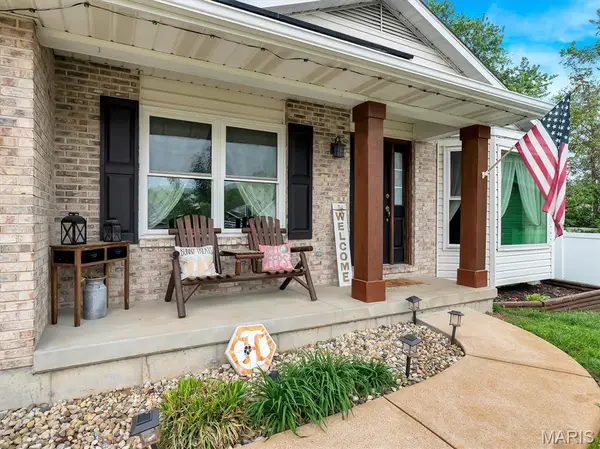 $309,999Pending3 beds 3 baths2,214 sq. ft.
1605 Paradise Landing, Imperial, MO 63052
MLS# 26022368Listed by: RE/MAX RESULTS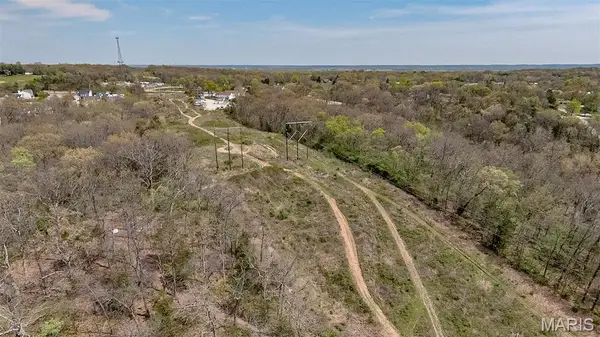 $250,000Active16.74 Acres
0 Black Creek Rd, Imperial, MO 63052
MLS# 26018265Listed by: EXP REALTY, LLC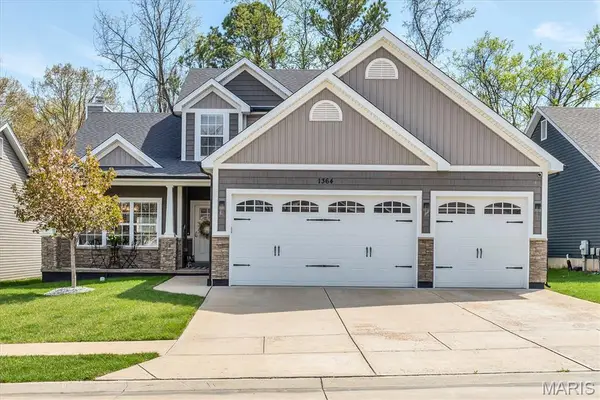 $450,000Pending3 beds 3 baths2,479 sq. ft.
1364 Grey Wolf Drive, Imperial, MO 63052
MLS# 26021086Listed by: RE/MAX RESULTS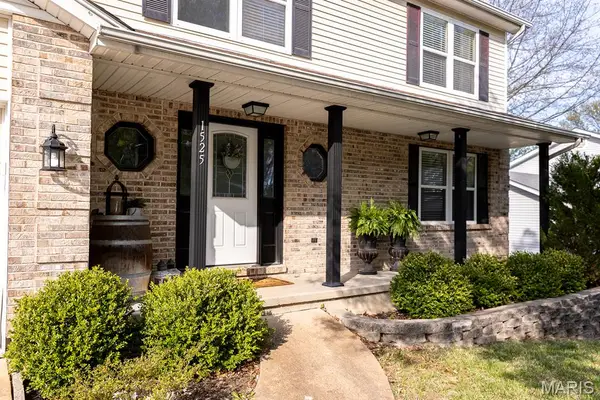 $335,000Pending4 beds 3 baths2,100 sq. ft.
1525 Prehistoric Hill Drive, Imperial, MO 63052
MLS# 26021523Listed by: COLDWELL BANKER REALTY - GUNDAKER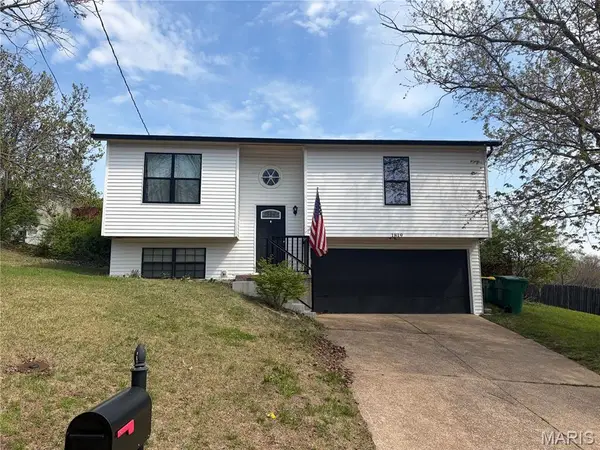 $239,900Pending2 beds 2 baths1,264 sq. ft.
1819 Chippendale Lane, Imperial, MO 63052
MLS# 26019794Listed by: KELLER WILLIAMS CHESTERFIELD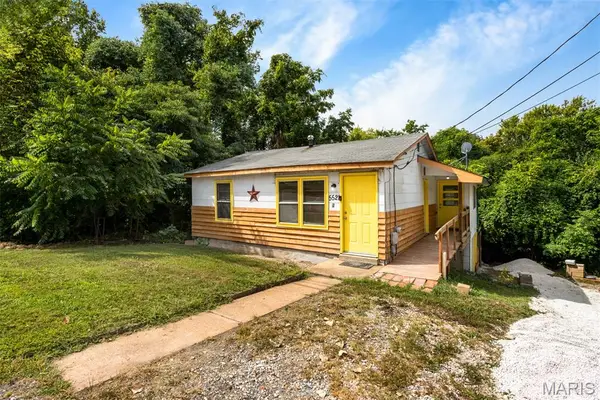 $175,000Active2 beds 1 baths936 sq. ft.
5521 Us Highway 61 67, Imperial, MO 63052
MLS# 26021084Listed by: ST. LOUIS REAL ESTATE CO $385,000Pending3 beds 3 baths3,243 sq. ft.
6570 Ike Drive, Barnhart, MO 63012
MLS# 26018797Listed by: REDFIN CORPORATION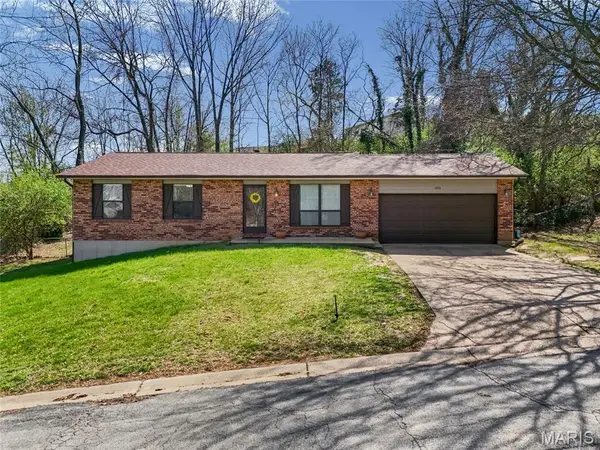 $265,000Pending4 beds 2 baths1,830 sq. ft.
1846 Brandywine Place, Imperial, MO 63052
MLS# 26012094Listed by: EXP REALTY, LLC $469,900Pending3 beds 4 baths3,682 sq. ft.
1473 Grey Wolf Drive, Imperial, MO 63052
MLS# 26018054Listed by: GATEWAY REAL ESTATE $290,000Pending3 beds 2 baths1,300 sq. ft.
5532 Lehigh Lane, Imperial, MO 63052
MLS# 26015833Listed by: EXP REALTY, LLC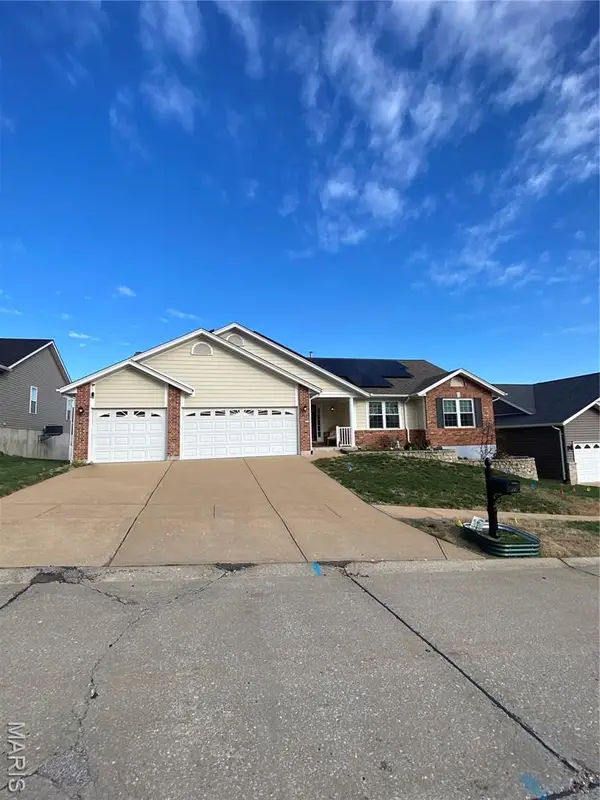 $405,000Pending3 beds 2 baths1,840 sq. ft.
5035 Annette Drive, Imperial, MO 63052
MLS# 26015980Listed by: RE/MAX LAKE OF THE OZARKS $310,000Pending2 beds 3 baths2,232 sq. ft.
1530 1st Street, Barnhart, MO 63012
MLS# 26011144Listed by: THREE DOORS LLC- Open Sat, 12 to 3pm
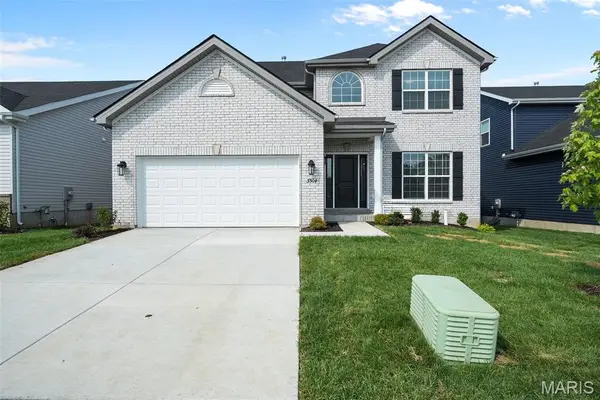 $459,900Active4 beds 3 baths2,001 sq. ft.
3304 White Pine Drive, Imperial, MO 63052
MLS# 26011936Listed by: LISTWITHFREEDOM.COM INC 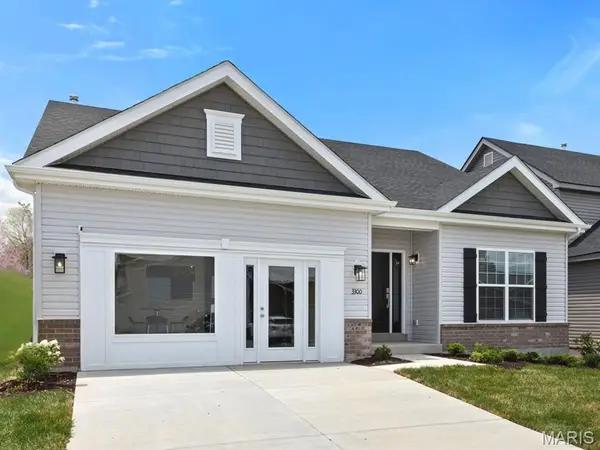 $444,900Active3 beds 2 baths1,579 sq. ft.
3300 White Pine Drive, Imperial, MO 63052
MLS# 26008382Listed by: LISTWITHFREEDOM.COM INC $244,900Active4 beds 2 baths960 sq. ft.
1165 New Towne Road, Arnold, MO 63010
MLS# 25082858Listed by: MAIN KEY REALTY LLC $110,000Active2.75 Acres
1001 Willow Bend Road, Imperial, MO 63052
MLS# 25029195Listed by: HEARTH 2 HOME LLC
Local realty services provided by:CENTURY 21 Premiere Realty
Copyright 2026 Mid-America Regional Information Systems. All rights reserved. Listings courtesy of Mid-America Regional Information Systems as distributed by MLS GRID <Last Updated May 3, 2026. Mid-America Regional Information Systems provides content displayed here (“provided content”) on an “as is” basis and makes no representations or warranties regarding the provided content, including, but not limited to those of non-infringement, timeliness, accuracy, or completeness. Individuals and companies using information presented are responsible for verification and validation of information they utilize and present to their customers and clients. Mid-America Regional Information Systems will not be liable for any damage or loss resulting from use of the provided content or the products available through Portals, IDX, VOW, and/or Syndication. Recipients of this information shall not resell, redistribute, reproduce, modify, or otherwise copy any portion thereof without the expressed written consent of Mid-America Regional Information Systems.
Neighborhoods near Imperial, MO
Zip codes near Imperial, MO
- 62236 homes for sale
- 62239 homes for sale
- 62295 homes for sale
- 62298 homes for sale
- 63010 homes for sale
- 63012 homes for sale
- 63019 homes for sale
- 63026 homes for sale
- 63048 homes for sale
- 63049 homes for sale
- 63050 homes for sale
- 63051 homes for sale
- 63052 homes for sale
- 63070 homes for sale
- 63123 homes for sale
- 63125 homes for sale
- 63126 homes for sale
- 63127 homes for sale
- 63128 homes for sale
- 63129 homes for sale
Popular searches near Imperial, MO
- Arnold homes for sale
- Barnhart homes for sale
- Concord homes for sale
- Crystal City homes for sale
- Fenton homes for sale
- Festus homes for sale
- Herculaneum homes for sale
- High Ridge homes for sale
- Imperial township homes for sale
- Joachim homes for sale
- Mehlville homes for sale
- Murphy homes for sale
- Oakville homes for sale
- Pevely homes for sale
- River View homes for sale
- Rock homes for sale
- Sappington homes for sale
- Tesson Ferry homes for sale
- Valmeyer homes for sale
- Windsor homes for sale
Protect your home and budget from life's surprises with an Assurant Home Warranty, backed by a partner that supports you through every step of homeownership. Explore Plans.
©2026 Century 21 Real Estate LLC. All rights reserved. CENTURY 21®, the CENTURY 21 Logo and C21® are service marks owned by Century 21 Real Estate LLC. Century 21 Real Estate LLC fully supports the principles of the Fair Housing Act and the Equal Opportunity Act. Each office is independently owned and operated. Listing information is deemed reliable but not guaranteed accurate.