- Bermuda Dunes homes for sale
- Cathedral City homes for sale
- Cathedral City-Palm Desert homes for sale
- Coachella homes for sale
- Coachella Valley homes for sale
- Desert Edge homes for sale
- Desert Palms homes for sale
- Indian Wells homes for sale
- Indio homes for sale
- Indio Hills homes for sale
- La Quinta homes for sale
- Mecca homes for sale
- Oasis homes for sale
- Palm Desert homes for sale
- Palm Springs homes for sale
- Rancho Mirage homes for sale
- Sky Valley homes for sale
- Thermal homes for sale
- Thousand Palms homes for sale
- Vista Santa Rosa homes for sale
92201, CA - homes for sale
300 of 310 results displayed
- New
 $595,000Active3 beds 2 baths1,831 sq. ft.
44074 Royal Troon Drive, Indio, CA 92201
MLS# 219144003DAListed by: ENGEL & VOLKERS PALM DESERT - New
 $499,000Active2 beds 2 baths1,707 sq. ft.
44018 Royal Troon Drive, Indio, CA 92201
MLS# 219143968DAListed by: BERKSHIRE HATHAWAY HOMESERVICES CALIFORNIA PROPERTIES - New
 $589,700Active3 beds 3 baths1,995 sq. ft.
49345 Beatty Street, Indio, CA 92201
MLS# 219143911DAListed by: BENNION DEVILLE HOMES - New
 $645,000Active2 beds 2 baths1,878 sq. ft.
82707 Woodcreek Court, Indio, CA 92201
MLS# 219143883DAListed by: COMPASS - New
 $480,000Active3 beds 3 baths2,833 sq. ft.
82237 Bliss Avenue, Indio, CA 92201
MLS# 219143866DAListed by: EFREN MENDEZ, BROKER - New
 $1,095,000Active4 beds 4 baths2,670 sq. ft.
58100 Aragon Way, Indio, CA 92201
MLS# 219143848DAListed by: RE/MAX ALL-PRO - New
 $515,000Active3 beds 2 baths1,475 sq. ft.
46482 Jasmine, Indio, CA 92201
MLS# IG26037134Listed by: KELLER WILLIAMS REALTY - New
 $520,000Active3 beds 2 baths1,109 sq. ft.
80634 Princeton Avenue, Indio, CA 92201
MLS# 219143731DAListed by: HOMESMART - New
 $599,000Active3 beds 2 baths2,168 sq. ft.
45254 Crystal Springs, Indio, CA 92201
MLS# CV26039536Listed by: RE/MAX INNOVATIONS - New
 $519,000Active3 beds 3 baths2,180 sq. ft.
48834 Barrymore, Indio, CA 92201
MLS# IG26038721Listed by: KELLER WILLIAMS-LA QUINTA - New
 $669,000Active2 beds 2 baths1,878 sq. ft.
82707 Monarchos, Indio, CA 92201
MLS# 219143590DAListed by: COLDWELL BANKER REALTY - New
 $556,000Active3 beds 2 baths1,718 sq. ft.
45210 Palmwood Drive, Indio, CA 92201
MLS# 219143582DAListed by: DARRYL JOEL FREED, BROKER - New
 $559,000Active4 beds 2 baths2,035 sq. ft.
47496 Manteca Court, Indio, CA 92201
MLS# 219143542DAListed by: BBS BROKERS REALTY - New
 $839,000Active4 beds 4 baths2,590 sq. ft.
48194 Newport Bridge Place, Indio, CA 92201
MLS# 219143551DAListed by: COOL DIGS  $682,536Pending4 beds 4 baths2,480 sq. ft.
83207 Verio Way, Indio, CA 92201
MLS# SW26036400Listed by: D R HORTON AMERICA'S BUILDER $649,900Active3 beds 2 baths1,618 sq. ft.
49976 Eastwood, Indio, CA 92201
MLS# OC26036318Listed by: RE/MAX COASTAL HOMES $230,000Active2 beds 2 baths994 sq. ft.
45546 Aladdin Street #B101, Indio, CA 92201
MLS# PW26034472Listed by: SUNSET REALTY $510,000Active2 beds 2 baths2,020 sq. ft.
80405 Portobello Drive, Indio, CA 92201
MLS# 219143352DAListed by: BERKSHIRE HATHAWAY HOMESERVICES CALIFORNIA PROPERTIES $689,999Active4 beds 2 baths1,721 sq. ft.
82235 Calico Avenue, Indio, CA 92201
MLS# 219143331DAListed by: HOMESMART $544,000Active4 beds 3 baths2,066 sq. ft.
48423 Hepburn Drive, Indio, CA 92201
MLS# 219143307DAListed by: HOMESMART $515,000Active2 beds 2 baths1,764 sq. ft.
43391 Saint Andrews Drive, Indio, CA 92201
MLS# 219143304DAListed by: BERKSHIRE HATHAWAY HOMESERVICES CALIFORNIA PROPERTIES $330,000Active2 beds 1 baths842 sq. ft.
82193 Orange Grove Avenue, Indio, CA 92201
MLS# CRCV26034117Listed by: HOMEQUEST REAL ESTATE $594,968Active3 beds 3 baths1,996 sq. ft.
48893 Patton Lane, Indio, CA 92201
MLS# 219143252DAListed by: GALLERY MARKETING GROUP, INC. $542,000Active3 beds 2 baths1,529 sq. ft.
45595 Banff Springs Street, Indio, CA 92201
MLS# 219143254DAListed by: INDIAN SPRINGS REAL ESTATE $599,000Active3 beds 3 baths2,114 sq. ft.
80046 Canyon Club Court, Indio, CA 92201
MLS# 219143247DAListed by: EQUITY UNION $715,000Active3 beds 3 baths2,504 sq. ft.
43319 N Heritage Palms Drive N, Indio, CA 92201
MLS# 219143237DAListed by: BERKSHIRE HATHAWAY HOMESERVICES CALIFORNIA PROPERTIES $640,000Active2 beds 2 baths1,707 sq. ft.
43682 Old Troon Court, Indio, CA 92201
MLS# 219143241DAListed by: HOMESMART $525,000Active3 beds 3 baths2,092 sq. ft.
82783 Burnette Drive, Indio, CA 92201
MLS# CL26651141PSListed by: KELLER WILLIAMS LUXURY HOMES $674,900Active2 beds 2 baths1,622 sq. ft.
50685 Bee Canyon Drive, Indio, CA 92201
MLS# CL26651633Listed by: COMPASS $720,000Active3 beds 3 baths1,981 sq. ft.
45347 Big Canyon Street, Indio, CA 92201
MLS# 219143168DAListed by: RE/MAX AREA EXPERTS $650,000Active4 beds 4 baths2,264 sq. ft.
82527 Grant Drive, Indio, CA 92201
MLS# CRPW26032949Listed by: TOM RUGE, BROKER $699,000Active2 beds 2 baths1,929 sq. ft.
51647 Rolling Green Court, Indio, CA 92201
MLS# IG26031841Listed by: KELLER WILLIAMS-LA QUINTA $660,000Active3 beds 3 baths2,495 sq. ft.
49438 Douglas Street, Indio, CA 92201
MLS# 219143129DAListed by: COLDWELL BANKER REALTY $1,075,000Active3 beds 4 baths2,973 sq. ft.
51250 Charlbury Street, Indio, CA 92201
MLS# 219143128DAListed by: COMPASS $579,000Active2 beds 2 baths1,766 sq. ft.
80523 Dunbar Drive, Indio, CA 92201
MLS# 219143113DAListed by: DEAL DONE, INC $699,000Active5 beds 3 baths2,687 sq. ft.
80618 Declaration, Indio, CA 92201
MLS# PW26032154Listed by: REAL ESTATE EBROKER INC- Open Sat, 11am to 1pm
 $464,800Active2 beds 2 baths1,523 sq. ft.
80234 Royal Dornoch Drive, Indio, CA 92201
MLS# 219142861DAListed by: KELLER WILLIAMS REALTY  $575,000Active2 beds 2 baths1,542 sq. ft.
51620 Sidewinder Drive, Indio, CA 92201
MLS# 219143091DAListed by: COLDWELL BANKER REALTY $230,000Active2 beds 2 baths1,549 sq. ft.
82625 Requa Avenue, Indio, CA 92201
MLS# PW26031969Listed by: EXP REALTY OF CALIFORNIA INC $545,000Active3 beds 2 baths1,500 sq. ft.
80559 Virginia Avenue, Indio, CA 92201
MLS# 219143041DAListed by: DESERT SANDS REALTY $350,000Pending3 beds 2 baths988 sq. ft.
83160 Tourmaline Avenue, Indio, CA 92201
MLS# 219143001DAListed by: EFREN MENDEZ, BROKER $1,550,000Active3 beds 4 baths3,150 sq. ft.
49347 Gila River Street, Indio, CA 92201
MLS# 219142996DAListed by: BPO HOMES $1,895,000Active5 beds 5 baths3,229 sq. ft.
81084 Falling Leaf Court, Indio, CA 92201
MLS# 219142979DAListed by: RENNIE GROUP $400,000Pending5 beds 4 baths1,690 sq. ft.
45671 Deglet Noor Street, Indio, CA 92201
MLS# 219142920PSListed by: BENNION DEVILLE HOMES $650,000Active3 beds 2 baths1,847 sq. ft.
50700 Havasu Falls Drive, Indio, CA 92201
MLS# 219142940DAListed by: COMPASS $399,000Active2 beds 2 baths1,342 sq. ft.
51578 Golden Eagle Drive, Indio, CA 92201
MLS# 219142908DAListed by: BENNION DEVILLE HOMES $535,000Active4 beds 2 baths1,433 sq. ft.
80928 Brown St, Indio, CA 92201
MLS# 219142886DAListed by: DESERT SANDS REALTY $365,000Active2 beds 2 baths1,122 sq. ft.
80278 Royal Dornoch Drive, Indio, CA 92201
MLS# 219142868DAListed by: EQUITY UNION $535,000Active2 beds 2 baths1,777 sq. ft.
82807 Burnette, Indio, CA 92201
MLS# SB26023847Listed by: KELLER WILLIAMS REALTY $595,000Active3 beds 3 baths1,683 sq. ft.
80940 Shenandoah, Indio, CA 92201
MLS# CRCV26018732Listed by: ANOMALY REAL ESTATE $724,000Active3 beds 2 baths1,529 sq. ft.
45137 Big Canyon Street, Indio, CA 92201
MLS# 219142860DAListed by: INDIAN SPRINGS REAL ESTATE $595,000Active4 beds 3 baths2,085 sq. ft.
48167 Calle Del Sol, Indio, CA 92201
MLS# 219142845DAListed by: BBS BROKERS REALTY $682,000Active3 beds 3 baths2,044 sq. ft.
49714 Newman Circle, Indio, CA 92201
MLS# 219142821DAListed by: KELLER WILLIAMS REALTY $625,000Active2 beds 2 baths1,766 sq. ft.
80534 Knightswood Road, Indio, CA 92201
MLS# 219142793DAListed by: BERKSHIRE HATHAWAY HOMESERVICES CALIFORNIA PROPERTIES $597,777Active3 beds 2 baths1,928 sq. ft.
82570 E Mccarroll Drive, Indio, CA 92201
MLS# 219142709DAListed by: LAS PALMAS REALTY $440,000Pending3 beds 3 baths1,276 sq. ft.
82474 Priscilla Court, Indio, CA 92201
MLS# 219142714DAListed by: JESUS MARTINEZ, BROKER $687,613Pending4 beds 4 baths2,480 sq. ft.
83210 Pintail Lane, Indio, CA 92201
MLS# SW26026147Listed by: D R HORTON AMERICA'S BUILDER $430,000Pending4 beds 2 baths1,470 sq. ft.
81315 Riverlane Drive, Indio, CA 92201
MLS# 219142707DAListed by: CAPITIS REAL ESTATE $617,894Active5 beds 3 baths2,311 sq. ft.
49447 Meadowlark Place, Indio, CA 92201
MLS# CRSW26025973Listed by: D R HORTON AMERICA'S BUILDER $622,380Active4 beds 3 baths2,259 sq. ft.
83161 Pintail Lane, Indio, CA 92201
MLS# CRSW26026029Listed by: D R HORTON AMERICA'S BUILDER $425,000Active2 beds 2 baths1,294 sq. ft.
51538 Golden Eagle Drive, Indio, CA 92201
MLS# 219142665DAListed by: EQUITY UNION $575,000Active3 beds 2 baths1,750 sq. ft.
49239 Barrymore Street, Indio, CA 92201
MLS# OC26024601Listed by: EXP REALTY OF GREATER LOS ANGELES, INC. $769,000Active4 beds 3 baths2,617 sq. ft.
82400 Cantor Circle, Indio, CA 92201
MLS# 219142630DAListed by: QUINLAN & ASSOCIATES $580,000Active4 beds 2 baths1,460 sq. ft.
80957 Rio Grande Avenue, Indio, CA 92201
MLS# CRGD26023617Listed by: EQUITY UNION $1,799,000Active5 beds 4 baths3,308 sq. ft.
48789 Cascade Street, Indio, CA 92201
MLS# 219142556DAListed by: KW COACHELLA VALLEY $485,000Active3 beds 2 baths1,360 sq. ft.
45882 Coco Palm Drive, Indio, CA 92201
MLS# CL26645875PSListed by: HOMESMART PROFESSIONALS $617,745Active3 beds 3 baths2,268 sq. ft.
82725 Ryan Way, Indio, CA 92201
MLS# 219142454DAListed by: GALLERY MARKETING GROUP, INC. $479,000Pending3 beds 2 baths1,357 sq. ft.
82387 Painted Canyon Avenue, Indio, CA 92201
MLS# 219142383DAListed by: JESUS MARTINEZ, BROKER $409,000Active2 beds 2 baths1,720 sq. ft.
80717 Turnberry Court, Indio, CA 92201
MLS# 219142368DAListed by: RIVIERA WEST REALTORS, INC. $539,900Active5 beds 2 baths1,873 sq. ft.
48180 Chandler Court, Indio, CA 92201
MLS# 219142341DAListed by: EPIQUE REALTY $715,000Active5 beds 3 baths1,769 sq. ft.
80623 Veranda Lane, Indio, CA 92201
MLS# 219142342DAListed by: COLDWELL BANKER REALTY $140,000Pending2 beds 1 baths1,050 sq. ft.
44725 Palm Street, Indio, CA 92201
MLS# PW26021230Listed by: EXP REALTY OF CALIFORNIA INC $625,000Active3 beds 3 baths1,995 sq. ft.
82692 Burnette Drive, Indio, CA 92201
MLS# 219142311DAListed by: COLDWELL BANKER REALTY $799,000Active2 beds 2 baths1,927 sq. ft.
51653 Rolling Green Court, Indio, CA 92201
MLS# 219142298DAListed by: MOUNTAIN VIEW PREMIER REALTY $589,900Active3 beds 2 baths1,927 sq. ft.
82660 E Mccarroll Drive, Indio, CA 92201
MLS# 219142289DAListed by: COLDWELL BANKER REALTY $749,000Active4 beds 4 baths2,061 sq. ft.
81358 Avenida Blanca, Indio, CA 92201
MLS# 219142254DAListed by: COLDWELL BANKER REALTY $449,900Active4 beds 2 baths1,418 sq. ft.
82432 Deborah Drive, Indio, CA 92201
MLS# 219142238DAListed by: EPIQUE REALTY $759,999Active2 beds 2 baths1,925 sq. ft.
51221 Longmeadow Street, Indio, CA 92201
MLS# 219142228DAListed by: EQUITY UNION $489,000Active3 beds 2 baths1,227 sq. ft.
80318 Windsong Way, Indio, CA 92201
MLS# 219142147DAListed by: PREMIER REALTY GROUP INC. $1,900,000Active18 beds 9 baths800 sq. ft.
43965 Towne Street, Indio, CA 92201
MLS# 219142138DAListed by: BPO HOMES $560,000Active2 beds 3 baths2,172 sq. ft.
80571 Hoylake Drive, Indio, CA 92201
MLS# 219142105DAListed by: BERKSHIRE HATHAWAY HOMESERVICES CALIFORNIA PROPERTIES $699,999Active4 beds 3 baths2,430 sq. ft.
44086 Beringer Drive, Indio, CA 92203
MLS# 219141680DAListed by: EXP REALTY OF SOUTHERN CALIFORNIA INC $399,999Pending2 beds 2 baths1,142 sq. ft.
82142 W Solar Court, Indio, CA 92201
MLS# 219142091DAListed by: BERKSHIRE HATHAWAY HOMESERVICES CALIFORNIA PROPERTIES $525,000Active3 beds 2 baths1,835 sq. ft.
82932 Spirit Mountain Drive, Indio, CA 92201
MLS# CL26642207PSListed by: EQUITY UNION $563,990Pending4 beds 3 baths2,259 sq. ft.
49459 Meadowlark Place, Indio, CA 92201
MLS# SW26017432Listed by: D R HORTON AMERICA'S BUILDER $499,900Active2 beds 3 baths1,619 sq. ft.
82098 Travolta Avenue, Indio, CA 92201
MLS# 219142070DAListed by: HOMESMART- Open Sat, 2 to 4pm
 $439,000Active3 beds 2 baths1,262 sq. ft.
82211 Garden, Indio, CA 92201
MLS# PW26017032Listed by: ELEVATE REAL ESTATE AGENCY  $725,000Active4 beds 3 baths1,909 sq. ft.
48593 Anastacia Court, Indio, CA 92201
MLS# 219141997DAListed by: EQUITY UNION $629,900Active3 beds 2 baths1,740 sq. ft.
46579 Via Paraiso, Indio, CA 92201
MLS# 219141970DAListed by: EQUITY UNION $465,000Active2 beds 3 baths1,619 sq. ft.
82237 Travolta Avenue, Indio, CA 92201
MLS# 219141982DAListed by: BENNION DEVILLE HOMES $535,000Active4 beds 2 baths1,580 sq. ft.
80888 Boulder Drive, Indio, CA 92201
MLS# 219141983DAListed by: OZA REALTY INC. $590,000Active3 beds 2 baths1,835 sq. ft.
51088 Sorrel Court, Indio, CA 92201
MLS# 26642183PSListed by: EQUITY UNION $1,600,000Pending4 beds 5 baths3,694 sq. ft.
80977 Rockspur Court, Indio, CA 92201
MLS# 219141954DAListed by: SUMMERS REALTY $765,000Pending4 beds 3 baths1,909 sq. ft.
48539 Anastacia Court, Indio, CA 92201
MLS# 219141935DAListed by: EQUITY UNION $634,900Active2 beds 2 baths1,622 sq. ft.
82445 Murray Canyon Drive, Indio, CA 92201
MLS# 219141877DAListed by: BENNION DEVILLE HOMES $549,999Active3 beds 3 baths2,005 sq. ft.
82810 Odlum Drive, Indio, CA 92201
MLS# 219141861DAListed by: EQUITY UNION- Open Sat, 11am to 4pm
 $580,000Active4 beds 3 baths2,495 sq. ft.
82620 Grant Drive, Indio, CA 92201
MLS# 219141782DAListed by: DESERT SANDS REALTY  $580,000Active3 beds 2 baths1,976 sq. ft.
80803 Hayleigh Court, Indio, CA 92201
MLS# 219141767DAListed by: EQUITY UNION $675,000Active4 beds 2 baths1,724 sq. ft.
83290 Mango, Indio, CA 92201
MLS# CRSR26011775Listed by: CHRISTIE'S INT. R.E SOCAL $649,000Pending4 beds 3 baths1,703 sq. ft.
82560 Delano Drive, Indio, CA 92201
MLS# 219141731DAListed by: RONALD CHRISTOPHER & ASSOC. $369,500Pending3 beds 2 baths1,080 sq. ft.
81341 Francis, Indio, CA 92201
MLS# PW26014054Listed by: ELEVATE REAL ESTATE AGENCY $629,500Active4 beds 3 baths2,476 sq. ft.
81349 Avenida Esmeralda, Indio, CA 92201
MLS# 219141720DAListed by: BERKSHIRE HATHAWAY HOMESERVICES CALIFORNIA PROPERTIES $689,900Active3 beds 3 baths2,346 sq. ft.
80136 Bridgeport Drive, Indio, CA 92201
MLS# 219141697DAListed by: EPIQUE REALTY $1,850,000Active4 beds 4 baths4,056 sq. ft.
49474 Jordan Street, Indio, CA 92201
MLS# 219141668DAListed by: COLDWELL BANKER REALTY $1,650,000Active5 beds 5 baths3,714 sq. ft.
81109 Falling Leaf Court, Indio, CA 92201
MLS# PW26012422Listed by: BHHS CA PROPERTIES $365,000Active2 beds 2 baths1,272 sq. ft.
44355 Royal Lytham Drive, Indio, CA 92201
MLS# 219141597DAListed by: THE LORI BOWERS GROUP
 $429,900Active3 beds 2 baths1,256 sq. ft.
82118 Kenner Avenue, Indio, CA 92201
MLS# DW26011856Listed by: CENTURY 21 ALLSTARS $249,000Pending2 beds 2 baths1,314 sq. ft.
81641 Avenue 48 #108, Indio, CA 92201
MLS# 219141559DAListed by: JESUS MARTINEZ, BROKER $434,900Active4 beds 2 baths1,352 sq. ft.
82180 Verbena Avenue, Indio, CA 92201
MLS# 219141522DAListed by: COLDWELL BANKER REALTY $569,900Active3 beds 3 baths1,995 sq. ft.
82685 Burnette Drive, Indio, CA 92201
MLS# 219141520DAListed by: KELLER WILLIAMS REALTY $649,000Active3 beds 3 baths2,180 sq. ft.
49534 Lewis Road, Indio, CA 92201
MLS# 219141453DAListed by: BERKSHIRE HATHAWAY HOMESERVICES CALIFORNIA PROPERTIES $524,000Active3 beds 2 baths1,750 sq. ft.
49382 Wayne Street, Indio, CA 92201
MLS# 219141160DAListed by: LPT REALTY $369,000Active2 beds 2 baths1,420 sq. ft.
80556 Hoylake Drive, Indio, CA 92201
MLS# 219141386DAListed by: RIVIERA WEST REALTORS, INC. $537,900Pending3 beds 2 baths1,679 sq. ft.
80513 Anacapa Street, Indio, CA 92201
MLS# SW26008712Listed by: LGI REALTY-CALIFORNIA , LLC $529,000Pending2 beds 3 baths1,703 sq. ft.
80178 Golden Horseshoe Drive, Indio, CA 92201
MLS# 219141339DAListed by: HOMESMART $715,000Active5 beds 4 baths1,939 sq. ft.
45640 Cimarron Road, Indio, CA 92201
MLS# 219141293DAListed by: REDFIN CORPORATION $522,850Pending3 beds 2 baths1,533 sq. ft.
48833 Patton Lane, Indio, CA 92201
MLS# 219141255DAListed by: GALLERY MARKETING GROUP, INC. $819,000Pending2 beds 3 baths2,278 sq. ft.
51523 Longmeadow Street, Indio, CA 92201
MLS# 219141243DAListed by: COLDWELL BANKER REALTY $475,000Pending2 beds 2 baths1,507 sq. ft.
82441 Gregory Court, Indio, CA 92201
MLS# 219141218DAListed by: HOMESMART $550,000Pending4 beds 3 baths1,740 sq. ft.
81033 Jamie Way, Indio, CA 92201
MLS# 219141167DAListed by: VYP REAL ESTATE & ASSOCIATES $599,000Pending4 beds 3 baths2,490 sq. ft.
80612 Declaration Avenue, Indio, CA 92201
MLS# 219141153DAListed by: EXP REALTY OF SOUTHERN CALIFORNIA INC $534,900Active2 beds 2 baths1,917 sq. ft.
43548 Kingston Court, Indio, CA 92201
MLS# 219140996DAListed by: COMPASS $384,000Active3 beds 2 baths1,402 sq. ft.
82151 Waring Way, Indio, CA 92201
MLS# HD26005625Listed by: REALTY ONE GROUP EMPIRE $597,190Pending5 beds 3 baths2,311 sq. ft.
83219 Pintail Lane, Indio, CA 92201
MLS# SW26005609Listed by: D R HORTON AMERICA'S BUILDER $599,000Active4 beds 5 baths3,400 sq. ft.
43470 Wild Rose Street, Indio, CA 92201
MLS# 219141061DAListed by: RADIUS AGENT REALTY $647,500Active2 beds 2 baths1,585 sq. ft.
51270 N Two Palms Way, Indio, CA 92201
MLS# 219141018DAListed by: BENNION DEVILLE HOMES $1,775,000Active6 beds 5 baths3,225 sq. ft.
48820 Renewal St, Indio, CA 92201
MLS# SB25278018Listed by: BAYSIDE $440,000Active2 beds 2 baths2,052 sq. ft.
44075 Royal Troon Drive, Indio, CA 92201
MLS# 219140982DAListed by: BENNION DEVILLE HOMES $1,850,000Active5 beds 3 baths2,888 sq. ft.
48846 Stillwater Street, Indio, CA 92201
MLS# 219140918DAListed by: BENNION DEVILLE HOMES $550,000Pending4 beds 3 baths2,406 sq. ft.
82342 Crosby Drive, Indio, CA 92201
MLS# 219140909DAListed by: C 21 COACHELLA VALLEY RE $659,900Active2 beds 2 baths1,914 sq. ft.
82800 Kingsboro Lane, Indio, CA 92201
MLS# 219140899DAListed by: COMPASS $1,275,000Active6 beds 4 baths3,618 sq. ft.
80592 Apricot Lane, Indio, CA 92201
MLS# CL26633853PSListed by: EQUITY UNION $799,900Active4 beds 3 baths1,913 sq. ft.
45350 Palmwood Drive, Indio, CA 92201
MLS# 219140884DAListed by: REGENCY RESIDENTIAL $799,000Active5 beds 3 baths2,293 sq. ft.
82872 Wordsworth Court, Indio, CA 92201
MLS# GD26028732Listed by: EQUITY UNION $2,000,000Active5 beds 5 baths3,308 sq. ft.
48647 Renewal Street, Indio, CA 92201
MLS# 219140829DAListed by: BPO HOMES $410,000Pending3 beds 3 baths1,842 sq. ft.
82707 Scenic Drive, Indio, CA 92201
MLS# 219140834DAListed by: WEICHERT REALTORS-PREFERRED $769,500Active2 beds 3 baths2,039 sq. ft.
50600 Havasu Falls Drive, Indio, CA 92201
MLS# 219140789DAListed by: BENNION DEVILLE HOMES $630,000Active4 beds 3 baths2,495 sq. ft.
49335 Douglas Street, Indio, CA 92201
MLS# 219140748DAListed by: COMPASS $524,900Active3 beds 2 baths1,709 sq. ft.
80601 Declaration Avenue, Indio, CA 92201
MLS# 219142405DAListed by: BENNION DEVILLE HOMES $497,000Active2 beds 2 baths1,917 sq. ft.
80159 Royal Birkdale Drive, Indio, CA 92201
MLS# 219140687DAListed by: RIVIERA WEST REALTORS, INC. $649,999Active5 beds 2 baths1,547 sq. ft.
83347 Mango Walk, Indio, CA 92201
MLS# 219140618DAListed by: COBALT REAL ESTATE $875,000Active3 beds 2 baths2,168 sq. ft.
45729 Meadow Lake Drive, Indio, CA 92201
MLS# 219140619DAListed by: KELLER WILLIAMS LUXURY HOMES $659,900Active3 beds 2 baths1,858 sq. ft.
82676 Burnette Drive, Indio, CA 92201
MLS# 219140568DAListed by: BENNION DEVILLE HOMES $659,900Active3 beds 3 baths2,092 sq. ft.
82756 Burnette Drive, Indio, CA 92201
MLS# 219140564DAListed by: BENNION DEVILLE HOMES $449,900Active4 beds 2 baths1,476 sq. ft.
81300 Avenida Gaviota, Indio, CA 92201
MLS# 219140415DAListed by: DESERT CHOICE REALTY $229,900Active2 beds 1 baths951 sq. ft.
47395 Monroe Street #125, Indio, CA 92201
MLS# IV25282204Listed by: REALHOME SERVICES & SOLUTIONS $455,000Active2 beds 2 baths1,764 sq. ft.
44719 Alexandria Vale, Indio, CA 92201
MLS# 219140471DAListed by: C 21 COACHELLA VALLEY RE $539,000Active2 beds 2 baths1,833 sq. ft.
82809 Odlum Drive, Indio, CA 92201
MLS# 219140464DAListed by: INDIAN SPRINGS REAL ESTATE $565,000Pending4 beds 3 baths2,754 sq. ft.
48841 Andorra, Indio, CA 92201
MLS# CRGD25281560Listed by: IHOME REALTY $599,000Active3 beds 2 baths2,258 sq. ft.
44584 S Heritage Palms Drive, Indio, CA 92201
MLS# 219140429DAListed by: DESERT ELITE PROPERTIES, INC. $990,000Pending4 beds 4 baths2,751 sq. ft.
48864 Pear Street, Indio, CA 92201
MLS# 219140393DAListed by: COMPASS $576,922Pending4 beds 3 baths1,835 sq. ft.
49440 Seagull Place, Indio, CA 92201
MLS# CRSW25279960Listed by: D R HORTON AMERICA'S BUILDER $444,000Active3 beds 3 baths1,856 sq. ft.
43419 Deglet Noor Street, Indio, CA 92201
MLS# 219140225DAListed by: C 21 COACHELLA VALLEY RE $650,190Pending5 beds 3 baths2,537 sq. ft.
83147 Pintail Lane, Indio, CA 92201
MLS# CRSW25278974Listed by: D R HORTON AMERICA'S BUILDER $715,000Active3 beds 2 baths1,590 sq. ft.
48638 Anastacia Court, Indio, CA 92201
MLS# 219140216DAListed by: BETTER HOMES AND GARDENS REAL ESTATE $545,000Active4 beds 3 baths1,887 sq. ft.
81790 Arus Avenue, Indio, CA 92201
MLS# HD25275952Listed by: COLDWELL BANKER HOME SOURCE $435,000Pending4 beds 2 baths1,125 sq. ft.
82168 Crest Avenue, Indio, CA 92201
MLS# 219139866DAListed by: EFREN MENDEZ, BROKER $565,000Active3 beds 2 baths1,300 sq. ft.
82431 Priscilla Court, Indio, CA 92201
MLS# 219139834DAListed by: OZA REALTY INC. $505,000Active3 beds 2 baths1,360 sq. ft.
81253 Coco Palm Drive, Indio, CA 92201
MLS# 219139824DAListed by: DESERT PROPERTIES REALTORS $524,900Active3 beds 3 baths1,884 sq. ft.
80578 Hoylake Drive, Indio, CA 92201
MLS# 219139813DAListed by: RADIUS AGENT REALTY $825,000Active5 beds 4 baths2,738 sq. ft.
82857 Wheatley Court, Indio, CA 92201
MLS# 219139803DAListed by: EQUITY UNION $725,000Active3 beds 2 baths1,900 sq. ft.
51287 Longmeadow Street, Indio, CA 92201
MLS# 219139784DAListed by: COLDWELL BANKER REALTY $574,900Active3 beds 2 baths2,079 sq. ft.
44382 Royal Lytham Drive, Indio, CA 92201
MLS# 219139759DAListed by: KELLER WILLIAMS LUXURY HOMES $619,000Active3 beds 3 baths2,114 sq. ft.
80055 Canyon Club Court, Indio, CA 92201
MLS# 219132918DAListed by: BERKSHIRE HATHAWAY HOMESERVICES CALIFORNIA PROPERTIES $648,613Pending4 beds 4 baths2,480 sq. ft.
83239 Pintail Lane, Indio, CA 92201
MLS# CRSW25271434Listed by: D R HORTON AMERICA'S BUILDER $650,000Active3 beds 3 baths2,044 sq. ft.
49647 Lewis Road, Indio, CA 92201
MLS# 219139652DAListed by: EQUITY UNION $399,000Active2 beds 2 baths1,885 sq. ft.
44110 Royal Troon Drive, Indio, CA 92201
MLS# 219139630DAListed by: CALIFORNIA LIFESTYLE REALTY $695,000Active2 beds 2 baths1,641 sq. ft.
82425 Murray Canyon Drive, Indio, CA 92201
MLS# CL25623843Listed by: COLDWELL BANKER REALTY $649,000Active4 beds 3 baths2,482 sq. ft.
81059 Aurora Avenue, Indio, CA 92201
MLS# 219139581DAListed by: BENNION DEVILLE HOMES $1,700,000Active3 beds 4 baths2,931 sq. ft.
80913 Gentle Breeze Drive, Indio, CA 92201
MLS# 219139572DAListed by: BPO HOMES $581,490Pending4 beds 3 baths2,259 sq. ft.
83218 Pintail Lane, Indio, CA 92201
MLS# SW25270982Listed by: D R HORTON AMERICA'S BUILDER $665,000Active4 beds 3 baths1,769 sq. ft.
47675 Peony Place, Indio, CA 92201
MLS# 219139505DAListed by: PREMIER REALTY GROUP INC. $425,000Pending2 beds 2 baths1,598 sq. ft.
80538 Knightswood Road, Indio, CA 92201
MLS# 219139483DAListed by: BERKSHIRE HATHAWAY HOMESERVICES CALIFORNIA PROPERTIES $699,000Active2 beds 2 baths1,929 sq. ft.
82660 Remington, Indio, CA 92201
MLS# IG25268624Listed by: KELLER WILLIAMS-LA QUINTA $550,000Active3 beds 2 baths1,424 sq. ft.
43700 Brahea Court, Indio, CA 92201
MLS# CRCV25268146Listed by: VISTA PACIFIC REALTY- New
 $749,999Active5 beds 2 baths2,502 sq. ft.
80746 Diamondback Trail, Indio, CA 92201
MLS# 219143623DAListed by: HOMESMART  $589,000Active2 beds 2 baths1,928 sq. ft.
82755 Temescal Canyon Drive, Indio, CA 92201
MLS# 219139338DAListed by: COLDWELL BANKER REALTY $449,900Active3 beds 2 baths1,600 sq. ft.
44737 Swingle Avenue, Indio, CA 92201
MLS# 219140860PSListed by: BENNION DEVILLE HOMES $595,000Active6 beds 3 baths1,274 sq. ft.
81038 Helen Avenue, Indio, CA 92201
MLS# 219139286DAListed by: DARRYL JOEL FREED, BROKER $549,000Active3 beds 2 baths1,950 sq. ft.
81452 Helen Avenue, Indio, CA 92201
MLS# CL25623067Listed by: REAL BROKER $575,000Active3 beds 3 baths1,683 sq. ft.
49728 Pacino Street, Indio, CA 92201
MLS# 219139236DAListed by: THUNDERBIRD REALTY $1,550,000Active4 beds 4 baths3,468 sq. ft.
49578 Colorado Street, Indio, CA 92201
MLS# 219139217DAListed by: JEFFERY FRANKLIN FIDLER $674,000Active4 beds 3 baths2,212 sq. ft.
49267 Biery Street, Indio, CA 92201
MLS# CROC25265025Listed by: SEVEN GABLES REAL ESTATE $430,000Active3 beds 2 baths2,079 sq. ft.
80296 Royal Dornoch Drive, Indio, CA 92201
MLS# 219139052DAListed by: RADIUS AGENT REALTY $574,900Pending4 beds 2 baths1,934 sq. ft.
42486 Aruba Court, Indio, CA 92201
MLS# CRSW25263297Listed by: LGI REALTY-CALIFORNIA , LLC $385,000Active3 beds 2 baths1,553 sq. ft.
80242 Royal Dornoch Drive, Indio, CA 92201
MLS# 219138999DAListed by: RIVIERA WEST REALTORS, INC. $639,999Active3 beds 3 baths1,914 sq. ft.
82847 Millay Court, Indio, CA 92201
MLS# CRSW25262937Listed by: EXP REALTY OF SOUTHERN CALIFORNIA, INC. $499,900Active3 beds 2 baths1,287 sq. ft.
42494 Aruba Court, Indio, CA 92201
MLS# CRSW25263172Listed by: LGI REALTY-CALIFORNIA , LLC $461,700Pending4 beds 3 baths1,246 sq. ft.
83685 Denver Avenue, Indio, CA 92201
MLS# IV25259430Listed by: LIVINGSTONE REALTY GROUP $649,000Active2 beds 2 baths2,061 sq. ft.
44397 Royal Lytham Drive, Indio, CA 92201
MLS# 219138827DAListed by: ENGEL & VOLKERS PALM DESERT $600,000Active4 beds 2 baths1,709 sq. ft.
80669 Freedom Avenue, Indio, CA 92201
MLS# 219138725DAListed by: PREMIER REALTY GROUP INC. $799,000Active5 beds 3 baths2,366 sq. ft.
82156 Oleander Avenue, Indio, CA 92201
MLS# 219138698DAListed by: COMPASS $639,999Active4 beds 2 baths1,677 sq. ft.
80741 Desert Spur Drive, Indio, CA 92201
MLS# 219138621DAListed by: EQUITY UNION $637,700Active2 beds 2 baths1,623 sq. ft.
51216 Longmeadow Street, Indio, CA 92201
MLS# 219138613DAListed by: COMPASS $315,000Active2 beds 2 baths1,290 sq. ft.
81641 Avenue 48 #20, Indio, CA 92201
MLS# 219138555DAListed by: HOMESMART $715,000Pending4 beds 3 baths2,108 sq. ft.
48580 Gibraltar Street, Indio, CA 92201
MLS# 219138476DAListed by: VACAYSTAY REAL ESTATE $1,350,000Active4 beds 4 baths3,150 sq. ft.
49252 Colorado Street, Indio, CA 92201
MLS# 219138384DAListed by: REDFIN CORPORATION $609,000Active2 beds 3 baths1,847 sq. ft.
50535 Harps Canyon, Indio, CA 92201
MLS# DW25252670Listed by: FIRST TEAM REAL ESTATE $799,950Pending4 beds 3 baths2,391 sq. ft.
80435 Paseo De Tiempo, Indio, CA 92201
MLS# IV25254927Listed by: NATIONAL REALTY GROUP $769,000Active4 beds 4 baths2,264 sq. ft.
49526 Douglas, Indio, CA 92201
MLS# OC25249506Listed by: ALTA REALTY GROUP CA, INC $605,000Active4 beds 3 baths2,617 sq. ft.
82420 Astaire Avenue, Indio, CA 92201
MLS# 219138155DAListed by: COMPASS $487,000Active2 beds 2 baths1,507 sq. ft.
82537 Delano Drive, Indio, CA 92201
MLS# 219138073DAListed by: HOMESMART $479,000Active2 beds 2 baths2,061 sq. ft.
80729 Braemar Court, Indio, CA 92201
MLS# 219138069DAListed by: EQUITY UNION $399,000Active2 beds 2 baths1,553 sq. ft.
80187 Royal Birkdale Drive, Indio, CA 92201
MLS# 219137998DAListed by: BERKSHIRE HATHAWAY HOMESERVICES CALIFORNIA PROPERTIES $599,000Active2 beds 2 baths1,885 sq. ft.
43328 Heritage Palms Drive N, Indio, CA 92201
MLS# 219137999DAListed by: BERKSHIRE HATHAWAY HOMESERVICES CALIFORNIA PROPERTIES $739,000Active2 beds 3 baths2,172 sq. ft.
44327 Royal Lytham Drive, Indio, CA 92201
MLS# 219137969DAListed by: RIVIERA WEST REALTORS, INC. $529,000Active3 beds 3 baths2,495 sq. ft.
49643 Douglas Street, Indio, CA 92201
MLS# CRSW25249475Listed by: REALTY ONE GROUP PACIFIC $465,000Active2 beds 3 baths1,619 sq. ft.
82087 Hopkins Drive, Indio, CA 92201
MLS# 219137935DAListed by: HOMESMART $449,900Pending4 beds 2 baths1,433 sq. ft.
80878 Amherst Avenue, Indio, CA 92201
MLS# 219137350DAListed by: PRIORITY REAL ESTATE & LENDING $668,000Active3 beds 3 baths2,504 sq. ft.
80607 Prestwick Place, Indio, CA 92201
MLS# 219137891DAListed by: RIVIERA WEST REALTORS, INC. $697,777Active3 beds 3 baths1,898 sq. ft.
45320 Coeur Dalene Drive, Indio, CA 92201
MLS# 219137688DAListed by: THE REAL ESTATE COMPANY INC $215,000Pending3 beds 2 baths1,276 sq. ft.
47254 Diane Street, Indio, CA 92201
MLS# WS25247737Listed by: EXCELLENCE REAL ESTATE $764,900Active3 beds 2 baths1,847 sq. ft.
82370 Crane Drive, Indio, CA 92201
MLS# CRTR25247406Listed by: COLDWELL BANKER TRI-COUNTIES R $649,000Active3 beds 2 baths2,249 sq. ft.
43393 Saint Andrews Drive, Indio, CA 92201
MLS# 219137647DAListed by: RIVIERA WEST REALTORS, INC. $1,675,000Active4 beds 3 baths2,667 sq. ft.
48713 Spring Rain Court, Indio, CA 92201
MLS# 219137642DAListed by: VACAYSTAY REAL ESTATE $459,990Active-- beds 1 baths117 sq. ft.
80501 Avenue 48, Indio, CA 92201
MLS# CRSW25244382Listed by: ABUNDANCE REAL ESTATE $1,850,000Active5 beds 3 baths2,931 sq. ft.
48844 Meandering Cloud Street, Indio, CA 92201
MLS# 219137382DAListed by: BENNION DEVILLE HOMES $395,000Active3 beds 2 baths1,402 sq. ft.
48879 Gosden, Indio, CA 92201
MLS# IG25244115Listed by: COLDWELL BANKER KIVETT-TEETERS $599,000Active2 beds 2 baths1,950 sq. ft.
43347 N Heritage Palms Drive, Indio, CA 92201
MLS# 219137308DAListed by: RIVIERA WEST REALTORS, INC. $469,900Active3 beds 2 baths1,521 sq. ft.
82774 Matthau Drive, Indio, CA 92201
MLS# 219137276PSListed by: GARBER FINANCIAL $475,000Active2 beds 2 baths1,294 sq. ft.
82663 Rosewood Drive, Indio, CA 92201
MLS# CRIG25240765Listed by: LPT REALTY, INC $1,050,000Active2 beds 1 baths900 sq. ft.
81514 Avenue 50, Indio, CA 92201
MLS# 219140367DAListed by: OZA REALTY INC. $599,900Active4 beds 3 baths2,514 sq. ft.
82887 Wordsworth Court, Indio, CA 92201
MLS# 219142316DAListed by: ROSENTHAL & ASSOCIATES $495,000Active2 beds 2 baths1,342 sq. ft.
51725 Ponderosa Drive, Indio, CA 92201
MLS# 219136935DAListed by: BENNION DEVILLE HOMES $419,000Active2 beds 2 baths2,052 sq. ft.
80157 Royal Birkdale Drive, Indio, CA 92201
MLS# 219136826DAListed by: RIVIERA WEST REALTORS, INC. $475,000Active2 beds 2 baths2,061 sq. ft.
80190 Royal Birkdale Drive, Indio, CA 92201
MLS# 219136829DAListed by: RIVIERA WEST REALTORS, INC. $349,000Active2 beds 2 baths1,553 sq. ft.
43774 Royal Saint George Drive, Indio, CA 92201
MLS# 219136824DAListed by: RIVIERA WEST REALTORS, INC. $454,000Active2 beds 2 baths1,600 sq. ft.
44390 Royal Lytham Drive, Indio, CA 92201
MLS# 219136814DAListed by: BERKSHIRE HATHAWAY HOMESERVICES CALIFORNIA PROPERTIES $872,000Active3 beds 3 baths2,367 sq. ft.
82830 Logan Creek Drive, Indio, CA 92201
MLS# 219136812DAListed by: PLATINUM STAR PROPERTIES $349,000Active2 beds 2 baths924 sq. ft.
47800 Madison Street #79, Indio, CA 92201
MLS# 219141261DAListed by: EXP REALTY OF CALIFORNIA, INC. $669,000Active3 beds 4 baths2,088 sq. ft.
49475 Redford Way, Indio, CA 92201
MLS# 219136719PSListed by: GARBER FINANCIAL $618,000Active3 beds 2 baths2,079 sq. ft.
80226 Royal Birkdale Drive, Indio, CA 92201
MLS# 219136706DAListed by: ENGEL & VOLKERS PALM DESERT $770,000Active5 beds 3 baths1,750 sq. ft.
47705 Tulip, Indio, CA 92201
MLS# OC25234364Listed by: ALTA REALTY GROUP CA, INC $795,000Active3 beds 3 baths2,367 sq. ft.
82650 Walker Canyon Drive, Indio, CA 92201
MLS# 219136681DAListed by: BENNION DEVILLE HOMES $535,000Active2 beds 2 baths1,707 sq. ft.
44129 Royal Troon Drive, Indio, CA 92201
MLS# 219136299DAListed by: LUXURY RESORT PROPERTIES $584,000Active3 beds 2 baths1,772 sq. ft.
81258 Avenida Esmeralda, Indio, CA 92201
MLS# PW25233787Listed by: RE/MAX NEW DIMENSION $329,000Active2 beds 2 baths1,082 sq. ft.
49108 Wayne Street, Indio, CA 92201
MLS# IG25230748Listed by: PONCE & PONCE REALTY, INC $3,000,000Active4 beds 3 baths2,121 sq. ft.
80886 Avenue 50, Indio, CA 92201
MLS# 219136366DAListed by: KELLER WILLIAMS LUXURY HOMES $530,000Pending4 beds 2 baths2,074 sq. ft.
44482 Avenida Suarez, Indio, CA 92201
MLS# 250045090Listed by: KAM FINANCIAL REALTY $650,690Pending5 beds 3 baths2,537 sq. ft.
49500 Seagull Place, Indio, CA 92201
MLS# CRSW25230860Listed by: D R HORTON AMERICA'S BUILDER $479,000Active3 beds 3 baths2,122 sq. ft.
80222 Spanish Bay Drive, Indio, CA 92201
MLS# 219136157DAListed by: COLDWELL BANKER REALTY $899,000Active2 beds 3 baths2,451 sq. ft.
82595 Ladder Canyon Drive, Indio, CA 92201
MLS# 219136116DAListed by: COMPASS $579,900Active4 beds 4 baths2,264 sq. ft.
49355 Biery Street, Indio, CA 92201
MLS# 219136027DAListed by: COLDWELL BANKER REALTY $4,420,000Active6 beds 7 baths5,200 sq. ft.
80220 Avenue 50, Indio, CA 92201
MLS# CRJT25114859Listed by: REALTY TRUST $584,732Pending4 beds 3 baths1,835 sq. ft.
49480 Seagull Place, Indio, CA 92201
MLS# CRSW25226444Listed by: D R HORTON AMERICA'S BUILDER $725,000Active2 beds 2 baths1,622 sq. ft.
50810 Bee Canyon Drive, Indio, CA 92201
MLS# 219135881DAListed by: COMPASS $626,900Active4 beds 3 baths2,488 sq. ft.
80548 Anacapa Drive, Indio, CA 92201
MLS# CRSW25223550Listed by: LGI REALTY-CALIFORNIA , LLC $646,490Pending5 beds 3 baths2,537 sq. ft.
49460 Seagull Place, Indio, CA 92201
MLS# SW25223989Listed by: D R HORTON AMERICA'S BUILDER $505,000Active2 beds 2 baths1,448 sq. ft.
50380 Timber Creek Way, Indio, CA 92201
MLS# 219135767PSListed by: COMPASS $564,900Active4 beds 2 baths1,934 sq. ft.
42495 Aruba Court, Indio, CA 92201
MLS# CRSW25222795Listed by: LGI REALTY-CALIFORNIA , LLC $499,999Active3 beds 2 baths1,800 sq. ft.
49528 Pacino Street, Indio, CA 92201
MLS# 219135699DAListed by: DESERT ELITE PROPERTIES, INC. $450,000Active4 beds 2 baths1,826 sq. ft.
81901 Victoria Street, Indio, CA 92201
MLS# CRIG25222128Listed by: BERKSHIRE HATHAWAY HOMESERVICES CALIFORNIA REALTY $555,000Active2 beds 2 baths1,507 sq. ft.
82570 Delano Drive, Indio, CA 92201
MLS# 219135636DAListed by: THE LOCKLEAR GROUP $597,900Active4 beds 3 baths2,204 sq. ft.
42476 Aruba Court, Indio, CA 92201
MLS# CRSW25219616Listed by: LGI REALTY-CALIFORNIA , LLC $619,900Pending3 beds 2 baths1,679 sq. ft.
42477 Aruba Court, Indio, CA 92201
MLS# CRSW25217660Listed by: LGI REALTY-CALIFORNIA , LLC $2,200,000Active5 beds 6 baths5,069 sq. ft.
49184 Tidewater Drive, Indio, CA 92201
MLS# CL25587255PSListed by: KELLER WILLIAMS LUXURY HOMES $399,000Active2 beds 2 baths1,382 sq. ft.
44648 S Heritage Palms Drive, Indio, CA 92201
MLS# 219135199DAListed by: RIVIERA WEST REALTORS, INC. $1,149,000Active4 beds 3 baths3,618 sq. ft.
80579 Plum Lane, Indio, CA 92201
MLS# 219135149DAListed by: EQUITY UNION $699,000Active2 beds 2 baths2,061 sq. ft.
80200 Royal Birkdale Drive, Indio, CA 92201
MLS# 219139086DAListed by: BENNION DEVILLE HOMES $779,000Pending3 beds 3 baths2,141 sq. ft.
82375 Crane Drive, Indio, CA 92201
MLS# 219134895DAListed by: BENNION DEVILLE HOMES- New
 $559,000Active2 beds 2 baths1,707 sq. ft.
80474 Muirfield Drive, Indio, CA 92201
MLS# 219143659DAListed by: COMPASS  $1,149,000Active5 beds 4 baths3,150 sq. ft.
49587 Gila River Street, Indio, CA 92201
MLS# 25586529Listed by: NEW VISION R.E. & INVESTMENTS $575,000Active5 beds 2 baths2,502 sq. ft.
80722 Diamondback Trail, Indio, CA 92201
MLS# 219134775DAListed by: HOMESMART- Open Sun, 1am to 3pm
 $619,000Active3 beds 2 baths2,079 sq. ft.
80576 Hoylake, Indio, CA 92201
MLS# OC26020478Listed by: REALTY ONE GROUP WEST  $655,000Active3 beds 2 baths2,111 sq. ft.
82223 Vandenberg Drive, Indio, CA 92201
MLS# 219139492DAListed by: EXP REALTY OF SOUTHERN CALIFORNIA INC $601,900Pending3 beds 2 baths1,679 sq. ft.
42489 Aruba Court, Indio, CA 92201
MLS# CRSW25191569Listed by: LGI REALTY-CALIFORNIA , LLC $1,495,000Active4 beds 4 baths3,468 sq. ft.
49101 Escalante Street, Indio, CA 92201
MLS# CL25580671PSListed by: DESERT LIFESTYLE PROPERTIES- New
 $520,000Active4 beds 3 baths2,377 sq. ft.
82151 Hanson Drive, Indio, CA 92201
MLS# 219143699DAListed by: CALIFORNIA LIFESTYLE REALTY  $698,000Pending2 beds 3 baths2,245 sq. ft.
82712 Woodcreek Court, Indio, CA 92201
MLS# 219133996DAListed by: BENNION DEVILLE HOMES $449,000Active2 beds 2 baths1,468 sq. ft.
80418 Portobello Drive, Indio, CA 92201
MLS# 219140389DAListed by: ENGEL & VOLKERS PALM DESERT $725,000Active4 beds 3 baths1,972 sq. ft.
49464 Sherman Drive, Indio, CA 92201
MLS# 219140648DAListed by: VALLEY PEAK REALTY $515,000Pending3 beds 2 baths2,200 sq. ft.
43784 Royal Saint George Drive, Indio, CA 92201
MLS# 219133516DAListed by: BERKSHIRE HATHAWAY HOMESERVICES CALIFORNIA PROPERTIES $1,800,000Active6 beds 5 baths3,610 sq. ft.
48685 Sojourn Street, Indio, CA 92201
MLS# 219133501DAListed by: BPO HOMES $682,206Pending4 beds 4 baths2,480 sq. ft.
83227 Verio Way, Indio, CA 92201
MLS# CRSW25170762Listed by: D R HORTON AMERICA'S BUILDER $599,900Active4 beds 3 baths2,490 sq. ft.
80675 Independence Avenue, Indio, CA 92201
MLS# OC25164195Listed by: KAI ANDERSEN, BROKER $630,000Active4 beds 3 baths2,166 sq. ft.
48305 Pic Way, Indio, CA 92201
MLS# 219141576DAListed by: ALLISON JAMES ESTATES & HOMES $498,200Active2 beds 2 baths1,533 sq. ft.
82755 Ryan Way Way, Indio, CA 92201
MLS# 219132652DAListed by: GALLERY MARKETING GROUP, INC. $1,650,000Active6 beds 4 baths4,052 sq. ft.
50140 Vista Montana Court, Indio, CA 92201
MLS# SR25151626Listed by: EXP REALTY OF CALIFORNIA INC. $295,000Active3 beds 2 baths1,528 sq. ft.
46581 Denslow Street, Indio, CA 92201
MLS# 219131917DAListed by: BERKSHIRE HATHAWAY HOMESERVICES CALIFORNIA PROPERTIES $749,000Active4 beds 3 baths2,408 sq. ft.
47645 Calle Diamante, Indio, CA 92201
MLS# CRTR25140954Listed by: KEYSTONE REALTY GROUP $626,900Active4 beds 2 baths1,934 sq. ft.
80523 Anacapa Drive, Indio, CA 92201
MLS# CRSW25127136Listed by: LGI REALTY-CALIFORNIA , LLC $601,900Pending3 beds 2 baths1,679 sq. ft.
80525 Anacapa Drive, Indio, CA 92201
MLS# CRSW25127491Listed by: LGI REALTY-CALIFORNIA , LLC $604,900Active3 beds 2 baths1,679 sq. ft.
80533 Anacapa Drive, Indio, CA 92201
MLS# CRSW25127169Listed by: LGI REALTY-CALIFORNIA , LLC $3,900,000Active6 beds 7 baths5,036 sq. ft.
82301 Avenue 50, Indio, CA 92201
MLS# CRIG25124239Listed by: KELLER WILLIAMS-LA QUINTA $650,000Active3 beds 2 baths1,720 sq. ft.
80804 Sunspring Court, Indio, CA 92201
MLS# CL25615721PSListed by: BEVERLY HILLS FINE HOMES $592,900Active4 beds 3 baths2,204 sq. ft.
80535 Anacapa Drive, Indio, CA 92201
MLS# CRSW25114937Listed by: LGI REALTY-CALIFORNIA , LLC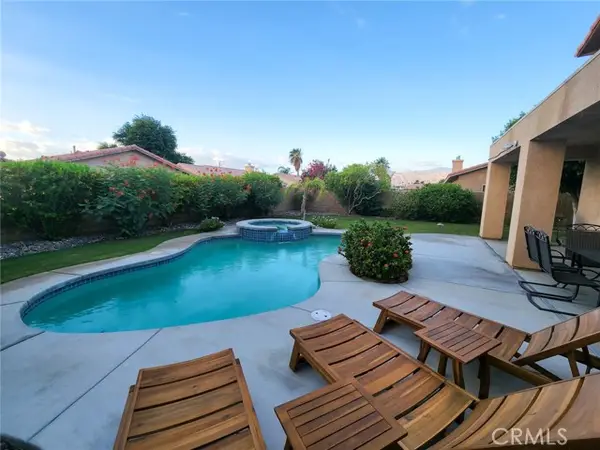 $659,900Active5 beds 4 baths2,554 sq. ft.
43620 Brahea Court, Indio, CA 92201
MLS# CRCV25112147Listed by: ALL ENCOMPASS REALTY $539,000Active3 beds 3 baths1,947 sq. ft.
82734 Redford Way, Indio, CA 92201
MLS# 219135640DAListed by: HOMESMART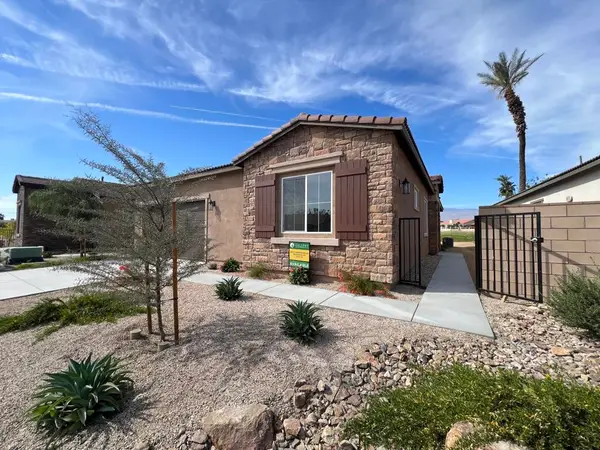 $607,970Active3 beds 2 baths2,008 sq. ft.
48243 Barrymore Street, Indio, CA 92201
MLS# 219141232DAListed by: GALLERY MARKETING GROUP, INC.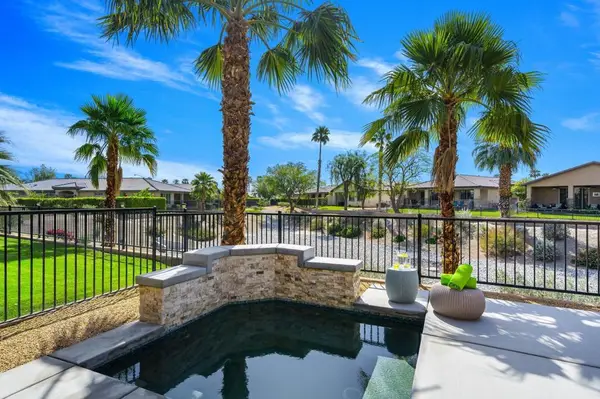 $685,000Active3 beds 3 baths2,231 sq. ft.
82675 Burnette Drive, Indio, CA 92201
MLS# 219127716DAListed by: EQUITY UNION $729,000Active3 beds 3 baths2,504 sq. ft.
80610 Prestwick Place, Indio, CA 92201
MLS# 219133230DAListed by: RIVIERA WEST REALTORS, INC.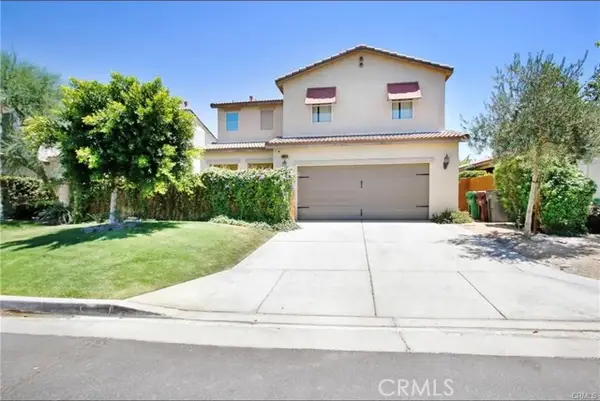 $735,000Active5 beds 4 baths2,389 sq. ft.
48620 Anastacia Court, Indio, CA 92201
MLS# CRSR25060313Listed by: MAXWELL REALTY INC $835,000Active5 beds 3 baths2,013 sq. ft.
80787 Hayleigh Court, Indio, CA 92201
MLS# CRSR25060308Listed by: MAXWELL REALTY INC $599,000Active3 beds 2 baths1,885 sq. ft.
49913 Maclaine Street, Indio, CA 92201
MLS# 219141712PSListed by: VINCENT JAMES LTD. $365,000Active3 beds 2 baths1,080 sq. ft.
47267 Blue Jay Street, Indio, CA 92201
MLS# CRSB25056393Listed by: ADVANCED REALTY SOLUTIONS $479,999Active2 beds 3 baths1,703 sq. ft.
45846 Big Canyon Street, Indio, CA 92201
MLS# CRSR25049350Listed by: THEAGENTS $699,000Active3 beds 3 baths2,231 sq. ft.
49337 Nicholson Court, Indio, CA 92201
MLS# 219139284DAListed by: BPO HOMES $629,000Active3 beds 2 baths2,180 sq. ft.
48638 Barrymore Street, Indio, CA 92201
MLS# 219134230DAListed by: HOMESMART $425,000Active4 beds 2 baths1,333 sq. ft.
84057 Manila Avenue, Indio, CA 92201
MLS# CRIG25036962Listed by: J&C REAL ESTATE $508,900Active3 beds 2 baths1,287 sq. ft.
42502 Isla Court, Indio, CA 92201
MLS# CRSW25030054Listed by: LGI REALTY-CALIFORNIA , LLC
Local realty services provided by:CENTURY 21 Adams & Barnes, CENTURY 21 Affiliated, CENTURY 21 Wildwood Properties, Inc.
The information being provided by California Regional MLS (Southern California) is for the consumer's personal, non-commercial use and may not be used for any purpose other than to identify prospective properties consumer may be interested in purchasing. Any information relating to real estate for sale referenced on this web site comes from the Internet Data Exchange (IDX) program of the California Regional MLS (Southern California). CENTURY 21 Adams & Barnes is not a Multiple Listing Service (MLS), nor does it offer MLS access. This website is a service of CENTURY 21 Adams & Barnes, a broker participant of California Regional MLS (Southern California). This web site may reference real estate listing(s) held by a brokerage firm other than the broker and/or agent who owns this web site.
The accuracy of all information, regardless of source, including but not limited to open house information, square footages and lot sizes, is deemed reliable but not guaranteed and should be personally verified through personal inspection by and/or with the appropriate professionals. The data contained herein is copyrighted by California Regional MLS (Southern California) and is protected by all applicable copyright laws. Any unauthorized dissemination of this information is in violation of copyright laws and is strictly prohibited.
Copyright 2021 California Regional MLS (Southern California). All rights reserved.
This information is deemed reliable but not guaranteed. You should rely on this information only to decide whether or not to further investigate a particular property. BEFORE MAKING ANY OTHER DECISION, YOU SHOULD PERSONALLY INVESTIGATE THE FACTS (e.g. square footage and lot size) with the assistance of an appropriate professional. You may use this information only to identify properties you may be interested in investigating further. All uses except for personal, non-commercial use in accordance with the foregoing purpose are prohibited. Redistribution or copying of this information, any photographs or video tours is strictly prohibited. This information is derived from the Internet Data Exchange (IDX) service provided by San Diego MLS®. Displayed property listings may be held by a brokerage firm other than the broker and/or agent responsible for this display. The information and any photographs and video tours and the compilation from which they are derived is protected by copyright. Compilation © 2020 San Diego MLS®, Inc.
Popular searches near 92201
Popular neighborhoods near 92201
- Andalusia, La Quinta homes for sale
- Bermuda Dunes, Indio homes for sale
- Desert Breezes, Palm Desert homes for sale
- Desert Club, La Quinta homes for sale
- Griffin Ranch, La Quinta homes for sale
- Indian Ridge Country Club, Palm Desert homes for sale
- La Quinta, La Quinta homes for sale
- La Quinta Cove, La Quinta homes for sale
- Mountain View Country Club, La Quinta homes for sale
- Palm Desert Resort, Palm Desert homes for sale
- PGA West, La Quinta homes for sale
- Rancho la Quinta, La Quinta homes for sale
- Sun City Shadow Hills, Indio homes for sale
- Talavera, Indio homes for sale
- The Lakes, Palm Desert homes for sale
- The Reserve, Indian Wells homes for sale
- The Vintage, Indian Wells homes for sale
- Thermal, Thermal homes for sale
- Vista Santa Rosa, Thermal homes for sale
- Woodhaven Country Club, Palm Desert homes for sale
Protect your home and budget from life's surprises with an Assurant Home Warranty, backed by a partner that supports you through every step of homeownership. Explore Plans.
©2026 Century 21 Real Estate LLC. All rights reserved. CENTURY 21®, the CENTURY 21 Logo and C21® are service marks owned by Century 21 Real Estate LLC. Century 21 Real Estate LLC fully supports the principles of the Fair Housing Act and the Equal Opportunity Act. Each office is independently owned and operated. Listing information is deemed reliable but not guaranteed accurate.