- Angelus Mesa, Los Angeles homes for sale
- Athens, Los Angeles homes for sale
- Baldwin Hills, Los Angeles homes for sale
- Baldwin Village, Los Angeles homes for sale
- Blanco, Culver City homes for sale
- Broadway - Manchester, Los Angeles homes for sale
- Chesterfield Square, Los Angeles homes for sale
- Fox Hills, Culver City homes for sale
- Gramercy Park, Los Angeles homes for sale
- Harvard Park, Los Angeles homes for sale
- Hyde Park, Los Angeles homes for sale
- Leimert Park, Los Angeles homes for sale
- Manchester Square, Los Angeles homes for sale
- Playa Vista, Playa Vista homes for sale
- Vermont Knolls, Los Angeles homes for sale
- Vermont-Slauson, Los Angeles homes for sale
- Vermont Vista, Los Angeles homes for sale
- View Park-Windsor Hills, Los Angeles homes for sale
- Westchester, Los Angeles homes for sale
- Westmont, Los Angeles homes for sale
Inglewood, CA - homes for sale
10 of 10 results displayed
- New
 $549,000Active2 beds 3 baths1,086 sq. ft.
822 Victor Avenue #20, Inglewood, CA 90302
MLS# 26656965Listed by: PARDEE PROPERTIES - New
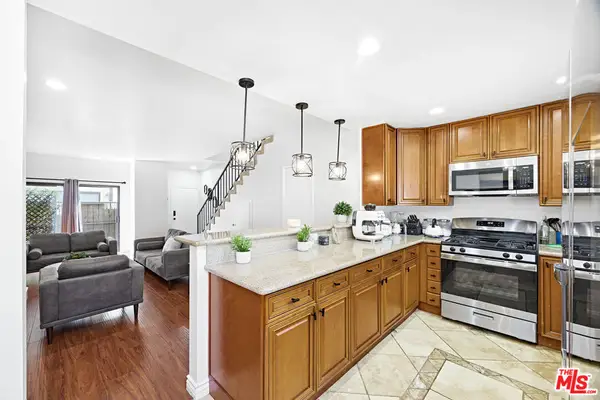
 $670,000Active3 beds 2 baths1,595 sq. ft.
3500 W Manchester #472, Inglewood, CA 90305
MLS# SB26045281Listed by: CAMBREE REALTY ADVISORS 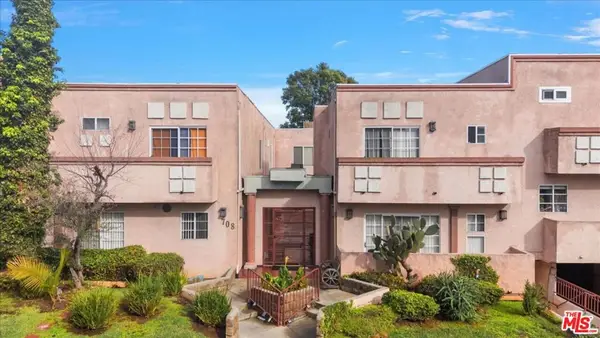 $445,000Active2 beds 2 baths914 sq. ft.
708 N Eucalyptus Avenue #104, Inglewood, CA 90302
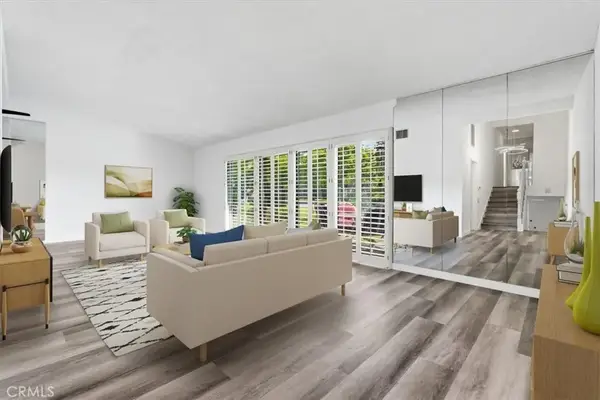
MLS# 26653617Listed by: COMPASS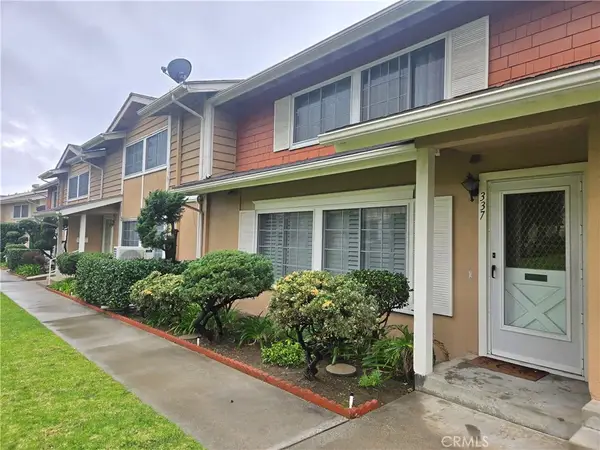 $599,000Active2 beds 3 baths1,532 sq. ft.
3500 W Manchester #337, Inglewood, CA 90305
MLS# CV26038587Listed by: FIRST CHOICE REALTY SOLUTIONS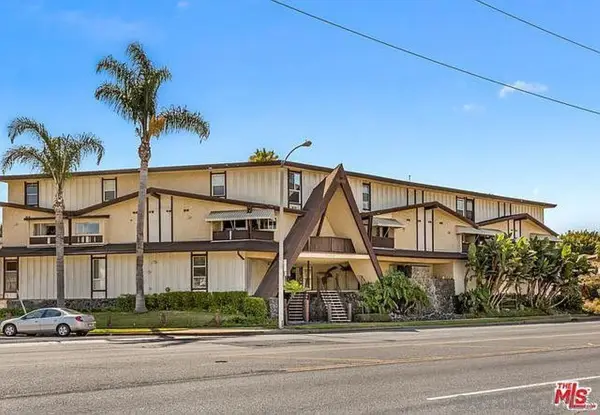 $399,000Active2 beds 2 baths1,084 sq. ft.
7000 S La Cienega Blvd #29, Inglewood, CA 90302
MLS# 2601196SDListed by: LINK BROKERAGES, INC.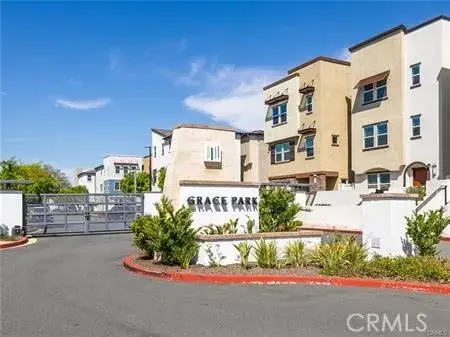 $1,278,000Active4 beds 4 baths2,335 sq. ft.
533 Daniel Freeman Circle, Inglewood, CA 90301
MLS# SB26009381Listed by: KAPRI TIFFANY YOUNGER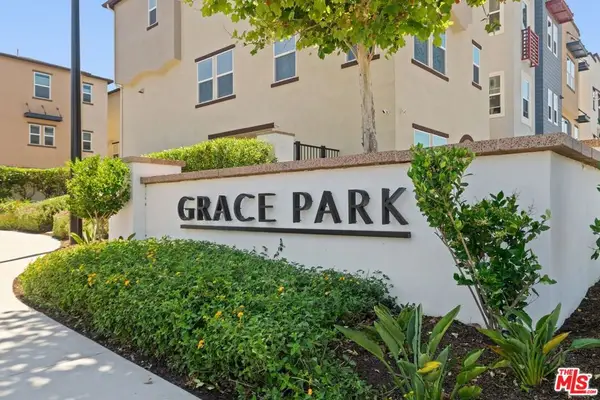 $1,249,000Active4 beds 4 baths2,572 sq. ft.
551 Daniel Freeman Circle, Inglewood, CA 90301
MLS# 26636731Listed by: LPT REALTY, INC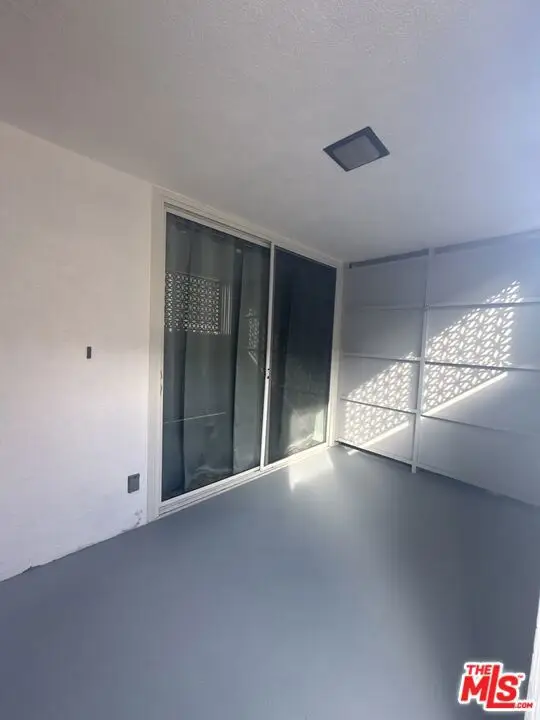 $475,000Active2 beds 2 baths921 sq. ft.
141 W Hillcrest Boulevard #2, Inglewood, CA 90301
MLS# CL25605603Listed by: THE CONEY GROUP
 $1,050,000Active7 beds 3 baths2,955 sq. ft.
10311 S Grevillea Avenue, Inglewood, CA 90304
MLS# DW25189493Listed by: CENTURY 21 LOTUS $499,000Active1 beds 2 baths868 sq. ft.
558 Evergreen Street #18, Inglewood, CA 90302
MLS# 25566185Listed by: ALICIA LYNETTE TAYLOR
Local realty services provided by:CENTURY 21 Synergia Realty, CENTURY 21 Affiliated, CENTURY 21 Sierra Properties
The information being provided by California Regional MLS (Southern California) is for the consumer's personal, non-commercial use and may not be used for any purpose other than to identify prospective properties consumer may be interested in purchasing. Any information relating to real estate for sale referenced on this web site comes from the Internet Data Exchange (IDX) program of the California Regional MLS (Southern California). CENTURY 21 Synergia Realty is not a Multiple Listing Service (MLS), nor does it offer MLS access. This website is a service of CENTURY 21 Synergia Realty, a broker participant of California Regional MLS (Southern California). This web site may reference real estate listing(s) held by a brokerage firm other than the broker and/or agent who owns this web site.
The accuracy of all information, regardless of source, including but not limited to open house information, square footages and lot sizes, is deemed reliable but not guaranteed and should be personally verified through personal inspection by and/or with the appropriate professionals. The data contained herein is copyrighted by California Regional MLS (Southern California) and is protected by all applicable copyright laws. Any unauthorized dissemination of this information is in violation of copyright laws and is strictly prohibited.
Copyright 2021 California Regional MLS (Southern California). All rights reserved.
This information is deemed reliable but not guaranteed. You should rely on this information only to decide whether or not to further investigate a particular property. BEFORE MAKING ANY OTHER DECISION, YOU SHOULD PERSONALLY INVESTIGATE THE FACTS (e.g. square footage and lot size) with the assistance of an appropriate professional. You may use this information only to identify properties you may be interested in investigating further. All uses except for personal, non-commercial use in accordance with the foregoing purpose are prohibited. Redistribution or copying of this information, any photographs or video tours is strictly prohibited. This information is derived from the Internet Data Exchange (IDX) service provided by San Diego MLS®. Displayed property listings may be held by a brokerage firm other than the broker and/or agent responsible for this display. The information and any photographs and video tours and the compilation from which they are derived is protected by copyright. Compilation © 2020 San Diego MLS®, Inc.
Neighborhoods near Inglewood, CA
Zip codes near Inglewood, CA
- 90003 homes for sale
- 90008 homes for sale
- 90043 homes for sale
- 90044 homes for sale
- 90045 homes for sale
- 90047 homes for sale
- 90056 homes for sale
- 90061 homes for sale
- 90062 homes for sale
- 90094 homes for sale
- 90230 homes for sale
- 90245 homes for sale
- 90249 homes for sale
- 90250 homes for sale
- 90260 homes for sale
- 90301 homes for sale
- 90302 homes for sale
- 90303 homes for sale
- 90304 homes for sale
- 90305 homes for sale
Popular searches near Inglewood, CA
- Alondra Park homes for sale
- Culver City homes for sale
- Del Aire homes for sale
- El Segundo homes for sale
- Florence-Graham homes for sale
- Gardena homes for sale
- Hawthorne homes for sale
- Ladera Heights homes for sale
- Lawndale homes for sale
- Leimert Park homes for sale
- Lennox homes for sale
- Los Angeles homes for sale
- Marina Del Rey homes for sale
- Playa Del Rey homes for sale
- Playa Vista homes for sale
- View Park-Windsor Hills homes for sale
- West Athens homes for sale
- West Rancho Dominguez homes for sale
- Westchester homes for sale
- Westmont homes for sale
Protect your home and budget from life's surprises with an Assurant Home Warranty, backed by a partner that supports you through every step of homeownership. Explore Plans.
©2026 Century 21 Real Estate LLC. All rights reserved. CENTURY 21®, the CENTURY 21 Logo and C21® are service marks owned by Century 21 Real Estate LLC. Century 21 Real Estate LLC fully supports the principles of the Fair Housing Act and the Equal Opportunity Act. Each office is independently owned and operated. Listing information is deemed reliable but not guaranteed accurate.