- Alamo Square, San Francisco homes for sale
- Bernal Heights, San Francisco homes for sale
- Buena Vista Park, San Francisco homes for sale
- Central, San Francisco homes for sale
- Central East, San Francisco homes for sale
- China Basin, San Francisco homes for sale
- Civic Center, San Francisco homes for sale
- Corona Heights, San Francisco homes for sale
- Dogpatch, San Francisco homes for sale
- Duboce Triangle, San Francisco homes for sale
- Eureka Valley, San Francisco homes for sale
- Hayes Valley, San Francisco homes for sale
- Mission Bay, San Francisco homes for sale
- Mission Dolores, San Francisco homes for sale
- Noe Valley, San Francisco homes for sale
- Potrero Hill, San Francisco homes for sale
- South of Market, San Francisco homes for sale
- Tenderloin, San Francisco homes for sale
- The Castro, San Francisco homes for sale
- The Design District, San Francisco homes for sale
Inner Mission, San Francisco, CA - homes for sale
49 of 49 results displayed
- Open Sat, 4:30 to 6:30pmNew
 $625,000Active2 beds 1 baths580 sq. ft.
108 Albion Street #A, San Francisco, CA 94110
MLS# 426116922Listed by: KW ADVISORS - New
 $1,335,000Active6 beds 3 baths1,750 sq. ft.
751 Capp Street #753, San Francisco, CA 94110
MLS# 426116352Listed by: CITY REAL ESTATE - Open Sat, 1 to 3pmNew
 $995,000Active2 beds 1 baths988 sq. ft.
317 San Carlos Street, San Francisco, CA 94110
MLS# 426115861Listed by: CITY REAL ESTATE  $949,000Pending2 beds 1 baths800 sq. ft.
12 Dearborn Street, San Francisco, CA 94110
MLS# 426112629Listed by: COMPASS- New
 $1,888,000Active3 beds 3 baths2,450 sq. ft.
569-571 Capp Street, San Francisco, CA 94110
MLS# 426115681Listed by: VANGUARD PROPERTIES - New
 $995,000Active3 beds 2 baths
49 Albion Street #A, San Francisco, CA 94103
MLS# 426099154Listed by: SOTHEBY'S INTERNATIONAL REALTY - New
 $999,000Active3 beds 1 baths1,450 sq. ft.
257 South Van Ness Avenue #257, San Francisco, CA 94103
MLS# 426113617Listed by: JOHN WARNER, BROKER - New
 $3,750,000Active17 beds 9 baths5,500 sq. ft.
751-753A Capp Street, San Francisco, CA 94110
MLS# 426114432Listed by: CITY REAL ESTATE - New
 $1,600,000Active5 beds 3 baths1,989 sq. ft.
751 Capp Street #751, San Francisco, CA 94110
MLS# 426114442Listed by: CITY REAL ESTATE - New
 $899,999Active5 beds 4 baths1,350 sq. ft.
751 Capp Street #753A, San Francisco, CA 94110
MLS# 426114446Listed by: CITY REAL ESTATE  $3,800,000Active6 beds 6 baths4,329 sq. ft.
626-628 Shotwell Street, San Francisco, CA 94110
MLS# 426113447Listed by: CITY REAL ESTATE $1,288,888Active4 beds -- baths2,040 sq. ft.
1339-1341 York Street, San Francisco, CA 94110
MLS# ML82039276Listed by: NU LEVEL REALTY, INC.- Open Thu, 6 to 7pm
 $1,050,000Active3 beds 2 baths
1712 Bryant Street, San Francisco, CA 94110
MLS# 426111962Listed by: COMPASS 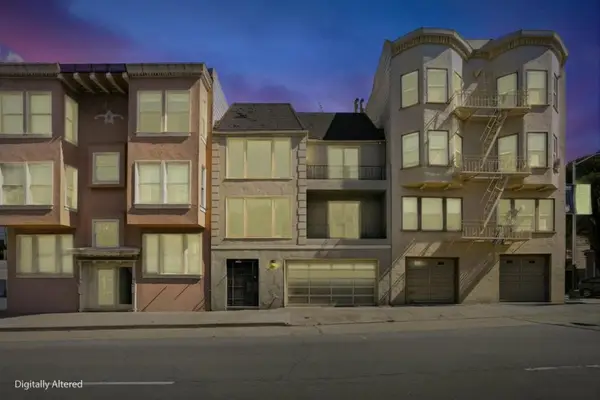 $1,799,000Active-- beds -- baths2,680 sq. ft.
1191 Guerrero Street, San Francisco, CA 94110
MLS# ML82038571Listed by: KINETIC REAL ESTATE- Open Sat, 2 to 4pm
 $875,000Active2 beds 1 baths936 sq. ft.
266 Clinton Park, San Francisco, CA 94103
MLS# 426111283Listed by: KW ADVISORS - Open Sat, 2 to 4pm
 $650,000Active2 beds 1 baths846 sq. ft.
57 Woodward Street, San Francisco, CA 94103
MLS# 426107350Listed by: GARRISON REALTY & INVESTMENTS  $1,250,000Pending6 beds 4 baths2,345 sq. ft.
832 Florida Street, San Francisco, CA 94110
MLS# 426106353Listed by: PELLEGO, INC. $5,500,000Active2 beds -- baths13,856 sq. ft.
2360 Mission Street, San Francisco, CA 94110
MLS# 426107286Listed by: INTERO REAL ESTATE SERVICES
 $2,900,000Active8 beds 4 baths5,216 sq. ft.
3579 19th Street, San Francisco, CA 94110
MLS# 426106778Listed by: CENTURY 21 BALDINI REALTY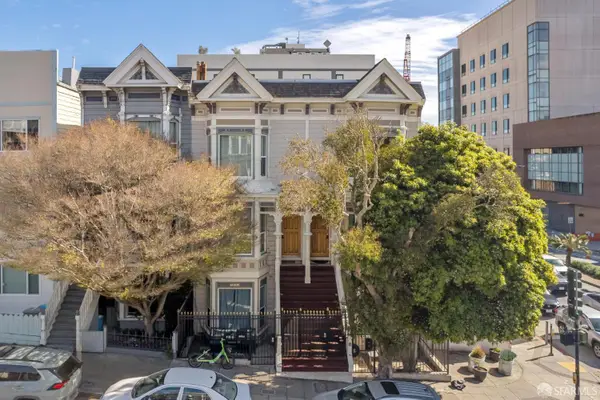 $1,995,000Pending12 beds 6 baths5,346 sq. ft.
1415-1417 Guerrero Street, San Francisco, CA 94110
MLS# 426106825Listed by: COMPASS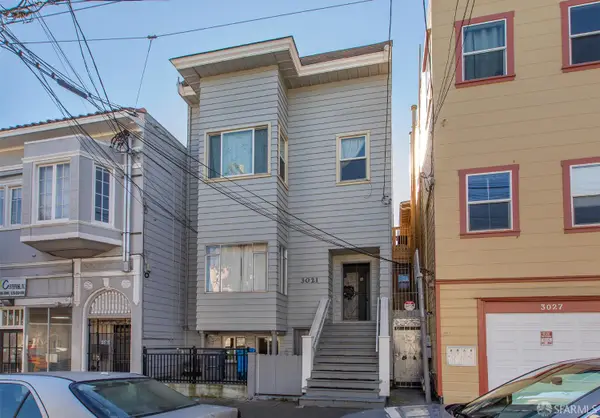 $699,995Pending3 beds 3 baths2,422 sq. ft.
3021 22nd Street, San Francisco, CA 94110
MLS# 426101697Listed by: COMPASS COMMERCIAL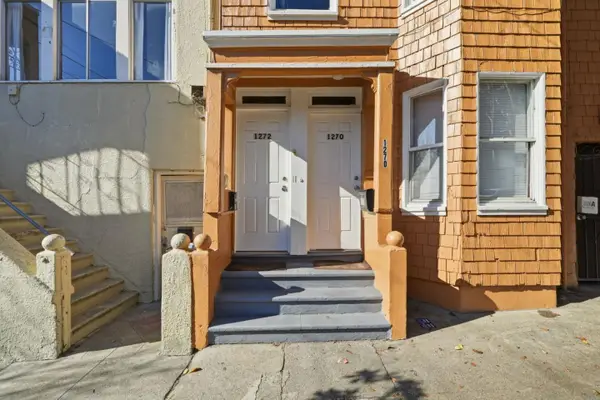 $999,000Active7 beds -- baths2,394 sq. ft.
1270 Hampshire Street, San Francisco, CA 94110
MLS# ML82033620Listed by: CENTURY 21 MASTERS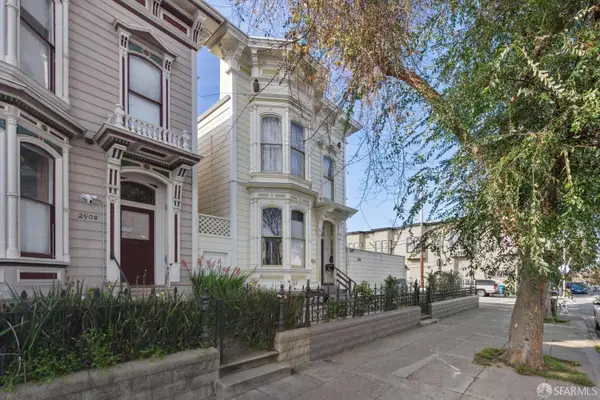 $1,800,000Active4 beds -- baths2,800 sq. ft.
2906 Folsom Street, San Francisco, CA 94110
MLS# 426095784Listed by: MAKRAS REAL ESTATE $899,000Pending3 beds 2 baths1,407 sq. ft.
2928 25th Street #2928, San Francisco, CA 94110
MLS# 426097040Listed by: PELLEGO, INC. $1,899,000Active-- beds -- baths2,790 sq. ft.
3001 25th Street, San Francisco, CA 94110
MLS# 426094097Listed by: HANNA IBRAHIM REALTY $995,000Active5 beds 4 baths1,350 sq. ft.
751 Capp Street #753A, San Francisco, CA 94110
MLS# 426095258Listed by: CITY REAL ESTATE $1,400,000Active6 beds 3 baths1,750 sq. ft.
751 Capp Street #753, San Francisco, CA 94110
MLS# 426095265Listed by: CITY REAL ESTATE $1,700,000Active5 beds 3 baths1,989 sq. ft.
751 Capp Street #751, San Francisco, CA 94110
MLS# 426094686Listed by: CITY REAL ESTATE $3,950,000Active17 beds 9 baths5,500 sq. ft.
751-753A Capp Street, San Francisco, CA 94110
MLS# 425092543Listed by: CITY REAL ESTATE $999,000Pending3 beds 2 baths1,557 sq. ft.
2920 25th Street #2924, San Francisco, CA 94110
MLS# 425093097Listed by: PELLEGO, INC. $995,000Active4 beds 4 baths2,250 sq. ft.
1134-1136 Treat Avenue, San Francisco, CA 94110
MLS# 425090631Listed by: COMPASS $799,900Active-- beds -- baths2,477 sq. ft.
1279 Florida Street, San Francisco, CA 94110
MLS# ML82027762Listed by: COLDWELL BANKER REALTY $4,318,000Active6 beds 5 baths5,184 sq. ft.
1117 Guerrero Street, San Francisco, CA 94110
MLS# 426101250Listed by: COMPASS $3,882,971Active6 beds -- baths5,832 sq. ft.
2403 16th Street, San Francisco, CA 94103
MLS# 425082046Listed by: COMPASS COMMERCIAL $1,328,000Active9 beds -- baths2,664 sq. ft.
2924-2926 Cesar Chavez Street, San Francisco, CA 94110
MLS# ML82024265Listed by: INTERO REAL ESTATE SERVICES $625,000Active2 beds 1 baths609 sq. ft.
108 Albion Street #B, San Francisco, CA 94110
MLS# 426101503Listed by: KW ADVISORS $1,749,000Active9 beds 3 baths2,880 sq. ft.
1294 Guerrero Street, San Francisco, CA 94110
MLS# 425069060Listed by: CENTURY 21 MASTERS $1,595,000Active4 beds -- baths3,650 sq. ft.
2950-2952 25th Street, San Francisco, CA 94110
MLS# 425056514Listed by: COMPASS COMMERCIAL $1,600,000Active3 beds -- baths3,140 sq. ft.
3451 22nd St, San Francisco, CA 94110
MLS# 41098175Listed by: EXP REALTY OF CALIFORNIA, INC $1,100,000Active2 beds 2 baths1,776 sq. ft.
333-335 Potrero Avenue, San Francisco, CA 94103
MLS# 424060017Listed by: SKYGROUP REALTY INC. $769,000Active2 beds 1 baths
1369 Natoma Street, San Francisco, CA 94103
MLS# 423927324Listed by: KW ADVISORS $1,384,000Active5 beds 2 baths1,996 sq. ft.
353 Lexington Street, San Francisco, CA 94110
MLS# 423926571Listed by: VANGUARD PROPERTIES $999,000Active3 beds 2 baths1,250 sq. ft.
1298 Treat Avenue, San Francisco, CA 94110
MLS# 423749592Listed by: COLDWELL BANKER REALTY $1,450,000Active5 beds -- baths2,250 sq. ft.
2401 23rd Street, San Francisco, CA 94110
MLS# 423917938Listed by: COMPASS $1,830,000Pending10 beds -- baths4,882 sq. ft.
980 Capp Street, San Francisco, CA 94110
MLS# 423911042Listed by: VANGUARD PROPERTIES $2,895,000Active13 beds -- baths5,210 sq. ft.
58 Alvarado Street, San Francisco, CA 94110
MLS# 423908077Listed by: COLDWELL BANKER COMMERCIAL REALTY $675,000Active2 beds 1 baths745 sq. ft.
106 Albion Street, San Francisco, CA 94110
MLS# 423906815Listed by: KW ADVISORS $2,999,000Active12 beds 1 baths4,590 sq. ft.
3632 24th Street, San Francisco, CA 94110
MLS# 423730287Listed by: COMPASS COMMERCIAL $2,000,000Active3 beds -- baths4,720 sq. ft.
2316 Mission Street, San Francisco, CA 94110
MLS# 423731657Listed by: MARCUS & MILLICHAP
Local realty services provided by:CENTURY 21 Baldini Real Estate, Inc., CENTURY 21 Wildwood Properties, Inc., CENTURY 21 Valley Properties, CENTURY 21 Select Real Estate, Inc.
The information being provided by San Francisco Association of REALTORS is for the consumer's personal, non-commercial use and may not be used for any purpose other than to identify prospective properties consumer may be interested in purchasing. Any information relating to real estate for sale referenced on this web site comes from the Internet Data Exchange (IDX) program of the San Francisco Association of REALTORS. This web site may reference real estate listing(s) held by a brokerage firm other than the broker and/or agent who owns this web site. The accuracy of all information, regardless of source, including but not limited to open house information, square footages and lot sizes, is deemed reliable but not guaranteed and should be personally verified through personal inspection by and/or with the appropriate professionals. The data contained herein is copyrighted by San Francisco Association of REALTORS and is protected by all applicable copyright laws. Any unauthorized dissemination of this information is in violation of copyright laws and is strictly prohibited.
The information being provided by California Regional MLS (Southern California) is for the consumer's personal, non-commercial use and may not be used for any purpose other than to identify prospective properties consumer may be interested in purchasing. Any information relating to real estate for sale referenced on this web site comes from the Internet Data Exchange (IDX) program of the California Regional MLS (Southern California). CENTURY 21 Valley Properties is not a Multiple Listing Service (MLS), nor does it offer MLS access. This website is a service of CENTURY 21 Valley Properties, a broker participant of California Regional MLS (Southern California). This web site may reference real estate listing(s) held by a brokerage firm other than the broker and/or agent who owns this web site.
The accuracy of all information, regardless of source, including but not limited to open house information, square footages and lot sizes, is deemed reliable but not guaranteed and should be personally verified through personal inspection by and/or with the appropriate professionals. The data contained herein is copyrighted by California Regional MLS (Southern California) and is protected by all applicable copyright laws. Any unauthorized dissemination of this information is in violation of copyright laws and is strictly prohibited.
Copyright 2021 California Regional MLS (Southern California). All rights reserved.
MetroList MLS 2026. This information is being provided by MetroList MLS. All measurements and calculations of area are approximate. Information provided by Seller/Other sources, not verified by Broker. All interested persons should independently verify accuracy of information. Provided properties may or may not be listed by the office/agent presenting the information. Data Updated: March 28, 2026. Information being provided is for consumers' personal, non-commercial use and may not be used for any purpose other than to identify prospective properties consumers may be interested in purchasing. Information deemed reliable but not guaranteed. Any offer of compensation is made only to Participants of MLS where the subject listing is filed and in accordance with such MLS's regulations or rules.
Popular neighborhoods near Inner Mission, San Francisco, CA
Zip codes near Inner Mission, San Francisco, CA
- 94102 homes for sale
- 94103 homes for sale
- 94105 homes for sale
- 94107 homes for sale
- 94108 homes for sale
- 94109 homes for sale
- 94110 homes for sale
- 94111 homes for sale
- 94112 homes for sale
- 94114 homes for sale
- 94115 homes for sale
- 94117 homes for sale
- 94118 homes for sale
- 94123 homes for sale
- 94124 homes for sale
- 94127 homes for sale
- 94131 homes for sale
- 94133 homes for sale
- 94134 homes for sale
- 94158 homes for sale
Counties near Inner Mission, San Francisco, CA
- Alameda County homes for sale
- Calaveras County homes for sale
- Colusa County homes for sale
- Contra Costa County homes for sale
- Lake County homes for sale
- Marin County homes for sale
- Napa County homes for sale
- Sacramento County homes for sale
- San Francisco County homes for sale
- San Joaquin County homes for sale
- San Mateo County homes for sale
- Santa Clara County homes for sale
- Santa Cruz County homes for sale
- Solano County homes for sale
- Sonoma County homes for sale
- Stanislaus County homes for sale
- Sutter County homes for sale
- Yolo County homes for sale
Protect your home and budget from life's surprises with an Assurant Home Warranty, backed by a partner that supports you through every step of homeownership. Explore Plans.
©2026 Century 21 Real Estate LLC. All rights reserved. CENTURY 21®, the CENTURY 21 Logo and C21® are service marks owned by Century 21 Real Estate LLC. Century 21 Real Estate LLC fully supports the principles of the Fair Housing Act and the Equal Opportunity Act. Each office is independently owned and operated. Listing information is deemed reliable but not guaranteed accurate.