- Arnould Heights, Lafayette homes for sale
- Bendel Gardens, Lafayette homes for sale
- Beverly Hills, Sulphur homes for sale
- Cable, Beaumont homes for sale
- Charlton Pollard, Beaumont homes for sale
- College Corridor, Beaumont homes for sale
- Gold Hill, Beaumont homes for sale
- Graywood, Lake Charles homes for sale
- Magnolia Park, Lafayette homes for sale
- Maplewood, Sulphur homes for sale
- MLK, Beaumont homes for sale
- Oaklawn Heights, Lafayette homes for sale
- Pinecrest, Beaumont homes for sale
- River Ranch, Lafayette homes for sale
- Souvenir Heights, Lafayette homes for sale
- Stonegate Manor, Port Arthur homes for sale
- Sugar Mill Pond, Youngsville homes for sale
- The Old Town Oaks, Beaumont homes for sale
- West End Heights West, Lafayette homes for sale
- Westwood, Westlake homes for sale
Iowa, LA - homes for sale
20 of 20 results displayed
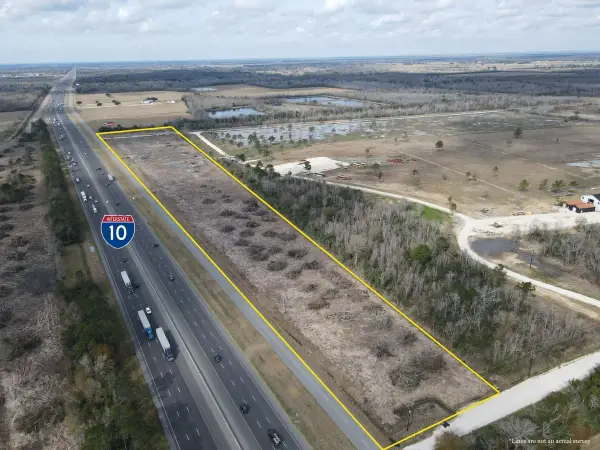
 $1,500,000Active15.98 Acres
TBD W Frontage Road, Iowa, LA 70647
MLS# SWL26000629Listed by: CENTURY 21 BONO REALTY $68,500Active0.46 Acres
0 Hwy 90, Iowa, LA 70647
MLS# SWL26000262Listed by: CENTURY 21 BESSETTE FLAVIN $149,800Active18.8 Acres
Mccown, Iowa, LA 70647
MLS# SWL25101705Listed by: COLDWELL BANKER INGLE SAFARI R $45,000Active0.17 Acres
202 W Highway 90 W, Iowa, LA 70647
MLS# SWL25101434Listed by: RE/MAX ONE $150,000Active2.02 Acres
0 E Miller Avenue E, Iowa, LA 70647
MLS# SWL24001975Listed by: CENTURY 21 BONO REALTY $69,900Active0.49 Acres
0 E Miller Avenue E, Iowa, LA 70647
MLS# SWL25100310Listed by: CENTURY 21 BONO REALTY $169,900Active0.97 Acres
0 E Miller Avenue E, Iowa, LA 70647
MLS# SWL25100316Listed by: CENTURY 21 BONO REALTY $1,817,400Active26 Acres
E Miller Avenue E, Iowa, LA 70647
MLS# SWL25100322Listed by: CENTURY 21 BONO REALTY $70,000Active4.17 Acres
0 101 Highway, Iowa, LA
MLS# SWL25003121Listed by: THE REAL ESTATE BROKERAGE $49,900Active0.88 Acres
8086 Kinlee Lane, Iowa, LA
MLS# SWL25002957Listed by: ENRG GLOBAL REALTY, LLC $269,900Active34.7 Acres
0 Hwy 165 Highway, Iowa, LA 70647
MLS# SWL25002533Listed by: WOLD REAL ESTATE $39,000Active0.47 Acres
0 6th Street, Iowa, LA 70647
MLS# SWL25002329Listed by: COLDWELL BANKER INGLE SAFARI REALTY $457,380Active3 Acres
Hwy 165 Highway, Iowa, LA 70647
MLS# SWL23001923Listed by: MOFFETT REALTY, LLC $62,500Active0.75 Acres
622 Woodland Street, Iowa, LA 70647
MLS# SWL25101158Listed by: CENTURY 21 BONO REALTY $62,500Active0.75 Acres
Woodland St, Iowa, LA 70647
MLS# 39-282Listed by: CENTURY 21 BONO REALTY $62,500Active0.45 Acres
Chestnut St, Iowa, LA 70647
MLS# 39-280Listed by: CENTURY 21 BONO REALTY $62,500Active0.45 Acres
606 Chestnut Street, Iowa, LA 70647
MLS# SWL25101159Listed by: CENTURY 21 BONO REALTY $110,000Active3.25 Acres
330 Hwy 165 Highway, Iowa, LA 70647
MLS# SWL25003551Listed by: CENTURY 21 BONO REALTY $3,495,000Active50 Acres
509 Frontage Road, Iowa, LA 70647
MLS# SWL25100323Listed by: CENTURY 21 BONO REALTY $1,500,000Active15 Acres
Hwy 165 Highway, Iowa, LA 70647
MLS# SWL22001355Listed by: MOFFETT REALTY, LLC
Local realty services provided by:CENTURY 21 Bono Realty, CENTURY 21 Delia Realty Group
Neighborhoods near Iowa, LA
Zip codes near Iowa, LA
- 70532 homes for sale
- 70546 homes for sale
- 70549 homes for sale
- 70581 homes for sale
- 70591 homes for sale
- 70601 homes for sale
- 70605 homes for sale
- 70607 homes for sale
- 70611 homes for sale
- 70615 homes for sale
- 70630 homes for sale
- 70633 homes for sale
- 70647 homes for sale
- 70648 homes for sale
- 70650 homes for sale
- 70652 homes for sale
- 70657 homes for sale
- 70658 homes for sale
- 70663 homes for sale
- 70669 homes for sale
Popular searches near Iowa, LA
- Bell City homes for sale
- Carlyss homes for sale
- Dequincy homes for sale
- Gillis homes for sale
- Grand Lake homes for sale
- Hayes homes for sale
- Iowa homes for sale
- Jennings homes for sale
- Kinder homes for sale
- Lacassine homes for sale
- Lake Arthur homes for sale
- Lake Charles homes for sale
- Moss Bluff homes for sale
- Prien homes for sale
- Ragley homes for sale
- Reeves homes for sale
- Roanoke homes for sale
- Sulphur homes for sale
- Welsh homes for sale
- Westlake homes for sale
Protect your home and budget from life's surprises with an Assurant Home Warranty, backed by a partner that supports you through every step of homeownership. Explore Plans.
©2026 Century 21 Real Estate LLC. All rights reserved. CENTURY 21®, the CENTURY 21 Logo and C21® are service marks owned by Century 21 Real Estate LLC. Century 21 Real Estate LLC fully supports the principles of the Fair Housing Act and the Equal Opportunity Act. Each office is independently owned and operated. Listing information is deemed reliable but not guaranteed accurate.