- Avalon, McDonough homes for sale
- Blythe, Blythe homes for sale
- Brown's Farm, Locust Grove homes for sale
- City Square, McDonough homes for sale
- Deer Run, Conyers homes for sale
- Eagle's Brooke Country Club, Locust Grove homes for sale
- Eagles Landing, McDonough homes for sale
- Eatlanta Farm, Covington Porterdale homes for sale
- Grove Landing, Grovetown homes for sale
- Hephzibah, Hephzibah homes for sale
- Heron Bay, Locust Grove homes for sale
- Honey Creek, Conyers homes for sale
- Kelarie, Grovetown homes for sale
- Lake Capri, Conyers homes for sale
- Nelson Heights, Covington homes for sale
- Patriots Ridge, Grovetown homes for sale
- Tara, Loganville homes for sale
- The Plantation, Covington Porterdale homes for sale
- Wesley Lakes, McDonough homes for sale
- Woodlake, Monroe homes for sale
Jeffersonville, GA - homes for sale
5 of 5 results displayed
- New
 $185,000Active3 beds 2 baths1,702 sq. ft.
257 E Railroad Street, Jeffersonville, GA 31044
MLS# 10815218Listed by: GPS Realty
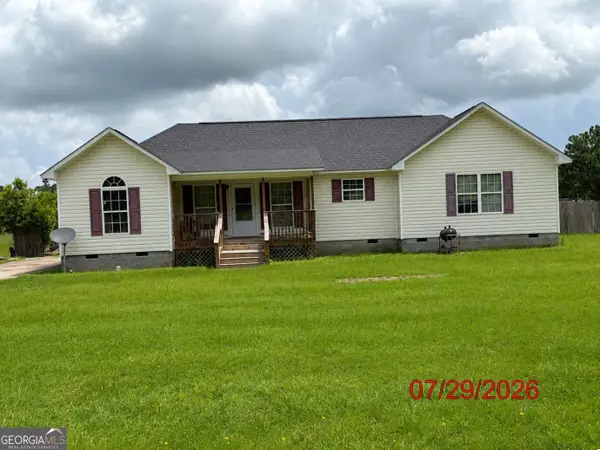
 $207,000Active3 beds 2 baths2,410 sq. ft.
290 Virginia Circle, Jeffersonville, GA 31044
MLS# 10808781Listed by: Dublin Real Estate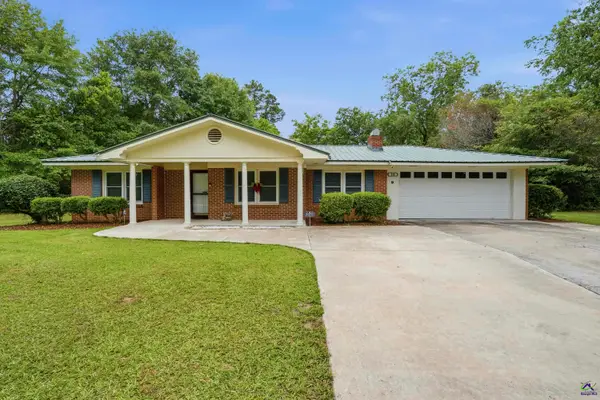 $220,000Active2 beds 2 baths1,058 sq. ft.
380 Highway 96 East, Jeffersonville, GA 31044
MLS# 263546Listed by: FICKLING & COMPANY - MACON $36,000Active4.41 Acres
00 Ac Court, Jeffersonville, GA 31044
MLS# 182953Listed by: PROPERTIES IN THE SOUTH, LLC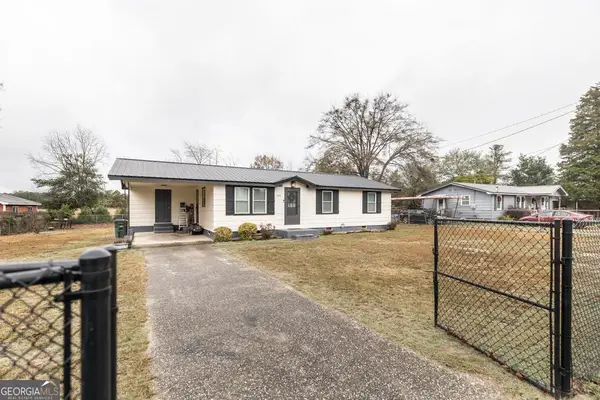 $139,900Active3 beds 1 baths936 sq. ft.
195 Wimberly Drive, Jeffersonville, GA 31044
MLS# 10655368Listed by: Wright Way Real Estate Services
Local realty services provided by:CENTURY 21 Crowe Realty, CENTURY 21 Homes & Investments
2026 Georgia MLS. All rights reserved. Information Deem Reliable But Not Guaranteed August 2, 2026 METROMLS Member Broker: Clinton Crowe
Neighborhoods near Jeffersonville, GA
Zip codes near Jeffersonville, GA
- 31005 homes for sale
- 31014 homes for sale
- 31017 homes for sale
- 31020 homes for sale
- 31022 homes for sale
- 31028 homes for sale
- 31031 homes for sale
- 31042 homes for sale
- 31044 homes for sale
- 31047 homes for sale
- 31054 homes for sale
- 31065 homes for sale
- 31088 homes for sale
- 31090 homes for sale
- 31093 homes for sale
- 31098 homes for sale
- 31201 homes for sale
- 31211 homes for sale
- 31216 homes for sale
- 31217 homes for sale
Popular searches near Jeffersonville, GA
- Allentown homes for sale
- Bonaire homes for sale
- Centerville homes for sale
- Danville homes for sale
- Danville homes for sale
- Dry Branch homes for sale
- Dudley homes for sale
- Gordon homes for sale
- Irwinton homes for sale
- Ivey homes for sale
- Kathleen homes for sale
- Macon homes for sale
- Macon East homes for sale
- McIntyre homes for sale
- Montrose homes for sale
- North Twiggs homes for sale
- Rutland homes for sale
- South Twiggs homes for sale
- Toomsboro homes for sale
- Warner Robins homes for sale
Protect your home and budget from life's surprises with an Assurant Home Warranty, backed by a partner that supports you through every step of homeownership. Explore Plans.
©2026 Century 21 Real Estate LLC. All rights reserved. CENTURY 21®, the CENTURY 21 Logo and C21® are service marks owned by Century 21 Real Estate LLC. Century 21 Real Estate LLC fully supports the principles of the Fair Housing Act and the Equal Opportunity Act. Each office is independently owned and operated. Listing information is deemed reliable but not guaranteed accurate.