- Ascot, Irmo homes for sale
- Blue Ridge Terrace, Columbia homes for sale
- Blythewood Farms, Blythewood homes for sale
- Broad River Corridor, Columbia homes for sale
- Challedon, Columbia homes for sale
- Chestnut Hill Plantation, Columbia homes for sale
- Cobblestone Park, Blythewood homes for sale
- Coldstream, Irmo homes for sale
- Eagles Glen, Blythewood homes for sale
- Friarsgate, Irmo homes for sale
- Gardendale, Seven Oaks homes for sale
- Heritage Forest, Blythewood homes for sale
- Murraywood, Irmo homes for sale
- Pintail Point, Gilbert homes for sale
- Quail Valley, Columbia homes for sale
- Saluda River Club, Lexington homes for sale
- Thorn Tree, Columbia homes for sale
- Whitehall, Seven Oaks homes for sale
- Willow Lake, Blythewood homes for sale
- Woodland Hills, Seven Oaks homes for sale
Jenkinsville, SC - homes for sale
3 of 3 results displayed
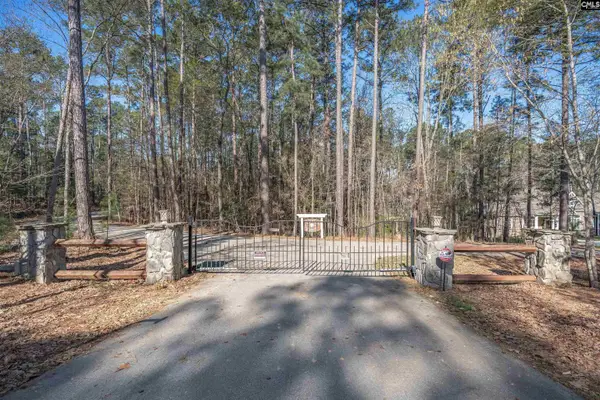 $82,500Active0.85 Acres
TBD Sc Highway 215, Jenkinsville, SC 29065
MLS# 629713Listed by: COLDWELL BANKER REALTY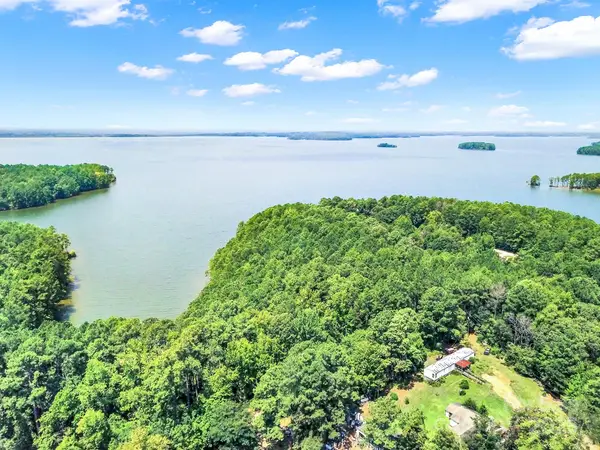 $299,000Active3.36 Acres
Lot 7 & 8 Sc Hwy 215 South, Fairfield, SC 29065
MLS# 4333646Listed by: NORTHGROUP REAL ESTATE LLC $77,900Active1 Acres
0 Lakeview Drive, Jenkinsville, SC 29065
MLS# 618119Listed by: HILLCREST LAND
Local realty services provided by:CENTURY 21 The Harrelson Group, CENTURY 21 Triangle Group
Last Updated: May 27, 2026 The data relating to real estate on this Web site derive in part from the Carolina Multiple Listing Services, Inc. IDX program. Brokers make an effort to deliver accurate information, but buyers should independently verify any information on which they will rely in a transaction. All properties are subject to prior sale, change or withdrawal. Neither CENTURY 21 The Harrelson Groupnor any listing broker shall be responsible for any typographical errors, misinformation, or misprints, and they shall be held totally harmless from any damages arising from reliance upon this data. This data is provided exclusively for consumers' personal, non-commercial use and may not be used for any purpose other than to identify prospective properties they may be interested in purchasing. Copyright 2026 Carolina Multiple Listing Services, Inc. SC_CML Member Broker: Richard Hine
Listings courtesy of Canopy MLS as distributed by MLS GRID. Copyright 2021 Canopy MLS. All rights reserved. Canopy MLS, provides content displayed here (“provided content”) on an “as is” basis and makes no representations or warranties regarding the provided content, including, but not limited to those of non-infringement, timeliness, accuracy, or completeness. Individuals and companies using information presented are responsible for verification and validation of information they utilize and present to their customers and clients. Canopy MLS will not be liable for any damage or loss resulting from use of the provided content or the products available through Portals, IDX, VOW, and/or Syndication. Recipients of this information shall not resell, redistribute, reproduce, modify, or otherwise copy any portion thereof without the expressed written consent of Canopy MLS. CH Member Broker: Pat Flanagan
Neighborhoods near Jenkinsville, SC
Zip codes near Jenkinsville, SC
- 29014 homes for sale
- 29015 homes for sale
- 29016 homes for sale
- 29031 homes for sale
- 29036 homes for sale
- 29063 homes for sale
- 29065 homes for sale
- 29072 homes for sale
- 29075 homes for sale
- 29108 homes for sale
- 29126 homes for sale
- 29127 homes for sale
- 29130 homes for sale
- 29169 homes for sale
- 29178 homes for sale
- 29180 homes for sale
- 29203 homes for sale
- 29204 homes for sale
- 29210 homes for sale
- 29212 homes for sale
Protect your home and budget from life's surprises with an Assurant Home Warranty, backed by a partner that supports you through every step of homeownership. Explore Plans.
©2026 Century 21 Real Estate LLC. All rights reserved. CENTURY 21®, the CENTURY 21 Logo and C21® are service marks owned by Century 21 Real Estate LLC. Century 21 Real Estate LLC fully supports the principles of the Fair Housing Act and the Equal Opportunity Act. Each office is independently owned and operated. Listing information is deemed reliable but not guaranteed accurate.