- 5, Shenandoah homes for sale
- Ashby homes for sale
- Bridgewater homes for sale
- Broadway homes for sale
- Dayton homes for sale
- Elkton homes for sale
- Grottoes homes for sale
- Harrisonburg homes for sale
- Keezletown homes for sale
- Massanetta Springs homes for sale
- Massanutten homes for sale
- McGaheysville homes for sale
- Mt Crawford homes for sale
- New Market homes for sale
- Penn Laird homes for sale
- Port Republic homes for sale
- Shenandoah homes for sale
- Stonewall homes for sale
- Timberville homes for sale
- Weyers Cave homes for sale
22832, VA - homes for sale
4 of 4 results displayed
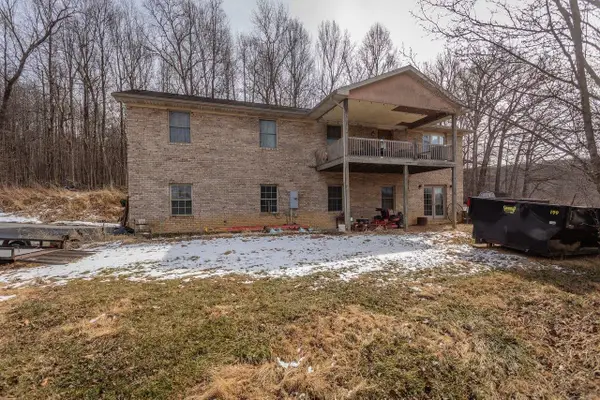 $330,000Pending3 beds 2 baths3,556 sq. ft.
3950 Happy Valley Rd, Keezletown, VA 22832
MLS# 673609Listed by: KLINE MAY REALTY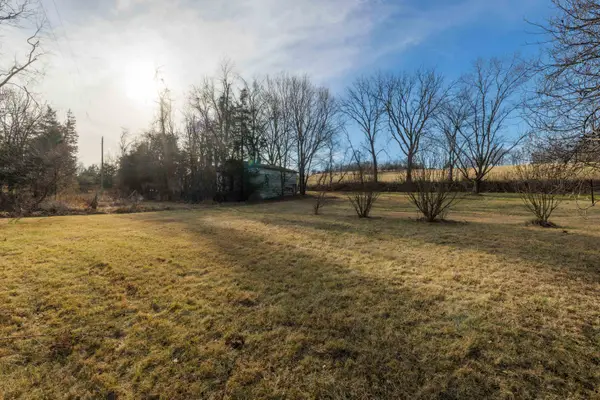 $59,900Pending1.84 Acres
TBD Mountain Valley Rd, Keezletown, VA 22832
MLS# 673304Listed by: OLD DOMINION REALTY INC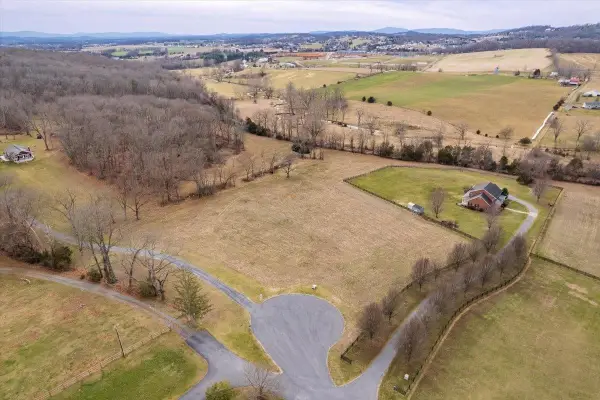 $310,000Active5.01 Acres
TBD Wildwood Dr, Keezletown, VA 22832
MLS# 672710Listed by: VALLEY REALTY ASSOCIATES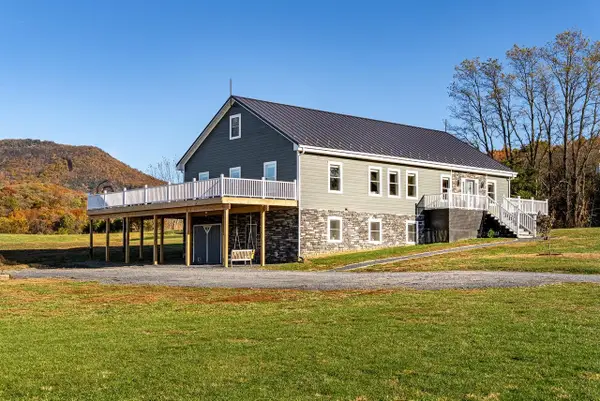 $799,000Pending3 beds 4 baths5,651 sq. ft.
3115 Lairds Knob Dr, Keezletown, VA 22832
MLS# 670785Listed by: KLINE MAY REALTY
Local realty services provided by:CENTURY 21 Realty @ Home
Popular searches near 22832
Popular neighborhoods near 22832
- 10th & Page, Charlottesville homes for sale
- Afton, Afton homes for sale
- Barboursville, Barboursville homes for sale
- Barracks, Charlottesville homes for sale
- Fifeville, Charlottesville homes for sale
- Forest Lakes, Charlottesville homes for sale
- Fry's Spring, Charlottesville homes for sale
- Greenbrier, Charlottesville homes for sale
- Ivy, Charlottesville homes for sale
- Jefferson Park Avenue, Charlottesville homes for sale
- Locust Grove, Charlottesville homes for sale
- Martha Jefferson, Charlottesville homes for sale
- North Downtown, Charlottesville homes for sale
- Redfields, Charlottesville homes for sale
- Ride Hill, Charlottesville homes for sale
- Ridge Street, Charlottesville homes for sale
- River Run, Charlottesville homes for sale
- Starr Hill, Charlottesville homes for sale
- The Meadows, Charlottesville homes for sale
- Venable, Charlottesville homes for sale
Counties near Keezletown, 22832
- Albemarle County homes for sale
- Augusta County homes for sale
- Charlottesville city County homes for sale
- Culpeper County homes for sale
- Grant County homes for sale
- Greene County homes for sale
- Hardy County homes for sale
- Harrisonburg city County homes for sale
- Highland County homes for sale
- Madison County homes for sale
- Nelson County homes for sale
- Orange County homes for sale
- Page County homes for sale
- Pendleton County homes for sale
- Rappahannock County homes for sale
- Rockingham County homes for sale
- Shenandoah County homes for sale
- Staunton city County homes for sale
- Warren County homes for sale
- Waynesboro city County homes for sale
Protect your home and budget from life's surprises with an Assurant Home Warranty, backed by a partner that supports you through every step of homeownership. Explore Plans.
©2026 Century 21 Real Estate LLC. All rights reserved. CENTURY 21®, the CENTURY 21 Logo and C21® are service marks owned by Century 21 Real Estate LLC. Century 21 Real Estate LLC fully supports the principles of the Fair Housing Act and the Equal Opportunity Act. Each office is independently owned and operated. Listing information is deemed reliable but not guaranteed accurate.