- Black Pearl, New Orleans properties for sale
- Bonnabel Place, Metairie properties for sale
- Bucktown, Metairie properties for sale
- Dixon, New Orleans properties for sale
- East Carrollton, New Orleans properties for sale
- Fountainbleau, New Orleans properties for sale
- Highland Acres, River Ridge properties for sale
- Holly Grove, New Orleans properties for sale
- Lake Vista, Kenner properties for sale
- Lakeshore, Metairie properties for sale
- Lakeshore, New Orleans properties for sale
- Lakeview, New Orleans properties for sale
- Lakewood, New Orleans properties for sale
- Leonidas, New Orleans properties for sale
- Morningside Park, Kenner properties for sale
- Navarre, New Orleans properties for sale
- Ormond Estates, Destrehan properties for sale
- Uptown, New Orleans properties for sale
- West End, New Orleans properties for sale
- Westgate, Metairie properties for sale
Kenner, LA - homes for sale
295 of 295 results displayed
- New
 $150,000Active0.18 Acres
3162 Virginia Street, Kenner, LA 70065
MLS# 2534487Listed by: KELLER WILLIAMS REALTY 455-0100 - New
 $389,000Active3 beds 2 baths1,916 sq. ft.
3405 Connecticut Avenue, Kenner, LA 70065
MLS# 2534454Listed by: COMPASS HISTORIC (LATT09) - New
 $272,000Active3 beds 2 baths1,331 sq. ft.
2320 Roosevelt Boulevard, Kenner, LA 70062
MLS# 2534055Listed by: COMPASS COVINGTON (LATT27) - New
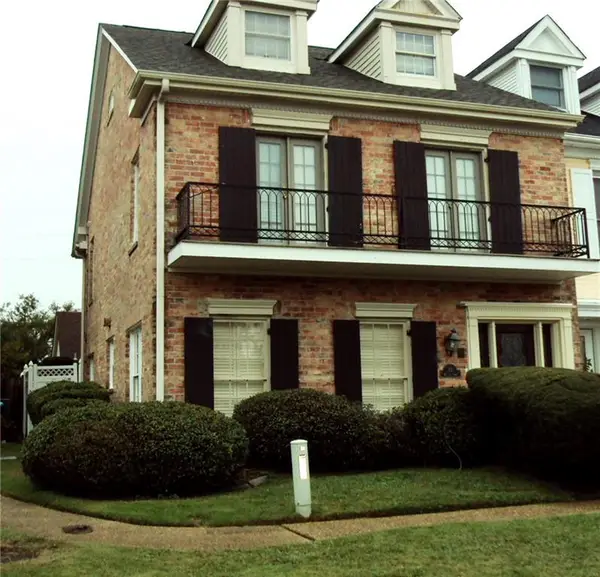
 $295,000Active3 beds 4 baths2,500 sq. ft.
10 Rue Saint Louis Street, Kenner, LA 70065
MLS# 2533694Listed by: SHARON D. KOCHERA - New
 $295,000Active3 beds 4 baths2,500 sq. ft.
10 Rue Saint Louis Street, Kenner, LA 70065
MLS# 2533694Listed by: SHARON D. KOCHERA - New
 $335,000Active3 beds 3 baths2,195 sq. ft.
3206 Connecticut Avenue, Kenner, LA 70065
MLS# 2534186Listed by: COMPASS KENNER (LATT30) - New
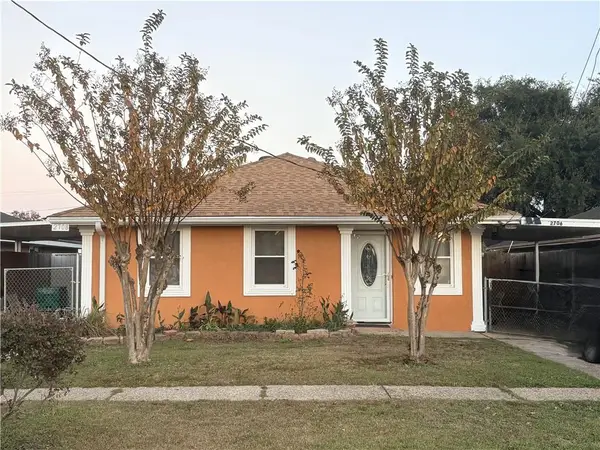 $300,000Active3 beds 2 baths1,192 sq. ft.
2706-08 Acron Street, Kenner, LA 70062
MLS# 2533710Listed by: REALTY ONE GROUP IMMOBILIA - New
 $239,000Active6 beds 5 baths3,200 sq. ft.
200 22 27th Street, Kenner, LA 70062
MLS# 2534108Listed by: COMPASS METRO (LATT01) - New
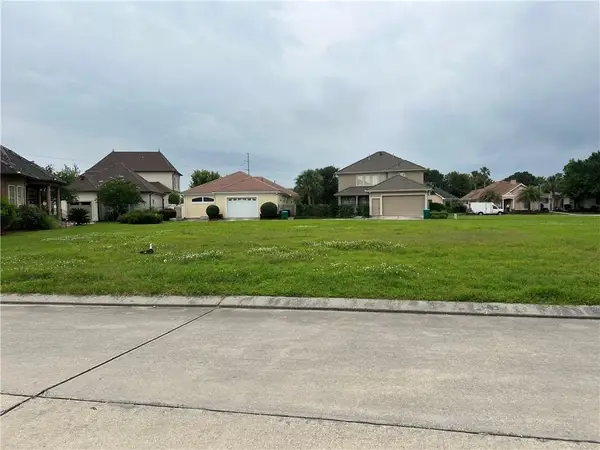 $445,000Active0 Acres
190 Cycas, Kenner, LA 70065
MLS# 2533945Listed by: NOLA LIVING REALTY - New
 $200,000Active3 beds 1 baths1,244 sq. ft.
205 Coleman Place, Kenner, LA 70062
MLS# 2533642Listed by: KELLER WILLIAMS REALTY 455-0100 - New
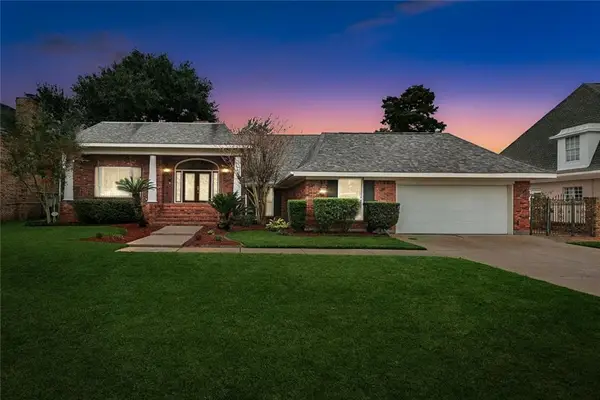
 $375,000Active3 beds 2 baths1,788 sq. ft.
3505 Lake Trail Drive, Kenner, LA 70065
MLS# 2532865Listed by: KELLER WILLIAMS REALTY 455-0100 - New
 $625,000Active4 beds 4 baths4,115 sq. ft.
81 Chateau Mouton Drive, Kenner, LA 70065
MLS# 2533325Listed by: COMPASS UPTOWN (LATT07) - New
 $389,999Active4 beds 2 baths2,277 sq. ft.
62 Driftwood Boulevard, Kenner, LA 70065
MLS# 2533686Listed by: AMPLIFIED REALTY GROUP, INC. - New
 $265,000Active6 beds 2 baths1,300 sq. ft.
900 02 27th Street, Kenner, LA 70062
MLS# 2533700Listed by: NOLA LIVING REALTY - New
 $365,000Active4 beds 3 baths3,284 sq. ft.
71 Verde Street, Kenner, LA 70065
MLS# 2533705Listed by: REALTY ONE GROUP IMMOBILIA - New
 $349,900Active3 beds 2 baths1,870 sq. ft.
3140 Maryland Avenue, Kenner, LA 70065
MLS# 2533350Listed by: RE/MAX LIVING - New
 $159,500Active3 beds 1 baths915 sq. ft.
2724 Huntsville Street, Kenner, LA 70062
MLS# 2533147Listed by: NOLA LIVING REALTY - New
 $151,000Active3 beds 2 baths1,589 sq. ft.
135 Miami Place, Kenner, LA 70065
MLS# 2533477Listed by: COMMUNITY REALESTATE LLC - New
 $170,000Active3 beds 1 baths1,281 sq. ft.
3612 California Avenue, Kenner, LA 70065
MLS# 2532161Listed by: MCCARTHY GROUP REALTORS - New
 $120,000Active2 beds 2 baths1,432 sq. ft.
1500 W Esplanade Avenue #43d, Kenner, LA 70065
MLS# 2531832Listed by: RE/MAX LIVING - New
 $759,000Active0.34 Acres
Lot 239 Masoni, Kenner, LA 70065
MLS# 2533205Listed by: KELLER WILLIAMS REALTY 455-0100 - New
 $409,900Active4 beds 3 baths2,090 sq. ft.
3632 W Louisiana State Drive, Kenner, LA 70065
MLS# 2533179Listed by: KELLER WILLIAMS REALTY 455-0100 - New
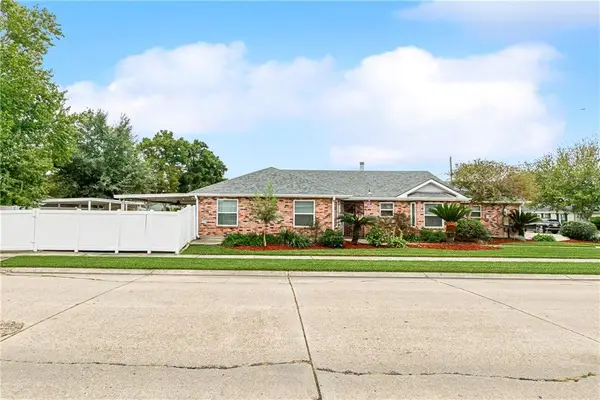 $325,000Active3 beds 2 baths1,609 sq. ft.
3044 Tennessee Avenue, Kenner, LA 70065
MLS# 2532963Listed by: CRESCENT SOTHEBY'S INTERNATIONAL  $315,900Active5 beds 2 baths1,971 sq. ft.
3832 Ole Miss Drive, Kenner, LA 70065
MLS# 2532706Listed by: NORVEL BENOIT $285,000Pending3 beds 2 baths1,709 sq. ft.
3300 Maryland Avenue, Kenner, LA 70065
MLS# 2532609Listed by: HOMESMART REALTY SOUTH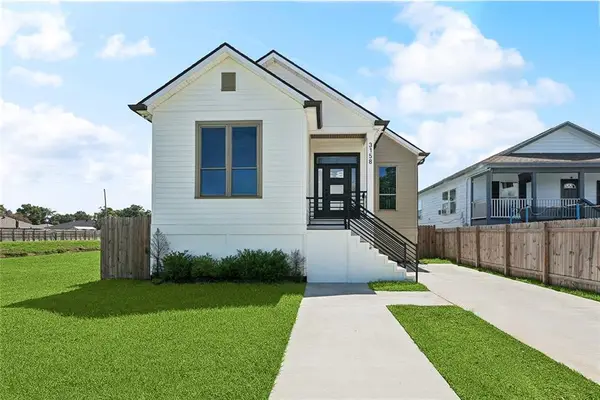 $333,900Active3 beds 2 baths1,702 sq. ft.
3158 Augusta Street, Kenner, LA 70065
MLS# 2532292Listed by: KELLER WILLIAMS REALTY 455-0100 $259,900Active3 beds 2 baths1,450 sq. ft.
226 Incarnate Wood Drive, Kenner, LA 70065
MLS# 2532092Listed by: BERKSHIRE HATHAWAY HOMESERVICES PREFERRED, REALTOR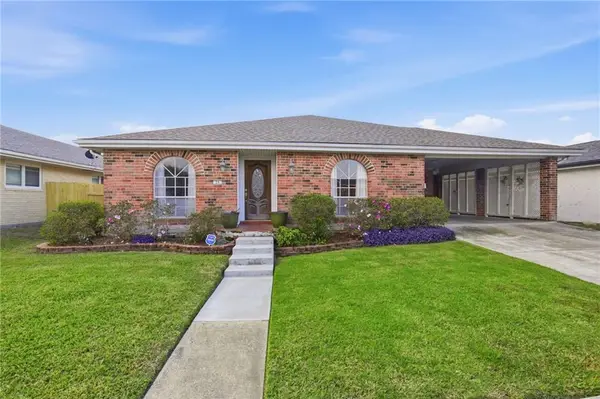 $275,000Active3 beds 2 baths1,906 sq. ft.
25 Forstall Avenue, Kenner, LA 70065
MLS# 2531911Listed by: EPIQUE REALTY $240,000Active3 beds 2 baths1,300 sq. ft.
1701 Missouri Avenue, Kenner, LA 70062
MLS# 2531764Listed by: PINTAT REALTY LLC $146,000Active2 beds 1 baths985 sq. ft.
1001 Maine Avenue, Kenner, LA 70062
MLS# 2531546Listed by: NOLA LIVING REALTY $375,000Pending3 beds 2 baths2,139 sq. ft.
6 Mercurey Drive, Kenner, LA 70065
MLS# 2532018Listed by: COLDWELL BANKER TEC METAIRIE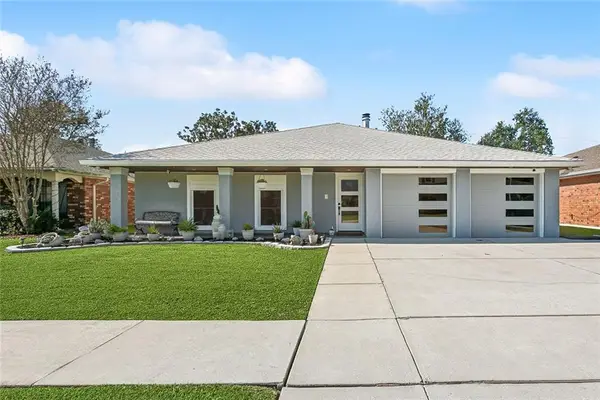 $430,000Active4 beds 2 baths2,230 sq. ft.
13 Echezeaux Drive, Kenner, LA 70065
MLS# 2531951Listed by: KELLER WILLIAMS REALTY 455-0100 $525,000Active4 beds 4 baths2,810 sq. ft.
4209 Bordeaux Drive, Kenner, LA 70065
MLS# 2531851Listed by: REALTY EXECUTIVES SELA $444,900Active4 beds 3 baths2,083 sq. ft.
1916 Roosevelt Boulevard, Kenner, LA 70062
MLS# 2531950Listed by: KELLER WILLIAMS REALTY 455-0100 $309,900Active4 beds 3 baths2,686 sq. ft.
3100 Tupelo Street, Kenner, LA 70065
MLS# 2531771Listed by: CONGRESS REALTY, INC. $125,000Active2 beds 2 baths1,060 sq. ft.
169 Avant Garde Circle #169, Kenner, LA 70065
MLS# 2531553Listed by: REALTY ONE GROUP IMMOBILIA $879,900Active5 beds 5 baths3,770 sq. ft.
11 Cocos, Kenner, LA 70065
MLS# 2531802Listed by: ED WHITE & ASSOCIATES, INC. $139,900Active3 beds 1 baths1,269 sq. ft.
3620 Arkansas Avenue, Kenner, LA 70065
MLS# 2531786Listed by: UNITED REAL ESTATE PARTNERS LLC $295,000Active3 beds 2 baths1,680 sq. ft.
2109 Maine Avenue, Kenner, LA 70062
MLS# 2531641Listed by: RE/MAX AFFILIATES $249,000Active3 beds 2 baths1,638 sq. ft.
1212 Maine Avenue, Kenner, LA 70062
MLS# 2531709Listed by: HOMESMART REALTY SOUTH $850,000Active12 beds 12 baths6,400 sq. ft.
3572 Martinique Avenue, Kenner, LA 70065
MLS# 2531638Listed by: KELLER WILLIAMS REALTY 455-0100 $1,000,000Active4 beds 3 baths3,123 sq. ft.
31 Palmetto, Kenner, LA 70065
MLS# 2531523Listed by: DOWNTOWN REALTY $219,000Active3 beds 2 baths1,350 sq. ft.
361 W Louisiana State Street, Kenner, LA 70065
MLS# 2531258Listed by: BRANDY NICHOLS REALTY $161,000Pending3 beds 3 baths1,600 sq. ft.
114 Avant Garde Circle #114, Kenner, LA 70064
MLS# 2531141Listed by: SHARON D. KOCHERA $252,000Active3 beds 2 baths1,273 sq. ft.
25 Furman Drive, Kenner, LA 70065
MLS# 2531074Listed by: COMPASS KENNER (LATT30) $425,000Active3 beds 2 baths1,857 sq. ft.
3920 Lake Trail Drive, Kenner, LA 70065
MLS# 2531038Listed by: RE/MAX LIVING- Open Sun, 2am to 4pmNew
 $380,000Active3 beds 2 baths1,811 sq. ft.
3701 W Loyola Drive, Kenner, LA 70065
MLS# 2533598Listed by: CASA REALTY GROUP LLC  $325,000Active4 beds 2 baths1,650 sq. ft.
3040 Indiana Avenue, Kenner, LA 70065
MLS# 2530950Listed by: KEY TURNER REALTY LLC $475,000Active4 beds 4 baths2,935 sq. ft.
29 Platt Street, Kenner, LA 70065
MLS# 2530615Listed by: COMPASS DESTREHAN (LATT21) $380,000Active4 beds 3 baths2,500 sq. ft.
83 Coronado Avenue, Kenner, LA 70065
MLS# 2530328Listed by: BURK BROKERAGE, LLC $300,000Active3 beds 2 baths1,933 sq. ft.
4336 Delaware Avenue, Kenner, LA 70065
MLS# 2530573Listed by: RODI REALTY, INC $354,000Active3 beds 3 baths2,400 sq. ft.
9508 Alhambra Court, River Ridge, LA 70123
MLS# 2530329Listed by: WURTH REAL ESTATE SERVICES $239,900Active4 beds 2 baths1,448 sq. ft.
3933 Delaware Avenue, Kenner, LA 70065
MLS# 2530559Listed by: NOLA LIVING REALTY $155,000Active2 beds 2 baths1,050 sq. ft.
245 Avant Garde Circle #245, Kenner, LA 70065
MLS# 2530532Listed by: RE/MAX SYNERGY $325,900Active0 Acres
Lot 114 Louisiana Trace Boulevard, Kenner, LA 70065
MLS# 2530560Listed by: IRON HORSE LAND COMPANY $319,900Active0 Acres
Lot 113 Louisiana Trace Boulevard, Kenner, LA 70065
MLS# 2530563Listed by: IRON HORSE LAND COMPANY $288,900Active0 Acres
Lot 8 Dogwood Drive, Kenner, LA 70065
MLS# 2530564Listed by: IRON HORSE LAND COMPANY $65,000Active0.11 Acres
3122 Albany Street, Kenner, LA 70065
MLS# 2530309Listed by: KELLER WILLIAMS REALTY 455-0100 $55,000Active0.11 Acres
3133 Dawson Street, Kenner, LA 70065
MLS# 2530311Listed by: KELLER WILLIAMS REALTY 455-0100 $150,000Active0.34 Acres
3148 Virginia Street, Kenner, LA 70065
MLS# 2530318Listed by: KELLER WILLIAMS REALTY 455-0100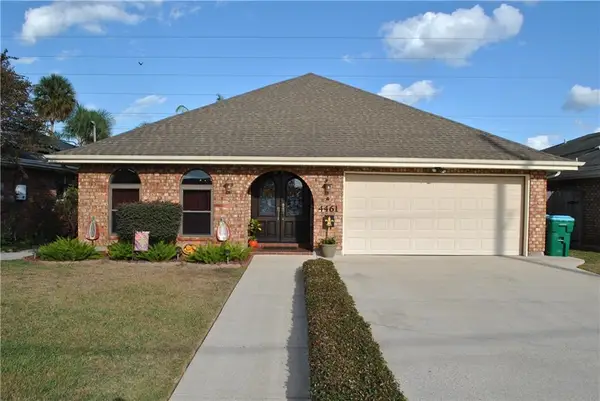 $410,000Active4 beds 2 baths2,099 sq. ft.
4461 David Drive, Kenner, LA 70065
MLS# 2530200Listed by: COMPASS UPTOWN-MAPLE ST (LATT28) $139,500Active2 beds 2 baths1,077 sq. ft.
149 Avant Garde. Circle #149, Kenner, LA 70065
MLS# 2530233Listed by: HOMESMART REALTY SOUTH $235,000Active3 beds 2 baths1,215 sq. ft.
4109 Tulane Drive, Kenner, LA 70065
MLS# 2530141Listed by: UNITED REAL ESTATE PARTNERS $364,900Active3 beds 2 baths1,785 sq. ft.
3140 Texas Avenue, Kenner, LA 70065
MLS# 2527319Listed by: MERCER REALTY GROUP $285,000Active3 beds 2 baths1,600 sq. ft.
3 Caddo Ct, Kenner, LA 70065
MLS# 2526602Listed by: KELLER WILLIAMS REALTY SERVICES $139,900Active2 beds 2 baths1,432 sq. ft.
1500 W Esplanade Avenue #25-D, Kenner, LA 70065
MLS# 2529428Listed by: BLUE HERON REALTY $340,000Active6 beds 2 baths2,800 sq. ft.
147 49 Bonner Street, Kenner, LA 70062
MLS# 2529422Listed by: COMPASS HISTORIC (LATT09) $315,000Active3 beds 2 baths1,852 sq. ft.
413 Pellerin Drive, Kenner, LA 70065
MLS# 2527649Listed by: HOMESMART REALTY SOUTH $264,999Active3 beds 2 baths1,575 sq. ft.
3129 Tennessee Avenue, Kenner, LA 70065
MLS# 2528771Listed by: BERKSHIRE HATHAWAY HOMESERVICES PREFERRED, REALTOR $259,000Active3 beds 2 baths1,430 sq. ft.
3212 Illinois Avenue, Kenner, LA 70065
MLS# 2529078Listed by: COMPASS UPTOWN-MAPLE ST (LATT28) $149,000Active2 beds 2 baths1,227 sq. ft.
152 Avant Garde Circle #152, Kenner, LA 70065
MLS# 2528263Listed by: RE/MAX SYNERGY $149,000Active2 beds 2 baths1,200 sq. ft.
901 Vouray Drive #C, Kenner, LA 70065
MLS# 2526158Listed by: NOLA LIVING REALTY $175,000Active4 beds 2 baths1,415 sq. ft.
1215 31 Street Street, Kenner, LA 70065
MLS# 2528425Listed by: DEMAND REALTY $375,000Active4 beds 4 baths1,099 sq. ft.
4208 10 Chateau Boulevard, Kenner, LA 70065
MLS# 2528787Listed by: COMPASS KENNER (LATT30) $949,000Active5 beds 5 baths4,072 sq. ft.
2701 Gay Lynn Drive, Kenner, LA 70065
MLS# 2528622Listed by: 23 REALTY, LLC $729,000Active4 beds 3 baths2,929 sq. ft.
4057 Turtle Bayou Drive, Kenner, LA 70065
MLS# 2528184Listed by: KELLER WILLIAMS REALTY 455-0100 $249,500Active3 beds 2 baths1,370 sq. ft.
8 Colgate Place, Kenner, LA 70065
MLS# 2528251Listed by: JPAR GULF SOUTH $120,000Active3 beds 2 baths1,725 sq. ft.
1500 W Esplanade Avenue #35H, Kenner, LA 70065
MLS# 2528185Listed by: CBTEC MAGAZINE $275,000Active3 beds 1 baths1,397 sq. ft.
641 Cameron Court, Kenner, LA 70065
MLS# 2528158Listed by: BARDEN REALTY, LLC $329,900Active4 beds 3 baths2,941 sq. ft.
7 Yosemite Street, Kenner, LA 70065
MLS# 2520313Listed by: LATTER & BLUM (LATT30) $240,000Active3 beds 1 baths2,332 sq. ft.
1403 W Esplanade Avenue, Kenner, LA 70065
MLS# 2527419Listed by: CRANE REALTORS $545,000Active4 beds 3 baths2,722 sq. ft.
53 Woodlake Boulevard, Kenner, LA 70065
MLS# 2525995Listed by: NOLA LIVING REALTY $539,900Active4 beds 3 baths3,098 sq. ft.
217 Little Bayou Lane, Kenner, LA 70065
MLS# 2525389Listed by: COMPASS WESTBANK (LATT10) $269,000Active4 beds 2 baths1,600 sq. ft.
3310 Chateau Boulevard, Kenner, LA 70065
MLS# 2527922Listed by: HOSPITALITY REALTY $440,000Active3 beds 3 baths2,680 sq. ft.
18 Everglades Street, Kenner, LA 70065
MLS# 2527430Listed by: COMPASS KENNER (LATT30) $345,000Active4 beds 3 baths1,722 sq. ft.
3136 Lexington Street, Kenner, LA 70065
MLS# 2527843Listed by: NOLA LIVING REALTY $648,000Active5 beds 3 baths3,124 sq. ft.
229 Legrande Bayou Lane, Kenner, LA 70065
MLS# 2527788Listed by: KELLER WILLIAMS REALTY 455-0100 $435,000Active3 beds 3 baths2,434 sq. ft.
501 Carmenere Drive, Kenner, LA 70065
MLS# 2527384Listed by: KELLER WILLIAMS REALTY 455-0100 $350,000Active3 beds 3 baths2,068 sq. ft.
3024 Indiana Avenue, Kenner, LA 70065
MLS# 2527497Listed by: REALTY ONE GROUP IMMOBILIA $311,000Active3 beds 2 baths1,949 sq. ft.
2200 Delaware Avenue, Kenner, LA 70062
MLS# 2519842Listed by: GRACI REAL ESTATE & APPRAISIAL SERVICE, L.L.C. $268,000Active4 beds 2 baths1,616 sq. ft.
3916 Connecticut Avenue, Kenner, LA 70065
MLS# 2527348Listed by: COMPASS KENNER (LATT30) $259,000Active3 beds 2 baths1,600 sq. ft.
448 Pellerin Drive, Kenner, LA 70065
MLS# 2524944Listed by: COMPASS METRO (LATT01) $299,000Active3 beds 2 baths1,646 sq. ft.
3432 Roosevelt Boulevard, Kenner, LA 70065
MLS# 2526818Listed by: REALTY ONE GROUP IMMOBILIA $450,000Active4 beds 3 baths2,701 sq. ft.
4140 Beaujolais Drive, Kenner, LA 70065
MLS# 2522595Listed by: KELLER WILLIAMS REALTY 455-0100 $685,000Active5 beds 4 baths3,838 sq. ft.
224 Legrande Bayou Lane, Kenner, LA 70065
MLS# 2526324Listed by: ARMSTRONG REALTY $249,000Active3 beds 2 baths1,410 sq. ft.
82 Kilgore Place, Kenner, LA 70065
MLS# 2526719Listed by: FLEUR DE LIS REALTY GROUP $275,000Active3 beds 2 baths1,434 sq. ft.
3287 Chateau Boulevard, Kenner, LA 70065
MLS# 2526367Listed by: ACADIAN REALTY LLC $335,900Active3 beds 2 baths1,867 sq. ft.
1916 12th Street, Kenner, LA 70062
MLS# 2526905Listed by: RE/MAX AFFILIATES $280,000Active4 beds 2 baths1,843 sq. ft.
828 Sessions Ln Lane, Kenner, LA 70065
MLS# 2526694Listed by: KELLER WILLIAMS REALTY 455-0100 $389,000Active3 beds 2 baths2,013 sq. ft.
5332 Erlanger Road, Kenner, LA 70065
MLS# 2526781Listed by: FQR REALTORS $275,000Active3 beds 2 baths1,592 sq. ft.
636 Lancer Lane, Kenner, LA 70062
MLS# 2523344Listed by: LEONE GNO REALTY LLC $145,000Active2 beds 2 baths1,432 sq. ft.
1500 W Esplanade Drive #26E, Kenner, LA 70065
MLS# 2524731Listed by: NEXTHOME PREMIER REALTORS $290,000Active3 beds 2 baths1,960 sq. ft.
4204 Loire Drive, Kenner, LA 70065
MLS# 2525909Listed by: CARRIAGE HOUSE REALTY $115,000Active2 beds 2 baths1,050 sq. ft.
4101 Delaware Avenue #6, Kenner, LA 70065
MLS# 2519080Listed by: RE/MAX LIVING $1,150,000Active3 beds 4 baths3,787 sq. ft.
26 Cycas Street, Kenner, LA 70065
MLS# 2525202Listed by: RE/MAX AFFILIATES
 $518,800Active12 beds 8 baths4,988 sq. ft.
732 Vouray Drive, Kenner, LA 70065
MLS# 2529241Listed by: CENTURY 21 J. CARTER & COMPANY $260,000Active3 beds 2 baths1,401 sq. ft.
3809 Delaware Avenue, Kenner, LA 70065
MLS# 2525825Listed by: NOLA LIVING REALTY $269,000Active4 beds 2 baths1,199 sq. ft.
669 Spartan Lane, Kenner, LA 70065
MLS# 2525582Listed by: KELLER WILLIAMS REALTY 455-0100 $104,900Active2 beds 1 baths1,014 sq. ft.
4012 Colorado Avenue, Kenner, LA 70065
MLS# 2525136Listed by: CANNIZZARO REALTY, APPRAISALS & SALES, LLC $119,000Active2 beds 1 baths750 sq. ft.
3210 Arkansas Avenue, Kenner, LA 70065
MLS# 2525082Listed by: NOLA LIVING REALTY $290,000Active4 beds 2 baths1,680 sq. ft.
2409 Kentucky Avenue, Kenner, LA 70062
MLS# 2525060Listed by: WATERMARK REALTY, LLC $104,500Active3 beds 3 baths1,747 sq. ft.
1500 W Esplanade Avenue #23B, Kenner, LA 70065
MLS# 2524953Listed by: KEY TURNER REALTY LLC $305,000Active4 beds 3 baths2,000 sq. ft.
75 Lucaya Drive, Kenner, LA 70065
MLS# 2524934Listed by: NOLA LIVING REALTY $385,000Active4 beds 2 baths2,445 sq. ft.
1904 Michigan Avenue, Kenner, LA 70062
MLS# 2524284Listed by: KELLER WILLIAMS REALTY NEW ORLEANS $625,000Active4 beds 3 baths2,428 sq. ft.
4119 St Elizabeth Drive, Kenner, LA 70065
MLS# 2524040Listed by: KELLER WILLIAMS REALTY 455-0100 $235,000Active5 beds 4 baths1,784 sq. ft.
2921 Kentucky Avenue, Kenner, LA 70065
MLS# 2524138Listed by: NEXTHOME PREMIER REALTORS $185,000Active2 beds 2 baths1,231 sq. ft.
3623 California Avenue, Kenner, LA 70065
MLS# 2522962Listed by: MS REALTY, LLC $104,500Active1 beds 1 baths850 sq. ft.
730 Village Road #C, Kenner, LA 70065
MLS# 2524057Listed by: LATTER & BLUM (LATT30) $299,000Active3 beds 2 baths1,545 sq. ft.
3009 Iowa Avenue, Kenner, LA 70065
MLS# 2532819Listed by: NOLA LIVING REALTY $395,000Active4 beds 3 baths2,815 sq. ft.
3 Monte Carlo Drive, Kenner, LA 70065
MLS# 2520111Listed by: REVE, REALTORS $224,900Active3 beds 2 baths1,700 sq. ft.
3318 Cannes Place, Kenner, LA 70065
MLS# 2523862Listed by: SR REALTY GROUP LLC $350,000Active4 beds 3 baths1,900 sq. ft.
3424 Maggiore Drive, Kenner, LA 70065
MLS# 2522749Listed by: KELLER WILLIAMS REALTY 455-0100 $95,500Active0 Acres
Lot 36 Sophia Drive, Luling, LA 70070
MLS# 2523695Listed by: UPMARKET REALTY L.L.C. $349,900Active3 beds 2 baths2,072 sq. ft.
3320 Grandwood Boulevard, Kenner, LA 70065
MLS# 2523421Listed by: KELLER WILLIAMS REALTY NEW ORLEANS $685,000Active4 beds 4 baths2,794 sq. ft.
4123 St Elizabeth Drive, Kenner, LA 70065
MLS# 2523608Listed by: KELLER WILLIAMS REALTY 455-0100 $229,000Active3 beds 2 baths1,340 sq. ft.
21 Holy Cross Place, Kenner, LA 70065
MLS# 2523315Listed by: ARMSTRONG REALTY $140,000Active2 beds 2 baths1,090 sq. ft.
724 Village Road #G, Kenner, LA 70065
MLS# 2523042Listed by: REALTY ONE GROUP IMMOBILIA $434,000Active4 beds 3 baths2,912 sq. ft.
613 Petit Berdot Drive, Kenner, LA 70065
MLS# 2510472Listed by: 1 PERCENT LISTS $54,000Active0.1 Acres
3015 Albany Street, Kenner, LA 70065
MLS# 2522925Listed by: LATTER & BLUM (LATT01) $539,000Active5 beds 4 baths3,219 sq. ft.
87 Chateau Du Lac, Kenner, LA 70065
MLS# 2522358Listed by: RE/MAX N.O. PROPERTIES $459,000Active4 beds 3 baths2,282 sq. ft.
641 Petit Berdot Drive, Kenner, LA 70065
MLS# 2522373Listed by: LATTER & BLUM (LATT18) $347,900Active3 beds 2 baths1,562 sq. ft.
7 S Catahoula Court, Kenner, LA 70065
MLS# 2522348Listed by: ATLAS REAL ESTATE COMPANY, LLC $199,000Active3 beds 2 baths1,110 sq. ft.
140 Clemson Drive, Kenner, LA 70065
MLS# 2522042Listed by: LATTER & BLUM (LATT01) $439,900Active4 beds 3 baths2,266 sq. ft.
3443 Roosevelt Boulevard, Kenner, LA 70065
MLS# 2522030Listed by: APPLETREE REALTY, LLC $285,000Active3 beds 2 baths1,478 sq. ft.
4209 Arizona Avenue, Kenner, LA 70065
MLS# 2521928Listed by: REAL ESTATE NETWORK $273,900Active0 Acres
Lot 14 Dogwood Drive, Kenner, LA 70065
MLS# 2521680Listed by: IRON HORSE LAND COMPANY $450,000Active8 beds 8 baths3,872 sq. ft.
308 Duke Drive, Kenner, LA 70065
MLS# 2521454Listed by: ZHANKA REALTY LLC $350,000Pending4 beds 2 baths2,400 sq. ft.
63 Nassau Avenue, Kenner, LA 70065
MLS# 2025017036Listed by: COMPASS - PERKINS $130,000Active2 beds 2 baths1,044 sq. ft.
4101 Delaware Avenue #14, Kenner, LA 70065
MLS# 2521489Listed by: WURTH REAL ESTATE SERVICES $315,000Pending6 beds 3 baths2,548 sq. ft.
1108 Minden Avenue, Kenner, LA 70062
MLS# 2521200Listed by: KELLER WILLIAMS REALTY 455-0100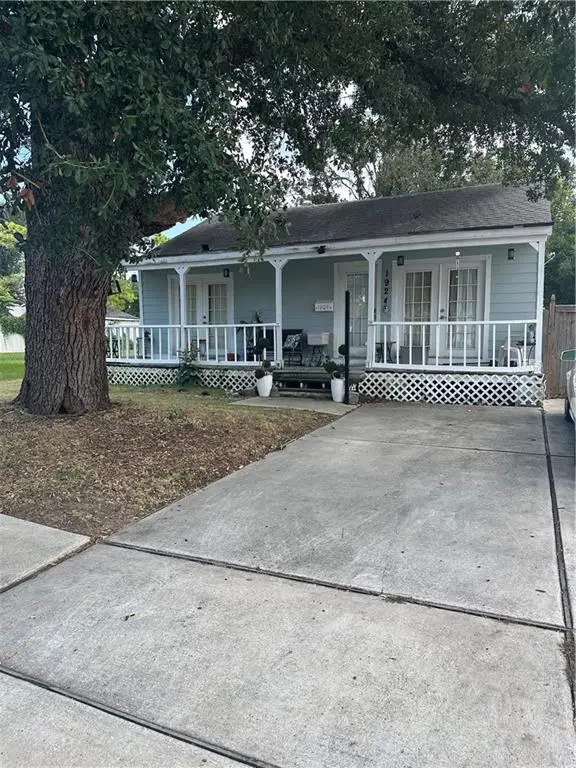 $245,000Active3 beds 2 baths1,445 sq. ft.
1924 Iowa Avenue, Kenner, LA 70062
MLS# 2521298Listed by: REALTY EXECUTIVES SELA $150,000Active2 beds 1 baths916 sq. ft.
3925 Delaware Avenue, Kenner, LA 70065
MLS# 2521137Listed by: KELLER WILLIAMS REALTY 455-0100 $430,000Active4 beds 2 baths2,350 sq. ft.
59 Yellowstone Street, Kenner, LA 70065
MLS# 2521085Listed by: HOSPITALITY REALTY $230,000Active3 beds 1 baths1,001 sq. ft.
2217 Kansas Avenue, Kenner, LA 70062
MLS# 2519509Listed by: GALIANO REALTY $239,000Active3 beds 2 baths1,300 sq. ft.
4245 E Loyola Drive, Kenner, LA 70065
MLS# 2520409Listed by: WATERMARK REALTY, LLC $349,000Active0.97 Acres
3rd Street, Kenner, LA 70062
MLS# 2520222Listed by: KELLER WILLIAMS REALTY SERVICES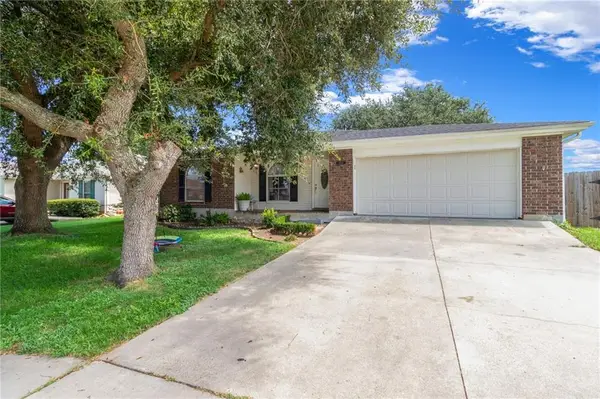 $269,999Active3 beds 2 baths1,500 sq. ft.
3304 Galan Drive, Kenner, LA 70065
MLS# 2520181Listed by: AT HOME REALTY GROUP $260,000Active4 beds 2 baths1,208 sq. ft.
701 Ronson Drive, Kenner, LA 70065
MLS# 2517910Listed by: REVE, REALTORS $119,000Active0 Acres
Lot39-A 18 Th Street, Kenner, LA 70062
MLS# 2519570Listed by: THE AGENCY OF M. GRASS GROUP, LLC $240,000Active3 beds 2 baths1,440 sq. ft.
218 Holy Cross Place, Kenner, LA 70065
MLS# 2518923Listed by: UNITED REAL ESTATE PARTNERS LLC $189,000Active0 Acres
N St. Blase Drive, Kenner, LA 70065
MLS# 2519932Listed by: TAG REALTY LLC $347,000Active0 Acres
W St. Ann Drive, Kenner, LA 70065
MLS# 2519937Listed by: TAG REALTY LLC $237,000Active0 Acres
W St. Ann Drive, Kenner, LA 70065
MLS# 2519938Listed by: TAG REALTY LLC $205,000Active0 Acres
W St. Ann Drive, Kenner, LA 70065
MLS# 2519940Listed by: TAG REALTY LLC $210,000Active0 Acres
W St. Ann Drive, Kenner, LA 70065
MLS# 2519942Listed by: TAG REALTY LLC $183,000Active0 Acres
N St. Blase Drive, Kenner, LA 70065
MLS# 2519923Listed by: TAG REALTY LLC $124,900Active2 beds 2 baths1,446 sq. ft.
1500 W Esplanade Avenue #43F, Kenner, LA 70065
MLS# 2519899Listed by: AMANDA MILLER REALTY, LLC $180,000Active0 Acres
W St. Ann Drive, Kenner, LA 70065
MLS# 2519907Listed by: TAG REALTY LLC $181,000Active0 Acres
N St. Blase Drive, Kenner, LA 70065
MLS# 2519694Listed by: TAG REALTY LLC $154,000Active0 Acres
W St. Ann Drive, Kenner, LA 70065
MLS# 2519890Listed by: TAG REALTY LLC $154,000Active0 Acres
W St. Ann Drive, Kenner, LA 70065
MLS# 2519903Listed by: TAG REALTY LLC $299,000Active3 beds 2 baths1,732 sq. ft.
48 Lucaya Drive, Kenner, LA 70065
MLS# 2519330Listed by: LANASA REALTY, INC $132,000Active0 Acres
St Elizabeth Drive, Kenner, LA 70065
MLS# 2519377Listed by: RE/MAX LIVING $132,000Active0 Acres
St. Elizabeth Drive, Kenner, LA 70065
MLS# 2519381Listed by: RE/MAX LIVING $174,988Active0 Acres
S St. Ann Drive, Kenner, LA 70065
MLS# 2519384Listed by: RE/MAX LIVING $174,988Active0 Acres
S. St Ann Drive, Kenner, LA 70065
MLS# 2519385Listed by: RE/MAX LIVING $174,988Active0 Acres
S. St. Ann Drive, Kenner, LA 70065
MLS# 2519386Listed by: RE/MAX LIVING $174,834Active0 Acres
S. St Ann Drive, Kenner, LA 70065
MLS# 2519387Listed by: RE/MAX LIVING $168,388Active0 Acres
S. St Ann Drive, Kenner, LA 70065
MLS# 2519388Listed by: RE/MAX LIVING $147,708Active0 Acres
S. St Ann Drive, Kenner, LA 70065
MLS# 2519389Listed by: RE/MAX LIVING $215,182Active0 Acres
W St. Ann Drive, Kenner, LA 70065
MLS# 2519493Listed by: RE/MAX LIVING $220,176Active0 Acres
W St. Ann Drive, Kenner, LA 70065
MLS# 2519496Listed by: RE/MAX LIVING $238,436Active0 Acres
W St. Ann Drive, Kenner, LA 70065
MLS# 2519538Listed by: RE/MAX LIVING- $396,396Active0 Acres
W St. Ann Drive, Kenner, LA 70065
MLS# 2519540Listed by: RE/MAX LIVING 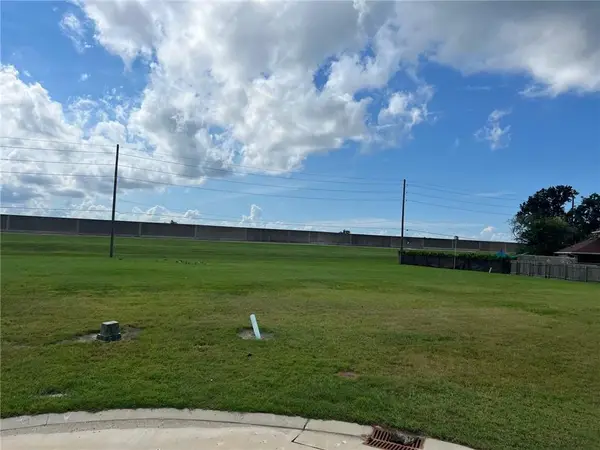 $176,858Active0 Acres
W St. Ann Drive, Kenner, LA 70065
MLS# 2519545Listed by: RE/MAX LIVING $119,000Active0 Acres
Lot39-A 18 Th Street, Kenner, LA 70062
MLS# 2519570Listed by: THE AGENCY OF M. GRASS GROUP, LLC $765,000Active4 beds 6 baths5,210 sq. ft.
72 Chateau Magdelaine Drive, Kenner, LA 70065
MLS# 2518799Listed by: LATTER & BLUM (LATT01) $148,000Active2 beds 2 baths1,020 sq. ft.
221 Avant Garde Circle #221, Kenner, LA 70065
MLS# 2517939Listed by: RE/MAX LIVING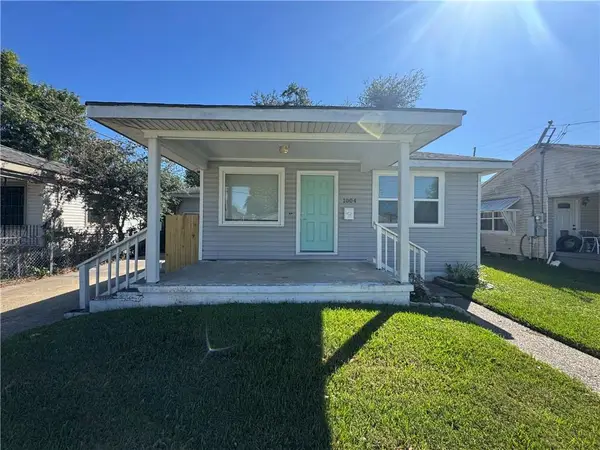 $195,000Active2 beds 1 baths800 sq. ft.
1004 Taylor Street, Kenner, LA 70062
MLS# 2518189Listed by: THE AGENCY OF M. GRASS GROUP, LLC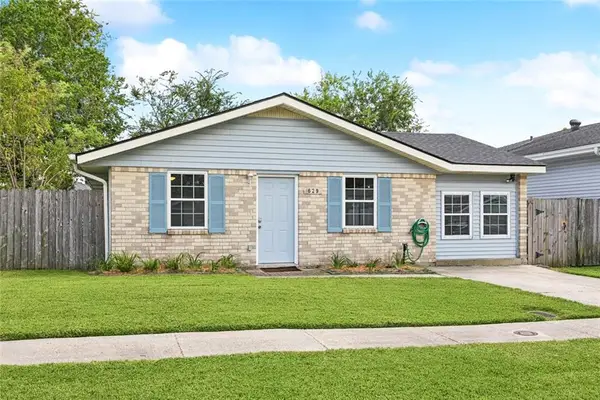 $199,000Active3 beds 1 baths1,189 sq. ft.
629 Sessions Lane, Kenner, LA 70065
MLS# 2518083Listed by: REALTY ONE GROUP IMMOBILIA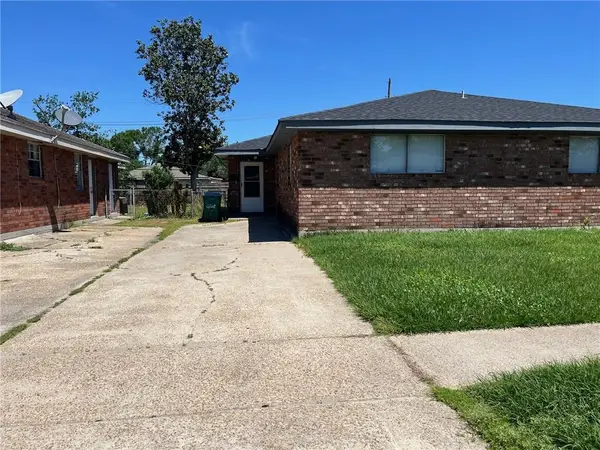 $315,000Active5 beds 3 baths2,460 sq. ft.
228-230 Duke Drive, Kenner, LA 70065
MLS# 2517978Listed by: LATTER & BLUM (LATT30) $309,000Active5 beds 3 baths2,425 sq. ft.
2705-07 Albany Street, Kenner, LA 70062
MLS# 2517990Listed by: LATTER & BLUM (LATT30) $309,000Active5 beds 3 baths2,425 sq. ft.
832-34 27th Street, Kenner, LA 70062
MLS# 2518018Listed by: LATTER & BLUM (LATT30) $315,000Active5 beds 3 baths2,460 sq. ft.
232-234 Duke Drive, Kenner, LA 70065
MLS# 2518042Listed by: LATTER & BLUM (LATT30) $584,900Active3 beds 3 baths2,023 sq. ft.
54 Palmetto, Kenner, LA 70065
MLS# 2517088Listed by: LATTER & BLUM (LATT10)- $42,999Active0.11 Acres
301 Providence Lane, Kenner, LA 70062
MLS# 2517280Listed by: GULF SOUTH INTERNATIONAL, REALTORS, LLC  $256,000Active3 beds 2 baths1,335 sq. ft.
1521 31st Street, Kenner, LA 70065
MLS# 2516476Listed by: BERKSHIRE HATHAWAY HOMESERVICES PREFERRED, REALTOR $209,000Active3 beds 2 baths1,405 sq. ft.
3620 Arizona Avenue, Kenner, LA 70065
MLS# 2521548Listed by: NOLA LIVING REALTY $390,000Active5 beds 4 baths3,484 sq. ft.
14 Rue Dijon, Kenner, LA 70065
MLS# 2516848Listed by: SRSA RESIDENTIAL, INC. $310,000Active3 beds 2 baths1,800 sq. ft.
3124 Utah Street, Kenner, LA 70065
MLS# 2516843Listed by: KELLER WILLIAMS REALTY 504-207-2007 $1,200,000Active18 beds 9 baths6,572 sq. ft.
2222 Florida Avenue, Kenner, LA 70062
MLS# 2515425Listed by: AMANDA MILLER REALTY, LLC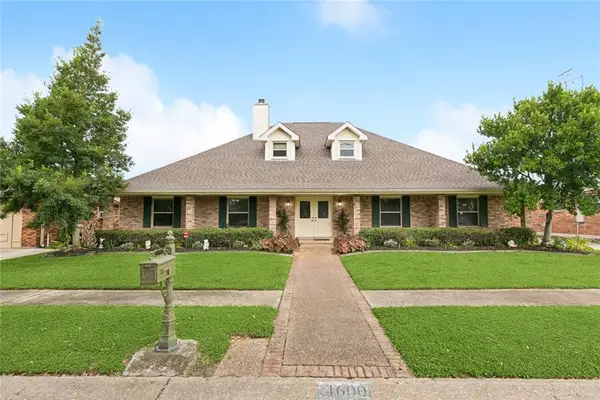 $595,000Active4 beds 4 baths3,993 sq. ft.
4600 Janice Avenue, Metairie, LA 70003
MLS# 2514372Listed by: KELLER WILLIAMS REALTY 455-0100 $405,999Active4 beds 3 baths2,184 sq. ft.
1209 Moisant Street, Kenner, LA 70062
MLS# 2516451Listed by: KELLER WILLIAMS REALTY 455-0100 $263,499Active4 beds 3 baths2,018 sq. ft.
10 Maurepas Avenue, Kenner, LA 70065
MLS# 2516132Listed by: LATTER & BLUM (LATT07) $110,000Active0 Acres
LOTS 1-3 Rousseau Street, Kenner, LA 70062
MLS# 2514811Listed by: BERKSHIRE HATHAWAY HOMESERVICES PREFERRED, REALTOR $399,900Active4 beds 3 baths2,250 sq. ft.
4129 Montrachet Drive, Kenner, LA 70065
MLS# 2516094Listed by: BILAL A. ZUGHAYER $185,000Active2 beds 2 baths1,265 sq. ft.
3911 Connecticut Avenue, Kenner, LA 70065
MLS# 2516053Listed by: STUBBS REAL ESTATE PROFESSIONALS $350,000Active3 beds 2 baths1,750 sq. ft.
3146 Utah Street, Kenner, LA 70065
MLS# 2515786Listed by: KELLER WILLIAMS REALTY NEW ORLEANS $150,000Active4 beds 2 baths1,174 sq. ft.
3118 Albany Street, Kenner, LA 70065
MLS# 2515152Listed by: GALIANO REALTY $118,500Active2 beds 2 baths1,432 sq. ft.
1500 W Esplanade Avenue #42B, Kenner, LA 70065
MLS# 2514489Listed by: UPMARKET REALTY L.L.C. $245,900Active3 beds 2 baths1,472 sq. ft.
3244 Continental Drive, Kenner, LA 70065
MLS# 2514859Listed by: CBTEC METAIRIE $345,000Active3 beds 2 baths1,630 sq. ft.
3013 Kentucky Avenue, Kenner, LA 70065
MLS# 2514145Listed by: BEST RATE REALTY, LLC $414,000Active4 beds 3 baths2,414 sq. ft.
3603 Ole Miss Drive, Kenner, LA 70065
MLS# 2513865Listed by: MIRAMBELL REALTY $269,000Active3 beds 2 baths1,800 sq. ft.
3608 E Louisiana State Drive, Kenner, LA 70065
MLS# 2513666Listed by: LATTER & BLUM (LATT01) $374,000Active4 beds 3 baths1,900 sq. ft.
1512 31 Street, Kenner, LA 70065
MLS# 2513433Listed by: REALTY ONE GROUP IMMOBILIA $359,900Active3 beds 2 baths1,525 sq. ft.
4237 California Avenue, Kenner, LA 70065
MLS# 2528682Listed by: NOLA LIVING REALTY $249,000Active4 beds 2 baths1,910 sq. ft.
440 Holy Cross Place, Kenner, LA 70065
MLS# 2025013797Listed by: COVINGTON & ASSOCIATES REAL ESTATE, LLC $450,000Active3 beds 2 baths2,147 sq. ft.
114 Gelpi Avenue, Kenner, LA 70065
MLS# 2511747Listed by: BORROUSO REALTY $319,000Active3 beds 2 baths1,755 sq. ft.
3220 Texas Avenue, Kenner, LA 70065
MLS# 2513210Listed by: WATERMARK REALTY, LLC $495,000Active4 beds 4 baths3,000 sq. ft.
509 Carmenere Drive, Kenner, LA 70065
MLS# 2512836Listed by: RIVERSIDE REALTY, INC.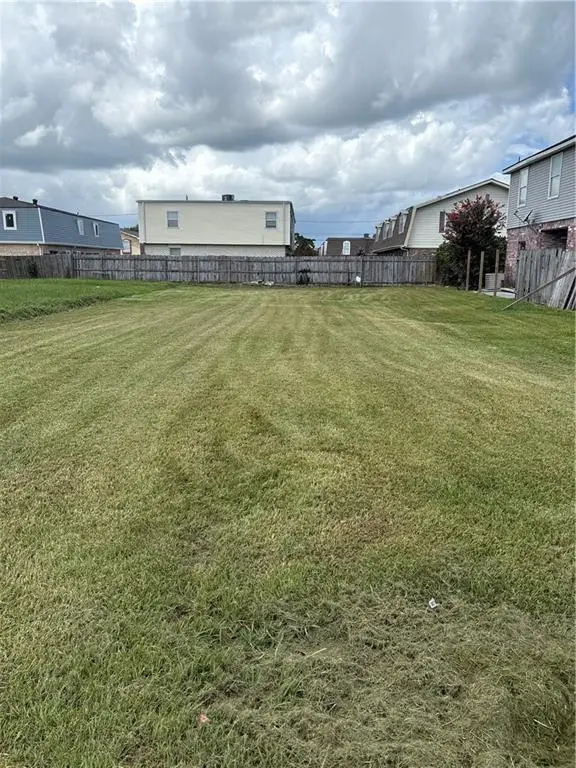 $110,000Active0.07 Acres
LOTS 38 & 39 Florida Avenue, Kenner, LA 70065
MLS# 2512111Listed by: UNITED REAL ESTATE PARTNERS LLC $179,000Active3 beds 2 baths1,568 sq. ft.
937 Ronson Avenue, Kenner, LA 70065
MLS# 2510018Listed by: SISSY WOOD REALTORS, LLC $399,000Active4 beds 3 baths2,974 sq. ft.
3349 Cannes Place, Kenner, LA 70065
MLS# 2511171Listed by: LA REAL ESTATE INVESTMENTS, INC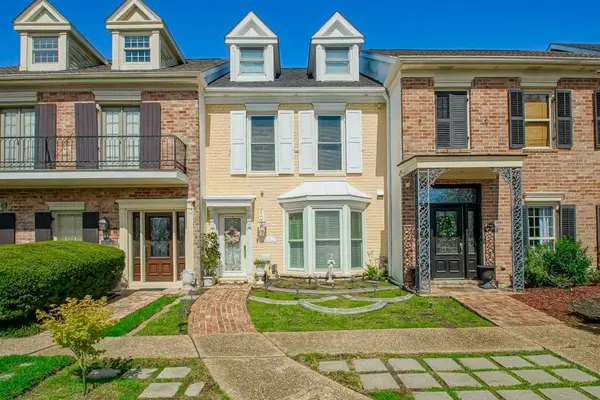 $365,000Active2 beds 3 baths2,120 sq. ft.
11 Rue Saint Louis Avenue, Kenner, LA 70065
MLS# 2511069Listed by: HOSPITALITY REALTY $198,000Active2 beds 2 baths1,377 sq. ft.
705 Gerry Drive, Kenner, LA 70062
MLS# 2508960Listed by: LATTER & BLUM (LATT01) $305,000Active0 Acres
Louisiana Trace Boulevard, Kenner, LA 70065
MLS# 2510333Listed by: PAUL GILMORE & ASSOCIATES, INC. $259,000Active4 beds 2 baths1,736 sq. ft.
3716 W Louisiana Drive, Kenner, LA 70065
MLS# 2509930Listed by: HOMESMART REALTY SOUTH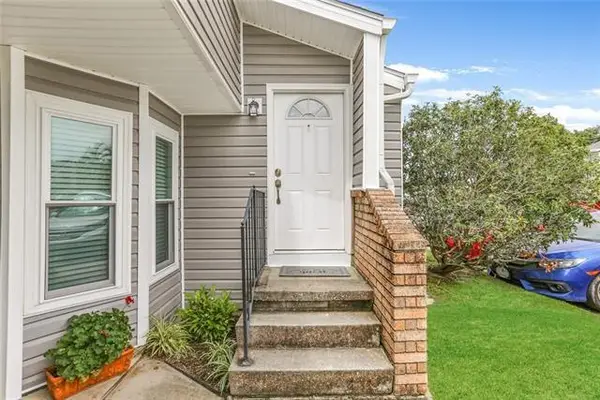 $150,000Active2 beds 2 baths1,150 sq. ft.
36 Avant Garde Circle #36, Kenner, LA 70065
MLS# 2509771Listed by: PINTAT REALTY LLC $65,000Active0.11 Acres
908 Williams Boulevard, Kenner, LA 70062
MLS# 2509835Listed by: REVE, REALTORS $699,000Active0 Acres
Lot 226 Krantz Court, Kenner, LA 70065
MLS# 2509779Listed by: KELLER WILLIAMS REALTY 455-0100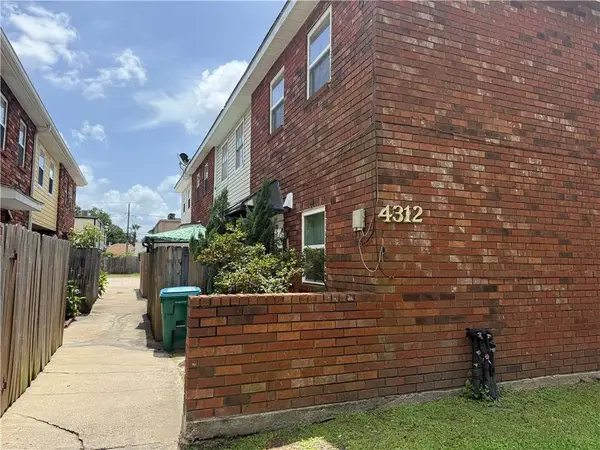 $125,000Active2 beds 2 baths1,100 sq. ft.
4312 Georgia Avenue #A, Kenner, LA 70065
MLS# 2509798Listed by: KELLER WILLIAMS REALTY 504-207-2007 $199,000Active3 beds 2 baths1,741 sq. ft.
1240 Hudson Street, Kenner, LA 70062
MLS# 2506249Listed by: REMAX ALLIANCE $270,000Active3 beds 2 baths1,345 sq. ft.
500 Vassar Court, Kenner, LA 70065
MLS# 2509210Listed by: NOLA LIVING REALTY $150,000Active1 beds 2 baths1,210 sq. ft.
4135 Loire Drive #B, Kenner, LA 70065
MLS# 2507948Listed by: PELICAN REALTY OF LOUISIANA, LLC $2,799,000Active4 beds 5 baths5,323 sq. ft.
24 Royal Palm Drive, Kenner, LA 70065
MLS# 2523361Listed by: NOLA LIVING REALTY $365,000Active3 beds 2 baths1,725 sq. ft.
1913 Kansas Avenue, Kenner, LA 70062
MLS# 2523362Listed by: NOLA LIVING REALTY $173,000Active3 beds 2 baths1,123 sq. ft.
3289 Continental Drive, Kenner, LA 70065
MLS# 2508662Listed by: HOSPITALITY REALTY $340,000Active3 beds 2 baths2,012 sq. ft.
57 Driftwood Boulevard, Kenner, LA 70065
MLS# 2508472Listed by: INNOVATION REALTY $489,000Active4 beds 3 baths2,940 sq. ft.
14 Platt Street, Kenner, LA 70065
MLS# 2508270Listed by: KEY REAL ESTATE OF LA LLC $90,000Active0 Acres
2100 Kansas Avenue, Kenner, LA 70062
MLS# 2507868Listed by: KELLER WILLIAMS REALTY 455-0100 $265,000Active3 beds 2 baths1,770 sq. ft.
333 Bertolino Drive, Kenner, LA 70065
MLS# 2505719Listed by: KELLER WILLIAMS REALTY 455-0100 $2,770,000Active4 beds 7 baths5,048 sq. ft.
21 Royal Palm Drive, Kenner, LA 70065
MLS# 2507334Listed by: BURK BROKERAGE, LLC $100,000Active0.14 Acres
1919 Idaho Avenue, Kenner, LA 70062
MLS# 2508592Listed by: REVE, REALTORS $399,000Active5 beds 3 baths2,525 sq. ft.
124 W Esplanade Avenue, Kenner, LA 70065
MLS# 2506633Listed by: MIRAMBELL REALTY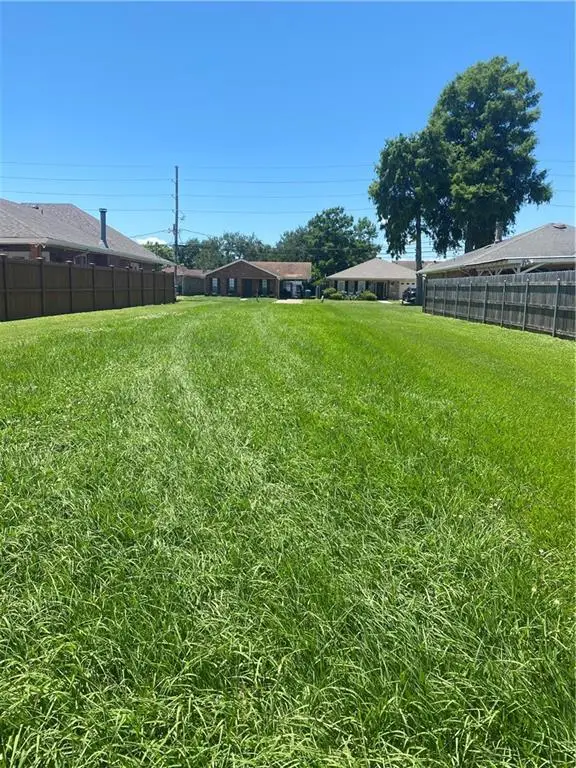 $195,000Active0.18 Acres
Lot 207 David Drive, Kenner, LA 70065
MLS# 2505948Listed by: RE/MAX LIVING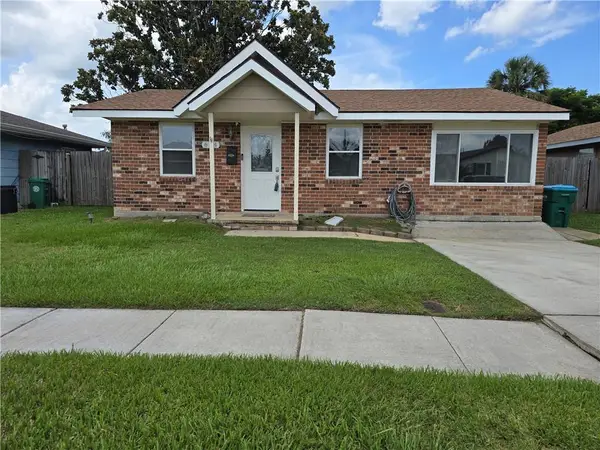 $220,000Active3 beds 2 baths1,200 sq. ft.
624 Vanderbilt Lane, Kenner, LA 70065
MLS# 2505817Listed by: UNITED BROKERS OF LOUISIANA,LLC $160,000Active2 beds 2 baths1,100 sq. ft.
54 Avant Garde Circle #54, Kenner, LA 70065
MLS# 2505935Listed by: NOLA LIVING REALTY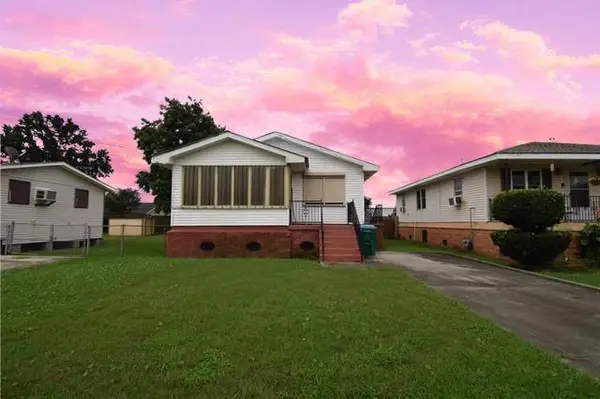 $125,000Active2 beds 1 baths910 sq. ft.
1505 31st Street, Kenner, LA 70065
MLS# 2505115Listed by: CENTURY 21 J. CARTER & COMPANY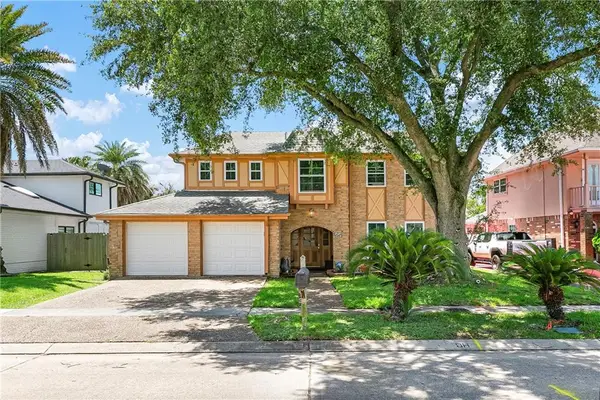 $459,000Active4 beds 3 baths2,800 sq. ft.
65 Monterrey Drive, Kenner, LA 70065
MLS# 2503735Listed by: THE MCENERY COMPANY $449,000Active5 beds 4 baths3,389 sq. ft.
3122 Ohio St. Street, Kenner, LA 70065
MLS# 2503508Listed by: INNOVATION REALTY $275,000Active3 beds 2 baths1,850 sq. ft.
4300 Idaho Avenue, Kenner, LA 70065
MLS# 2502805Listed by: NOLA LIVING REALTY $189,900Active3 beds 1 baths1,150 sq. ft.
2228 Kentucky Avenue, Kenner, LA 70062
MLS# 2502889Listed by: BEST RATE REALTY, LLC $159,900Active2 beds 2 baths1,100 sq. ft.
68 Avant Garde Circle #68, Kenner, LA 70065
MLS# 2519804Listed by: HOMESMART REALTY SOUTH $209,000Active3 beds 2 baths1,240 sq. ft.
3278 Glen Eagle Lane, Kenner, LA 70065
MLS# 2501352Listed by: AT HOME REALTY GROUP $2,452,500Pending545 Acres
0 Hwy 3256 (i-10 Service) Road, Iowa, LA
MLS# SWL25002732Listed by: CENTURY 21 BONO REALTY $995,000Active5 beds 5 baths7,050 sq. ft.
28 Mesa Street, Kenner, LA 70065
MLS# 2530439Listed by: THE W GROUP REAL ESTATE LLC $250,000Active5 beds 3 baths2,391 sq. ft.
3503 E Louisiana State Drive Drive, Kenner, LA 70065
MLS# 2531331Listed by: COLDWELL BANKER TEC MAGAZINE $175,000Active3 beds 3 baths1,747 sq. ft.
1500 W Esplanade Avenue #22B, Kenner, LA 70065
MLS# 2499607Listed by: RE/MAX LIVING- New
 $79,000Active0 Acres
2015 Kansas Avenue, Kenner, LA 70062
MLS# 2533001Listed by: KELLER WILLIAMS REALTY 455-0100  $230,000Active3 beds 2 baths1,375 sq. ft.
3701 Delaware Avenue, Kenner, LA 70065
MLS# 2495808Listed by: NOLA LIVING REALTY $122,000Active2 beds 2 baths1,432 sq. ft.
1500 Esplanade Avenue #12 D, Kenner, LA 70065
MLS# 2497821Listed by: JW PROPERTY SERVICES, LLC $110,000Active2 beds 2 baths1,144 sq. ft.
185 Avant Garde Circle #185, Kenner, LA 70065
MLS# 2497570Listed by: AUDUBON REALTY, LLC $279,000Active3 beds 2 baths1,523 sq. ft.
1609 Taylor Street, Kenner, LA 70062
MLS# 2497556Listed by: PROPERTIES UNLIMITED REALTY LLC $445,500Active3 beds 2 baths1,903 sq. ft.
1701 Roosevelt Boulevard, Kenner, LA 70062
MLS# 2496764Listed by: NOLA LIVING REALTY- Open Sun, 1 to 3pm
 $530,000Active6 beds 3 baths3,370 sq. ft.
105 Chateau Latour Drive, Kenner, LA 70065
MLS# 2517130Listed by: LATTER & BLUM (LATT01) 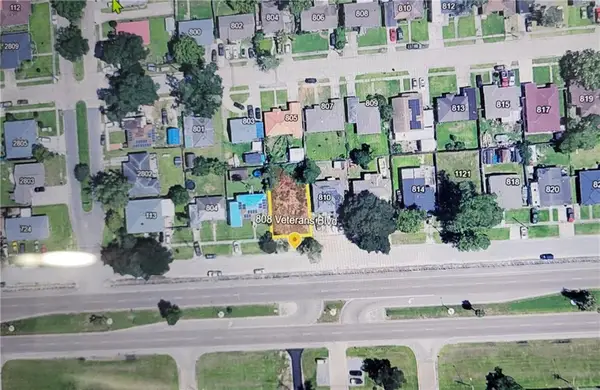 $34,000Active0.13 Acres
808 Veterans Boulevard, Kenner, LA 70062
MLS# 2495164Listed by: KELLER WILLIAMS REALTY SERVICES $85,000Active0.16 Acres
Lot 25, 26, 27 Augusta Street, Kenner, LA 70065
MLS# 2494228Listed by: KELLER WILLIAMS NOLA NORTHLAKE $175,000Active0 Acres
N St. Blase Drive, Kenner, LA 70065
MLS# 2519916Listed by: TAG REALTY LLC $999,000Active4 beds 3 baths2,650 sq. ft.
76 Palmetto, Kenner, LA 70065
MLS# 2491721Listed by: EPIQUE REALTY $89,000Active0.14 Acres
2011 Idaho Avenue, Kenner, LA 70062
MLS# 2492452Listed by: RE/MAX N.O. PROPERTIES $379,000Active3 beds 2 baths1,503 sq. ft.
1906 Kentucky Avenue, Kenner, LA 70062
MLS# 2529360Listed by: NOLA LIVING REALTY $140,000Active3 beds 3 baths1,747 sq. ft.
1500 W Esplanade Avenue #1/A, Kenner, LA 70065
MLS# 2490368Listed by: NOLA LIVING REALTY $690,000Active0 Acres
300 Veterans Memorial Boulevard, Kenner, LA 70062
MLS# 2489843Listed by: PAUL GILMORE & ASSOCIATES, INC. $2,450,000Active5 beds 7 baths10,711 sq. ft.
6 Oakland Road, Kenner, LA 70065
MLS# 2527212Listed by: NOLA LIVING REALTY $125,000Active2 beds 2 baths1,201 sq. ft.
901 Joe Yenni Boulevard #B4, Kenner, LA 70065
MLS# 2487422Listed by: CENTURY 21 J. CARTER & COMPANY $180,000Active3 beds 2 baths916 sq. ft.
3005 Jasper Street, Kenner, LA 70065
MLS# 2519433Listed by: THE PELLERIN GROUP NOLA LLC $245,000Active0 Acres
Lot 26 Dogwood Drive, Kenner, LA 70065
MLS# 2517530Listed by: NOLA LIVING REALTY $255,000Active0 Acres
Lot134 Dogwood Drive, Kenner, LA 70065
MLS# 2515261Listed by: NOLA'S BEST REALTY, LLC $72,000Active0.17 Acres
2209 26th Street, Kenner, LA 70062
MLS# 2516463Listed by: KELLER WILLIAMS REALTY NEW ORLEANS $424,888Active4 beds 2 baths2,770 sq. ft.
3605 W Grandlake Boulevard, Kenner, LA 70065
MLS# 2517441Listed by: NOLA LIVING REALTY $140,000Active2 beds 1 baths700 sq. ft.
3313 California Avenue, Kenner, LA 70065
MLS# 2513634Listed by: UNITED REAL ESTATE PARTNERS LLC $140,000Active2 beds 2 baths1,100 sq. ft.
107 Avant Garde Circle #avant, Kenner, LA 70065
MLS# 2485365Listed by: SHARON D. KOCHERA $499,000Active-- beds -- baths4,230 sq. ft.
3549 Martinique Avenue, Kenner, LA 70065
MLS# 2025001440Listed by: GOLDENX REALTY $340,000Active3 beds 3 baths1,785 sq. ft.
5512 David Drive, Kenner, LA 70065
MLS# 2482506Listed by: LATTER & BLUM (LATT28) $258,000Active3 beds 2 baths1,611 sq. ft.
3 S Lafourche Court, Kenner, LA 70065
MLS# 2481679Listed by: UNITED REAL ESTATE PARTNERS LLC $483,000Active8 beds 4 baths3,353 sq. ft.
300 Duke Drive, Kenner, LA 70065
MLS# 2480816Listed by: REALTY ONE GROUP IMMOBILIA $599,000Active4 beds 4 baths3,643 sq. ft.
5 Sago, Kenner, LA 70065
MLS# 2492445Listed by: WURTH REAL ESTATE SERVICES $129,000Active2 beds 2 baths1,300 sq. ft.
1500 W Esplanade Avenue #39F, Kenner, LA 70065
MLS# 2472948Listed by: LATTER & BLUM (LATT01) $336,900Active2 beds 3 baths2,112 sq. ft.
2 Rue St Louis Street, Kenner, LA 70065
MLS# 2457333Listed by: COMPASS METRO (LATT01) $220,000Active3 beds 2 baths1,575 sq. ft.
3621 W Loyola Drive, Kenner, LA 70065
MLS# 2440620Listed by: LATTER & BLUM (LATT01) $195,000Active3 beds 1 baths1,100 sq. ft.
2216 Iowa Avenue, Kenner, LA 70062
MLS# 2467977Listed by: REALTY ONE GROUP IMMOBILIA $250,000Active3 beds 2 baths1,695 sq. ft.
3652 W Loyola Drive, Kenner, LA 70065
MLS# 2468731Listed by: LATTER & BLUM (LATT01) $240,000Active4 beds 2 baths1,574 sq. ft.
3629 Ole Miss Drive, Kenner, LA 70065
MLS# 2513637Listed by: KELLER WILLIAMS REALTY 455-0100 $140,000Active3 beds 2 baths1,118 sq. ft.
3509 California Avenue, Kenner, LA 70065
MLS# 2458286Listed by: UNITED REAL ESTATE PARTNERS LLC $59,000Active0.11 Acres
Lexington Avenue, Kenner, LA 70065
MLS# 2531337Listed by: MILTON REALTY LLC $2,899,000Active3.26 Acres
851 Airline Drive, Kenner, LA 70062
MLS# 2451847Listed by: PAUL GILMORE & ASSOCIATES, INC. $135,000Active0 Acres
2410-12 Reverend Richard Wilson Drive, Kenner, LA 70062
MLS# 2468944Listed by: ALL AROUND REALTY, LLC $96,500Active1 beds 1 baths566 sq. ft.
1020 St Julien Drive #226, Kenner, LA 70065
MLS# 2511937Listed by: THE AGENCY OF M. GRASS GROUP, LLC $949,000Active0 Acres
LOTS 93-98 Kingston Street, Kenner, LA 70062
MLS# 2408099Listed by: GRACI REAL ESTATE & APPRAISIAL SERVICE, L.L.C. $159,900Active0 Acres
3204 Maine Avenue, Kenner, LA 70065
MLS# 2484797Listed by: WATERMARK REALTY, LLC $83,000Active0 Acres
3304 Ole Miss Drive, Kenner, LA 70065
MLS# 2426032Listed by: SOUTHERN REAL ESTATE PROFESSIONALS, LLC $125,000Active2 beds 2 baths1,100 sq. ft.
1725 Newport Place #4, Kenner, LA 70065
MLS# 2529496Listed by: ACADIAN REALTY LLC $179,000Active3 beds 2 baths1,300 sq. ft.
3911 California Avenue, Kenner, LA 70065
MLS# 2526236Listed by: KELLER WILLIAMS REALTY SERVICES $320,000Active3 beds 2 baths2,029 sq. ft.
4241 Beaune Drive, Kenner, LA 70065
MLS# 2457293Listed by: CBTEC BEAU CHENE $210,000Pending3 beds 2 baths1,265 sq. ft.
673 Sessions Lane, Kenner, LA 70065
MLS# SWL21001417Listed by: LATTER & BLUM KENNER
Local realty services provided by:CENTURY 21 Action Realty, CENTURY 21 Buelow-Miller Realty, CENTURY 21 Bessette Flavin, CENTURY 21 Delia Realty Group
Neighborhoods near Kenner, LA
Zip codes near Kenner, LA
- 70001 properties for sale
- 70002 properties for sale
- 70003 properties for sale
- 70005 properties for sale
- 70006 properties for sale
- 70031 properties for sale
- 70047 properties for sale
- 70062 properties for sale
- 70065 properties for sale
- 70079 properties for sale
- 70087 properties for sale
- 70094 properties for sale
- 70113 properties for sale
- 70115 properties for sale
- 70118 properties for sale
- 70119 properties for sale
- 70121 properties for sale
- 70123 properties for sale
- 70124 properties for sale
- 70125 properties for sale
Popular searches near Kenner, LA
- Ama properties for sale
- Avondale properties for sale
- Boutte properties for sale
- Bridge City properties for sale
- Destrehan properties for sale
- Elmwood properties for sale
- Hahnville properties for sale
- Harahan properties for sale
- Jefferson properties for sale
- Luling properties for sale
- Marrero properties for sale
- Metairie properties for sale
- Montz properties for sale
- New Sarpy properties for sale
- Norco properties for sale
- River Ridge properties for sale
- St Rose properties for sale
- Taft properties for sale
- Waggaman properties for sale
- Westwego properties for sale
©2025 Century 21 Real Estate LLC. All rights reserved. CENTURY 21®, the CENTURY 21 Logo and C21® are service marks owned by Century 21 Real Estate LLC. Century 21 Real Estate LLC fully supports the principles of the Fair Housing Act and the Equal Opportunity Act. Each office is independently owned and operated. Listing information is deemed reliable but not guaranteed accurate.
©2025 Century 21 Real Estate LLC. All rights reserved. CENTURY 21®, the CENTURY 21 Logo and C21® are service marks owned by Century 21 Real Estate LLC. Century 21 Real Estate LLC fully supports the principles of the Fair Housing Act and the Equal Opportunity Act. Each office is independently owned and operated. Listing information is deemed reliable but not guaranteed accurate.