- Auburn homes for sale
- Bryn Mawr-Skyway homes for sale
- Burien homes for sale
- Covington homes for sale
- Des Moines homes for sale
- East Renton Highlands homes for sale
- Fairwood homes for sale
- Federal Way-Auburn homes for sale
- Kent homes for sale
- Lake Holm homes for sale
- Lake Morton-Berrydale homes for sale
- Lakeland North homes for sale
- Maple Heights-Lake Desire homes for sale
- Maple Valley homes for sale
- Newcastle homes for sale
- Normandy Park homes for sale
- Renton homes for sale
- Seatac homes for sale
- Shadow Lake homes for sale
- Tukwila homes for sale
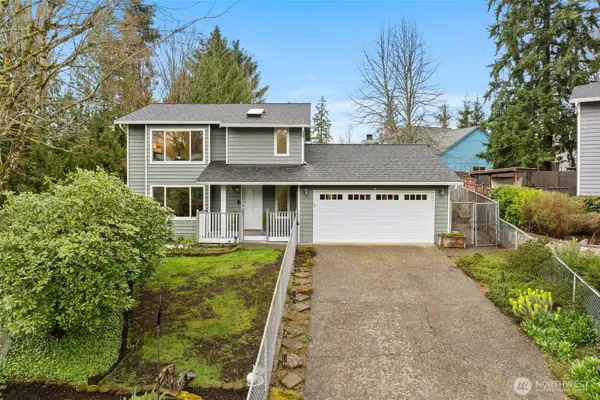
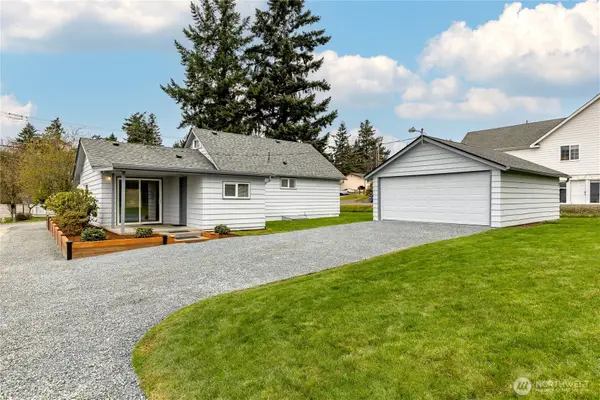
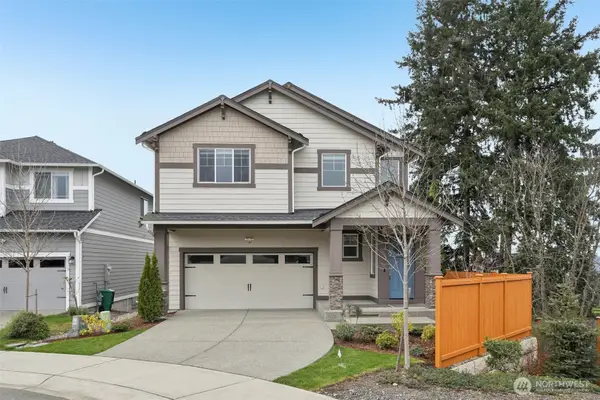
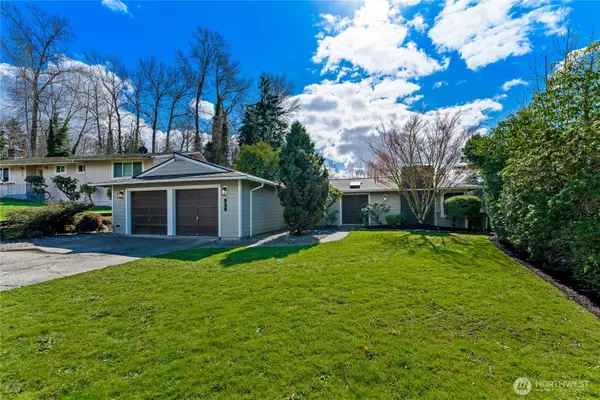
98031, WA - homes for sale
104 of 104 results displayed
- New
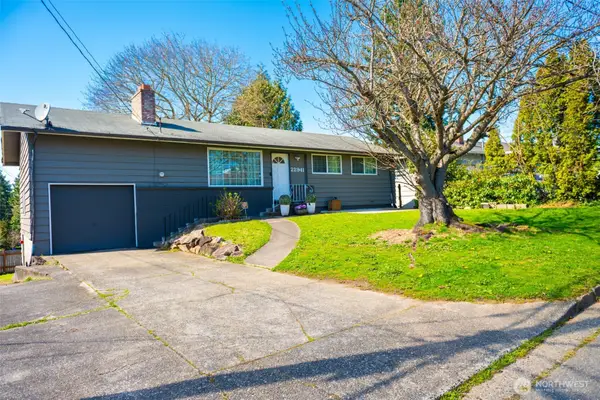 $685,000Active4 beds 2 baths2,090 sq. ft.
22941 105th Avenue Se, Kent, WA 98031
MLS# 2499053Listed by: CORDELL GROUP
- New
 $695,000Active3 beds 2 baths1,850 sq. ft.
9537 S 213th Street, Kent, WA 98031
MLS# 2497058Listed by: EXP REALTY - New
 $659,900Active3 beds 2 baths1,152 sq. ft.
12802 SE 202 Place, Kent, WA 98031
MLS# 2498651Listed by: JOHN L. SCOTT, INC. - New
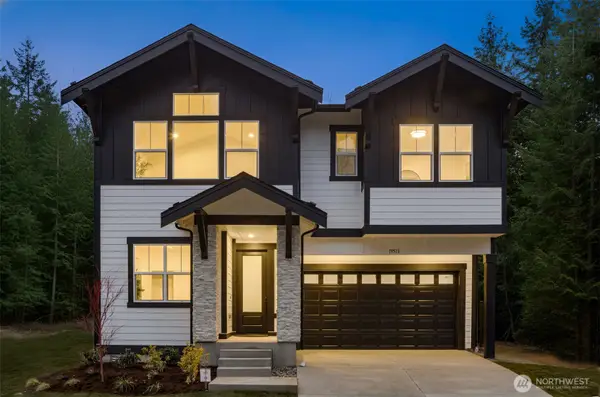 $1,159,990Active5 beds 3 baths2,920 sq. ft.
19505 118th Ave Se (homesite #9), Kent, WA 98031
MLS# 2497341Listed by: WINDERMERE REAL ESTATE/EAST - New
 $665,000Active3 beds 3 baths1,540 sq. ft.
22005 120th Place Se, Kent, WA 98031
MLS# 2497558Listed by: WINDERMERE REAL ESTATE/PSR INC - New
 $600,000Active2 beds 1 baths1,290 sq. ft.
9229 S 200th Street, Kent, WA 98031
MLS# 2496334Listed by: JOHN L. SCOTT, INC - New
 $1,150,000Active4 beds 4 baths3,374 sq. ft.
20115 98th Avenue S, Kent, WA 98031
MLS# 2490157Listed by: REDFIN - New
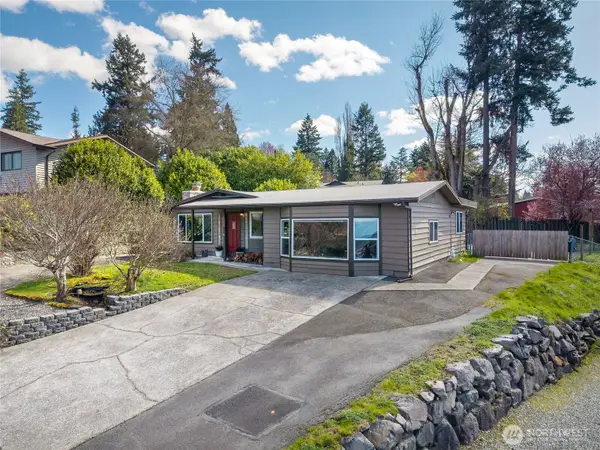
 $625,000Active3 beds 2 baths1,410 sq. ft.
925 Valley Place, Kent, WA 98031
MLS# 2497291Listed by: REAL BROKER LLC - New
 $685,000Active3 beds 3 baths1,500 sq. ft.
12324 SE 223rd Drive, Kent, WA 98031
MLS# 2493699Listed by: SPECIALTY REAL ESTATE GROUP - New
 $130,000Active2 beds 2 baths1,344 sq. ft.
11436 SE 208th Street #7, Kent, WA 98031
MLS# 2481099Listed by: EXP REALTY - New
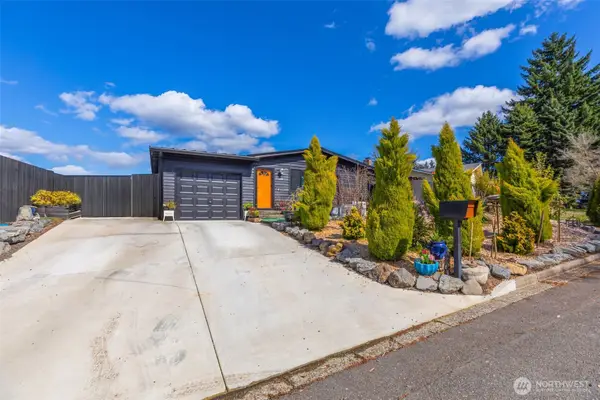
 $695,000Active4 beds 2 baths2,120 sq. ft.
751 Alvord Avenue N, Kent, WA 98031
MLS# 2495195Listed by: COLDWELL BANKER DANFORTH - New
 $732,500Active4 beds 3 baths1,910 sq. ft.
11203 SE 237th Place, Kent, WA 98031
MLS# 2492877Listed by: THE PREVIEW GROUP - New
 $1,039,990Active4 beds 3 baths2,665 sq. ft.
19411 118th Ave Se (homesite #3), Kent, WA 98031
MLS# 2494978Listed by: WINDERMERE REAL ESTATE/EAST - New
 $659,450Active3 beds 3 baths2,197 sq. ft.
12821 SE 225th Court, Kent, WA 98038
MLS# 2494295Listed by: ICON GROUP  $699,950Pending4 beds 3 baths1,750 sq. ft.
22810 126th Avenue Se, Kent, WA 98031
MLS# 2495182Listed by: BEST CHOICE REALTY LLC $210,000Pending1 beds 1 baths644 sq. ft.
10125 SE 235th Place #C306, Kent, WA 98031
MLS# 2494381Listed by: REDFIN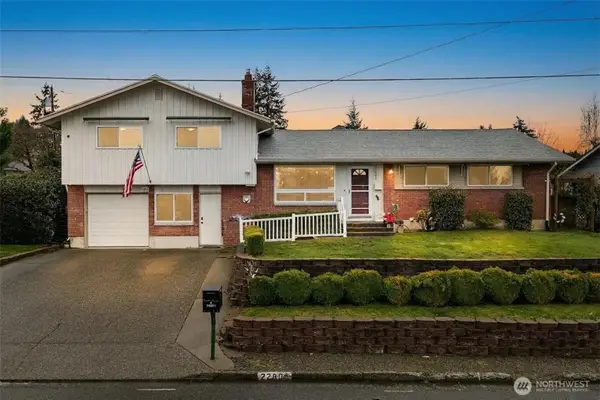 $624,900Pending4 beds 2 baths1,900 sq. ft.
22804 105th Place Se, Kent, WA 98031
MLS# 2491182Listed by: JOHN L. SCOTT, INC $669,950Active3 beds 3 baths1,668 sq. ft.
21137 131st Place Se, Kent, WA 98031
MLS# 2490834Listed by: RAINIER VALLEY REALTY $599,995Active4 beds 2 baths1,720 sq. ft.
12532 SE 232nd Street, Kent, WA 98031
MLS# 2492835Listed by: RE/MAX METRO REALTY, INC. $685,900Active3 beds 3 baths1,560 sq. ft.
12008 SE 218th Place, Kent, WA 98031
MLS# 2492254Listed by: RE/MAX INTEGRITY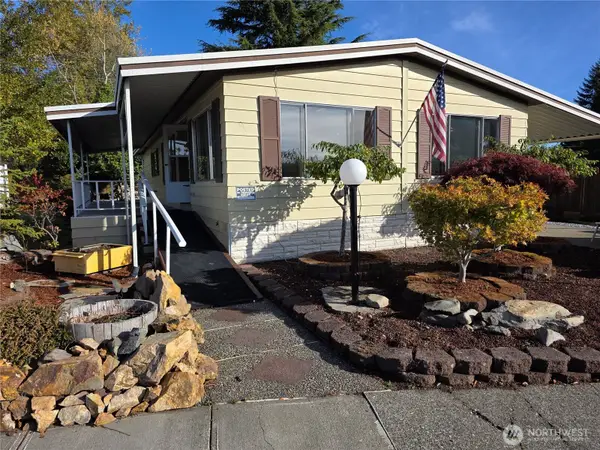 $94,950Active2 beds 2 baths1,344 sq. ft.
11436 SE 208th Street #134, Kent, WA 98031
MLS# 2492684Listed by: KELLY RIGHT RE OF SEATTLE LLC $724,999Pending4 beds 3 baths2,152 sq. ft.
11033 SE 201st Street, Kent, WA 98031
MLS# 2471593Listed by: WINDERMERE WEST METRO $725,000Active5 beds 3 baths2,080 sq. ft.
20209 106th Avenue Se, Kent, WA 98031
MLS# 2491572Listed by: SKYLINE PROPERTIES, INC. $65,000Active2 beds 1 baths896 sq. ft.
10831 SE 226th Street, Kent, WA 98031
MLS# 2489929Listed by: EXP REALTY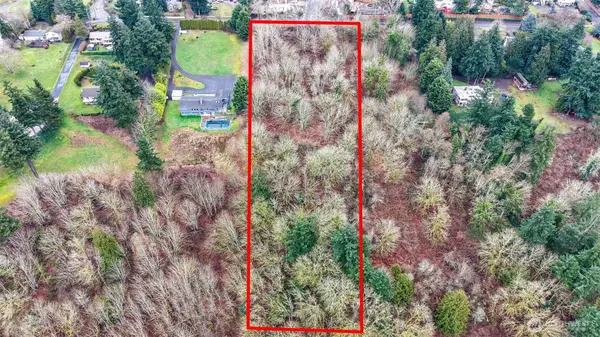 $900,000Active2.46 Acres
232 94th Avenue S, Kent, WA 98031
MLS# 2489434Listed by: RE/MAX REALTY SOUTH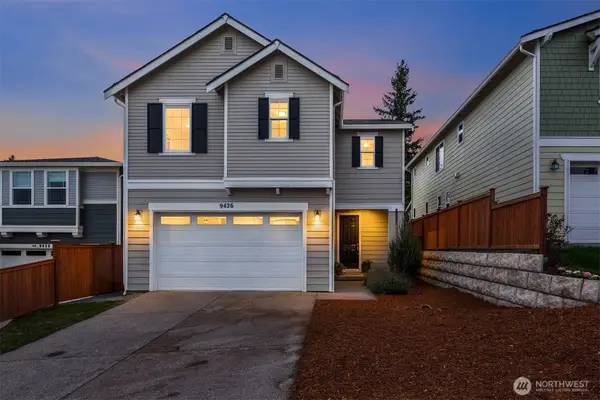 $750,000Active3 beds 3 baths1,930 sq. ft.
9426 S 237th Street, Kent, WA 98031
MLS# 2490866Listed by: COLDWELL BANKER BAIN $749,950Pending4 beds 3 baths2,160 sq. ft.
22237 131st Avenue Se, Kent, WA 98031
MLS# 2489920Listed by: JOHN L. SCOTT, INC $709,950Pending3 beds 3 baths1,620 sq. ft.
20208 90th Place S, Kent, WA 98031
MLS# 2489265Listed by: TERRAFIN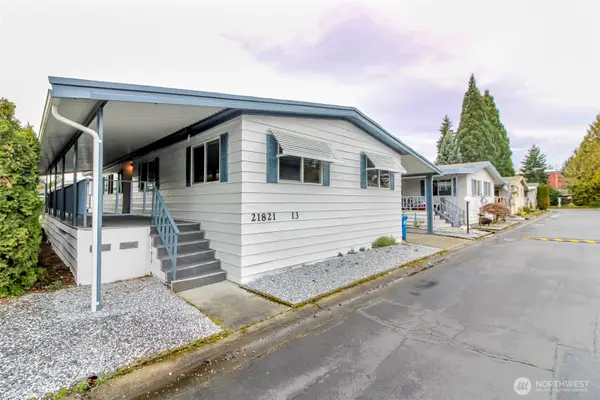 $75,000Pending3 beds 2 baths1,440 sq. ft.
21821 107th Pl Se #13, Kent, WA 98031
MLS# 2488993Listed by: KW MOUNTAINS TO SOUND REALTY $649,000Active3 beds 3 baths1,910 sq. ft.
11413 SE 219th Place, Kent, WA 98031
MLS# 2488954Listed by: REAL BROKER LLC- New
 $780,000Active4 beds 4 baths2,077 sq. ft.
11002 SE 220th Place, Kent, WA 98031
MLS# 2498893Listed by: ENGEL & VOELKERS SEATTLE DT  $125,000Active2 beds 2 baths1,488 sq. ft.
11436 SE 208th Street #152, Kent, WA 98031
MLS# 2484668Listed by: EXP REALTY $265,000Pending2 beds 1 baths936 sq. ft.
23415 101st Avenue Se #F110, Kent, WA 98031
MLS# 2483467Listed by: KW MOUNTAINS TO SOUND REALTY $849,950Pending3 beds 3 baths2,560 sq. ft.
21702 103rd Place Se, Kent, WA 98031
MLS# 2485627Listed by: KW MOUNTAINS TO SOUND REALTY $750,000Pending4 beds 3 baths2,340 sq. ft.
22116 99th Place S, Kent, WA 98031
MLS# 2487223Listed by: KELLER WILLIAMS REALTY PS $1,189,990Active-- beds -- baths2,891 sq. ft.
813 Woodford Avenue N, Kent, WA 98031
MLS# 2485315Listed by: COMPASS $735,000Active3 beds 2 baths1,300 sq. ft.
9812 S 212th St, Kent, WA 98031
MLS# 2486135Listed by: SKYLINE PROPERTIES, INC. $679,000Pending4 beds 3 baths2,173 sq. ft.
9613 S 240th Street, Kent, WA 98031
MLS# 2487629Listed by: KELLER WILLIAMS REALTY PS $785,000Pending4 beds 4 baths2,435 sq. ft.
20217 102nd Place Se, Kent, WA 98031
MLS# 2483747Listed by: WINDERMERE REAL ESTATE MIDTOWN $679,999Pending5 beds 4 baths2,970 sq. ft.
10606 Se 226th St, Kent, WA 98031
MLS# 2484525Listed by: KW MOUNTAINS TO SOUND REALTY $299,998Pending2 beds 2 baths1,024 sq. ft.
11130 SE 208th Street #G204, Kent, WA 98031
MLS# 2480949Listed by: JOHN L. SCOTT, INC $649,950Pending4 beds 2 baths1,560 sq. ft.
23615 105th Place Se, Kent, WA 98031
MLS# 2484323Listed by: ICON GROUP $124,500Active2 beds 2 baths1,152 sq. ft.
11436 SE 208th Street #136, Kent, WA 98031
MLS# 2480771Listed by: EXP REALTY $299,000Active1 beds 1 baths770 sq. ft.
11130 SE 208th Street #A104, Kent, WA 98031
MLS# 2465040Listed by: JOHN L. SCOTT, INC. $799,950Active3 beds 4 baths2,640 sq. ft.
20702 93rd Place S, Kent, WA 98031
MLS# 2481719Listed by: BETTER PROPERTIES VALLEY ASSOC $729,950Pending4 beds 3 baths1,710 sq. ft.
21228 102nd Avenue Se, Kent, WA 98031
MLS# 2483080Listed by: LYNNMAC COMMERCIAL LLC $900,000Pending4 beds 3 baths3,020 sq. ft.
9612 S 201st Place, Kent, WA 98031
MLS# 2480809Listed by: JOHN L. SCOTT, INC $698,000Active4 beds 3 baths1,880 sq. ft.
11944 SE 212th Place, Kent, WA 98031
MLS# 2480911Listed by: REDFIN $975,000Pending4 beds 3 baths3,110 sq. ft.
19205 124th Avenue Se, Kent, WA 98031
MLS# 2480801Listed by: REDFIN $54,900Active2 beds 1 baths768 sq. ft.
21809 107th Place Se, Kent, WA 98031
MLS# 2481063Listed by: WINDERMERE PROF PARTNERS $940,000Pending4 beds 3 baths3,560 sq. ft.
21819 92nd Avenue S, Kent, WA 98031
MLS# 2480407Listed by: MARKETPLACE SOTHEBY'S INTL RTY $590,000Pending4 beds 3 baths2,090 sq. ft.
9233 S 239th Street, Kent, WA 98031
MLS# 2479256Listed by: COLDWELL BANKER DANFORTH $609,000Active3 beds 2 baths1,470 sq. ft.
21622 120th Avenue Se, Kent, WA 98031
MLS# 2479741Listed by: REALTY ONE GROUP ENTERPRISE $355,000Active2 beds 2 baths1,032 sq. ft.
11130 SE 208th Street #H102, Kent, WA 98031
MLS# 2470921Listed by: MADISON AVENUE REALTY $1,048,000Active3 beds 3 baths1,880 sq. ft.
9502 S 200th Street, Kent, WA 98031
MLS# 2478341Listed by: JOHN L. SCOTT, INC $599,950Active3 beds 3 baths1,300 sq. ft.
10319 SE 228th Street, Kent, WA 98031
MLS# 2478685Listed by: TERRAFIN $695,000Pending4 beds 3 baths2,760 sq. ft.
22648 128th Avenue Se, Kent, WA 98031
MLS# 2471720Listed by: JOHN L. SCOTT, INC $619,000Active5 beds 2 baths2,020 sq. ft.
23114 110th Avenue Se, Kent, WA 98031
MLS# 2477066Listed by: KELLY RIGHT RE OF SEATTLE LLC $519,000Active3 beds 1 baths990 sq. ft.
22905 SE 106th Pl Se, Kent, WA 98031
MLS# 2473482Listed by: DOVE REALTY, INC. $290,000Active0.8 Acres
23429 94th Ave S, Kent, WA 98031
MLS# 2476426Listed by: RICHARD BECKMAN RLTY GROUP LLC $1,169,990Active4 beds 3 baths2,665 sq. ft.
19407 118th Ave Se (homesite #2), Kent, WA 98031
MLS# 2474810Listed by: WINDERMERE REAL ESTATE/EAST $899,999Active4 beds 3 baths2,558 sq. ft.
20024 90th Place S, Kent, WA 98031
MLS# 2470481Listed by: JOHN L. SCOTT, INC $779,900Active4 beds 4 baths2,580 sq. ft.
20601 93rd Place S #2, Kent, WA 98031
MLS# 2460413Listed by: JOHN L. SCOTT, INC $609,950Active4 beds 3 baths2,390 sq. ft.
707 Alvord Avenue N, Kent, WA 98031
MLS# 2462893Listed by: KELLER WILLIAMS REALTY PS $120,000Active3 beds 2 baths1,528 sq. ft.
11436 SE 208th Street #45, Kent, WA 98031
MLS# 2474924Listed by: JOHN L. SCOTT, INC $849,950Active4 beds 3 baths2,200 sq. ft.
20902 99th Place S, Kent, WA 98031
MLS# 2474550Listed by: JOHN L. SCOTT, INC. $128,000Active2 beds 2 baths1,344 sq. ft.
11436 SE 208th Street #112, Kent, WA 98031
MLS# 2471772Listed by: ENGEL & VOELKERS NORTH TACOMA $850,000Active2.96 Acres
0 SE 208th Street, Kent, WA 98031
MLS# 2472463Listed by: REAL BROKER LLC $874,950Pending5 beds 3 baths2,409 sq. ft.
20904 99th Place S, Kent, WA 98031
MLS# 2471312Listed by: JOHN L. SCOTT, INC. $869,950Active5 beds 3 baths2,330 sq. ft.
20908 99th Place S, Kent, WA 98031
MLS# 2471321Listed by: JOHN L. SCOTT, INC. $669,950Active4 beds 3 baths2,090 sq. ft.
22686 129th Place Se, Kent, WA 98031
MLS# 2470988Listed by: 2000 REAL ESTATE $599,000Active0.99 Acres
229 100th Ave S, Kent, WA 98031
MLS# 2469452Listed by: JOHN L. SCOTT, INC $389,950Active3 beds 2 baths1,195 sq. ft.
11130 SE 208th Street #M104, Kent, WA 98031
MLS# 2470028Listed by: DREAM VISION HOMES, LLC $698,000Active4 beds 3 baths2,140 sq. ft.
23504 110th Place Se, Kent, WA 98031
MLS# 2470636Listed by: SKYLINE PROPERTIES, INC. $739,999Active4 beds 3 baths1,980 sq. ft.
11114 SE 218th Place, Kent, WA 98031
MLS# 2469772Listed by: BETTER PROPERTIES KENT LLC $294,995Pending2 beds 2 baths1,100 sq. ft.
23411 102nd Avenue Se #E107, Kent, WA 98031
MLS# 2468987Listed by: SEATTLE WORKS REAL ESTATE $655,000Pending4 beds 3 baths2,130 sq. ft.
856 Stetson Ave, Kent, WA 98031
MLS# 2466878Listed by: COMPASS $99,000Active3 beds 2 baths1,792 sq. ft.
21807 107th Ave Se #28, Kent, WA 98031
MLS# 2467683Listed by: SASH REALTY $838,000Active4 beds 3 baths2,870 sq. ft.
20527 132nd Avenue Se, Kent, WA 98042
MLS# 2469097Listed by: JOHN L. SCOTT, INC $889,500Pending5 beds 4 baths2,980 sq. ft.
23107 96 Place S, Kent, WA 98031
MLS# 2465042Listed by: COLDWELL BANKER BAIN $170,000Active3 beds 2 baths1,232 sq. ft.
22111 108th Avenue Se #5, Kent, WA 98031
MLS# 2466984Listed by: KELLER WILLIAMS WEST SOUND $740,000Pending5 beds 5 baths3,380 sq. ft.
22819 126th Place Se, Kent, WA 98031
MLS# 2465590Listed by: AGENCYONE $639,999Active3 beds 3 baths2,412 sq. ft.
10217 Se 237th St, Kent, WA 98031
MLS# 2463837Listed by: JOHN L. SCOTT MUKILTEO $715,000Active4 beds 3 baths2,340 sq. ft.
22506 129th Place Se, Kent, WA 98031
MLS# 2465992Listed by: AGENCYONE $799,950Active4 beds 4 baths2,530 sq. ft.
21211 95th Court S, Kent, WA 98031
MLS# 2460928Listed by: JOHN L. SCOTT R.E. LAKE TAPPS $849,999Pending3 beds 1 baths1,980 sq. ft.
10850 SE 196th Street, Kent, WA 98031
MLS# 2454223Listed by: KW MOUNTAINS TO SOUND REALTY $770,000Pending4 beds 3 baths2,720 sq. ft.
19234 121st Place Se, Kent, WA 98031
MLS# 2465382Listed by: COMPASS $725,000Active5 beds 5 baths3,316 sq. ft.
11120 Se 234th Place, Kent, WA 98031
MLS# 2449304Listed by: JOHN L. SCOTT, INC $254,950Pending2 beds 2 baths980 sq. ft.
23850 102nd Avenue Se #C4, Kent, WA 98031
MLS# 2446295Listed by: AGENCYONE $155,000Active3 beds 2 baths1,183 sq. ft.
11143 226th Street, Kent, WA 98031
MLS# 2444115Listed by: JOHN L. SCOTT, INC $175,000Pending3 beds 2 baths1,248 sq. ft.
10921 SE 227th Place, Kent, WA 98031
MLS# 2441237Listed by: KW MOUNTAINS TO SOUND REALTY $1,140,000Active3 beds 3 baths1,930 sq. ft.
13041 SE 208th Street, Kent, WA 98031
MLS# 2425091Listed by: RE/MAX INTEGRITY $324,950Active3 beds 2 baths1,165 sq. ft.
23625 112th Avenue Se #G201, Kent, WA 98031
MLS# 2428137Listed by: EXCEL REAL ESTATE EXPERTS $285,000Active0.14 Acres
22728 101st Place Se, Kent, WA 98031
MLS# 2426265Listed by: KW LAKE WASHINGTON SO $425,000Active0.62 Acres
0 93rd Avenue S, Kent, WA 98031
MLS# 2425621Listed by: REAL BROKER LLC $149,950Active2 beds 2 baths1,420 sq. ft.
11436 SE 208th Street #153, Kent, WA 98031
MLS# 2422268Listed by: COLDWELL BANKER DANFORTH $799,000Active4 beds 3 baths1,920 sq. ft.
10900 SE 219th Place, Kent, WA 98031
MLS# 2479045Listed by: AGENCYONE $679,900Pending5 beds 3 baths2,900 sq. ft.
9525 S 221st Place, Kent, WA 98031
MLS# 2392359Listed by: LUMIN BROKERS OF WASHINGTON $949,950Pending6 beds 4 baths3,028 sq. ft.
23801 100th Avenue Se, Kent, WA 98031
MLS# 2487480Listed by: DULAY HOMES LLC $90,000Active2 beds 2 baths1,152 sq. ft.
11436 SE 208th Street #106, Kent, WA 98031
MLS# 2341564Listed by: PATINA REALTY, LLC $70,000Active0.26 Acres
22234 100th Avenue Se, Kent, WA 98031
MLS# 2327707Listed by: SKYLINE PROPERTIES, INC. $1,275,000Pending - Backup offer requested1.06 Acres
20244 108th Avenue Se, Kent, WA 98031
MLS# 2285405Listed by: DOVE REALTY, INC. $1,200,000Active3.4 Acres
22315 108th Avenue Se, Kent, WA 98031
MLS# 2159507Listed by: JOHN L. SCOTT, INC. $499,950Active3 beds 4 baths1,892 sq. ft.
11023 SE 240th Street #H1, Kent, WA 98031
MLS# 2488029Listed by: KELLER WILLIAMS RLTY BELLEVUE
Local realty services provided by:CENTURY 21 Lund, Realtors
Listings courtesy of Northwest MLS as distributed by MLS GRID. Based on information submitted to the MLS GRID as of March 30, 2026. All data is obtained from various sources and may not have been verified by broker or MLS GRID. Supplied Open House Information is subject to change without notice. All information should be independently reviewed and verified for accuracy. Properties may or may not be listed by the office/agent presenting the information. Listing information is provided for consumers' personal, non-commercial use, solely to identify prospective properties for potential purchase; all other use is strictly prohibited and may violate relevant federal and state law. Information deemed reliable but not guaranteed. Copyright © 2026 MLS GRID. All Rights Reserved.
Popular searches near 98031
Popular neighborhoods near 98031
- Berkshire Glen, Auburn homes for sale
- Christopher, Auburn homes for sale
- Elliott, Renton homes for sale
- Fairwood, Renton homes for sale
- Kent East Hill, Kent homes for sale
- Lea Hill, Auburn homes for sale
- Maplewood, Renton homes for sale
- Maplewood Heights, Renton homes for sale
- McVan, Seattle homes for sale
- Meridian Heights, Kent homes for sale
- Meridian Valley Country Club, Kent homes for sale
- Mill Creek, Kent homes for sale
- O'Brien, Kent homes for sale
- Pacific Ridge, Seattle homes for sale
- Riverview, Kent homes for sale
- Salt Air Hills, Kent homes for sale
- Scenic Hill, Kent homes for sale
- The Lakes, Kent homes for sale
- Timberlane, Kent homes for sale
- West Hill, Kent homes for sale
Counties near Kent, 98031
- Chelan County homes for sale
- Clallam County homes for sale
- Cowlitz County homes for sale
- Grays Harbor County homes for sale
- Island County homes for sale
- Jefferson County homes for sale
- King County homes for sale
- Kitsap County homes for sale
- Kittitas County homes for sale
- Lewis County homes for sale
- Mason County homes for sale
- Pacific County homes for sale
- Pierce County homes for sale
- San Juan County homes for sale
- Skagit County homes for sale
- Snohomish County homes for sale
- Thurston County homes for sale
- Wahkiakum County homes for sale
- Whatcom County homes for sale
- Yakima County homes for sale
Protect your home and budget from life's surprises with an Assurant Home Warranty, backed by a partner that supports you through every step of homeownership. Explore Plans.
©2026 Century 21 Real Estate LLC. All rights reserved. CENTURY 21®, the CENTURY 21 Logo and C21® are service marks owned by Century 21 Real Estate LLC. Century 21 Real Estate LLC fully supports the principles of the Fair Housing Act and the Equal Opportunity Act. Each office is independently owned and operated. Listing information is deemed reliable but not guaranteed accurate.