- Christie Ranch, Frisco homes for sale
- Cobb Hill, Frisco homes for sale
- Eldorado Estates, Little Elm homes for sale
- Griffin Parc, Frisco homes for sale
- Heather Ridge Estates, Frisco homes for sale
- Heritage Village, Frisco homes for sale
- Historic Downtown Frisco, Frisco homes for sale
- Newman Village, Frisco homes for sale
- Northridge Estates, Frisco homes for sale
- Park Place, Frisco homes for sale
- Pearson Farms, Frisco homes for sale
- Phillips Creek Ranch, Frisco homes for sale
- Ranch Estates, Frisco homes for sale
- Shaddock Creek, Frisco homes for sale
- Starwood, Frisco homes for sale
- Trails of Frisco, Frisco homes for sale
- Village Lakes, Frisco homes for sale
- Westfalls Village, Frisco homes for sale
- Windsor Place, Frisco homes for sale
- Woodstream, Frisco homes for sale
Kings Garden, Frisco, TX - homes for sale
5 of 5 results displayed
- New
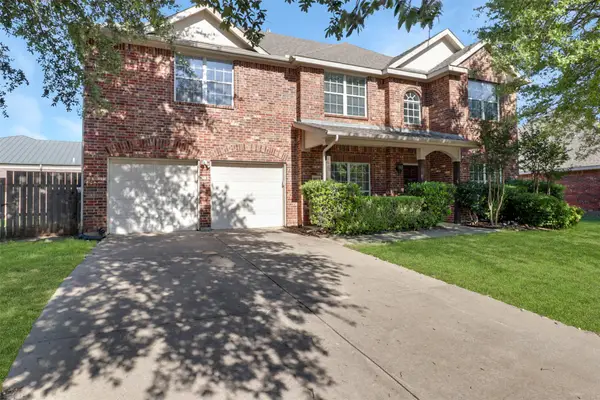 $480,000Active4 beds 3 baths2,825 sq. ft.
9103 Aristocrat Lane, Frisco, TX 75033
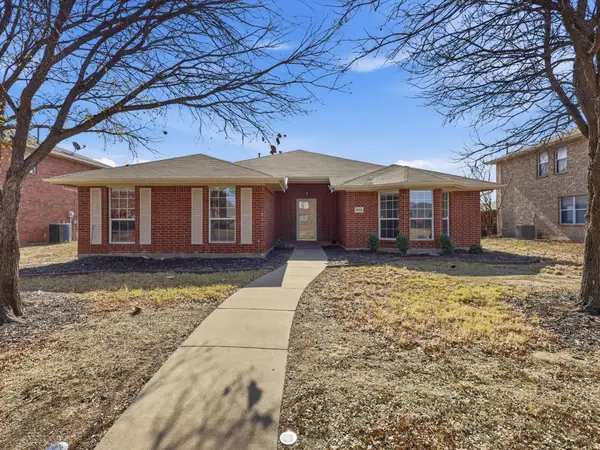
MLS# 21222567Listed by: COLDWELL BANKER APEX, REALTORS  $459,900Pending3 beds 2 baths1,919 sq. ft.
3942 Palace Place, Frisco, TX 75033
MLS# 21198446Listed by: EXP REALTY- Open Sat, 10am to 12pm
 $455,000Active3 beds 2 baths1,919 sq. ft.
4105 Freedom Lane, Frisco, TX 75033
MLS# 21131720Listed by: KELLER WILLIAMS LEGACY 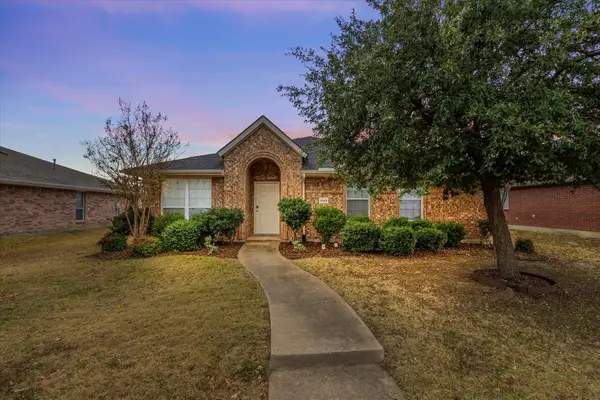 $489,000Active3 beds 2 baths2,184 sq. ft.
4143 Sun King Lane, Frisco, TX 75033
MLS# 21135152Listed by: KELLER WILLIAMS LEGACY $554,100Active5 beds 2 baths2,002 sq. ft.
4020 Cherry Ridge Drive, Frisco, TX 75033
MLS# 21118581Listed by: WAIMEA GROUP, INC.
Local realty services provided by:CENTURY 21 Elite
Information provided, in part, by North Texas Real Estate Information Systems, Inc. Last Updated April 1, 2026 Listings with the NTREIS logo are listed by brokerages other than CENTURY 21 Elite.
Popular neighborhoods near Kings Garden, Frisco, TX
Zip codes near Kings Garden, Frisco, TX
- 75007 homes for sale
- 75010 homes for sale
- 75013 homes for sale
- 75023 homes for sale
- 75024 homes for sale
- 75025 homes for sale
- 75033 homes for sale
- 75034 homes for sale
- 75035 homes for sale
- 75036 homes for sale
- 75056 homes for sale
- 75057 homes for sale
- 75065 homes for sale
- 75068 homes for sale
- 75070 homes for sale
- 75072 homes for sale
- 75078 homes for sale
- 75093 homes for sale
- 75287 homes for sale
- 76227 homes for sale
Counties near Kings Garden, Frisco, TX
- Bryan County homes for sale
- Collin County homes for sale
- Cooke County homes for sale
- Dallas County homes for sale
- Delta County homes for sale
- Denton County homes for sale
- Ellis County homes for sale
- Fannin County homes for sale
- Grayson County homes for sale
- Hunt County homes for sale
- Johnson County homes for sale
- Kaufman County homes for sale
- Love County homes for sale
- Marshall County homes for sale
- Montague County homes for sale
- Parker County homes for sale
- Rains County homes for sale
- Rockwall County homes for sale
- Tarrant County homes for sale
- Wise County homes for sale
Protect your home and budget from life's surprises with an Assurant Home Warranty, backed by a partner that supports you through every step of homeownership. Explore Plans.
©2026 Century 21 Real Estate LLC. All rights reserved. CENTURY 21®, the CENTURY 21 Logo and C21® are service marks owned by Century 21 Real Estate LLC. Century 21 Real Estate LLC fully supports the principles of the Fair Housing Act and the Equal Opportunity Act. Each office is independently owned and operated. Listing information is deemed reliable but not guaranteed accurate.