- Bainbridge Island homes for sale
- Chico homes for sale
- East Port Orchard homes for sale
- Enetai homes for sale
- Indianola homes for sale
- Keyport homes for sale
- Kingston homes for sale
- Kitsap Lake homes for sale
- Lofall homes for sale
- Manchester homes for sale
- Navy Yard City homes for sale
- Parkwood homes for sale
- Port Orchard homes for sale
- Poulsbo homes for sale
- Rocky Point homes for sale
- Seabeck homes for sale
- Silverdale homes for sale
- Suquamish homes for sale
- Tracyton homes for sale
- Woodway homes for sale
Kitsap County, WA - homes for sale
300 of 1,137 results displayed
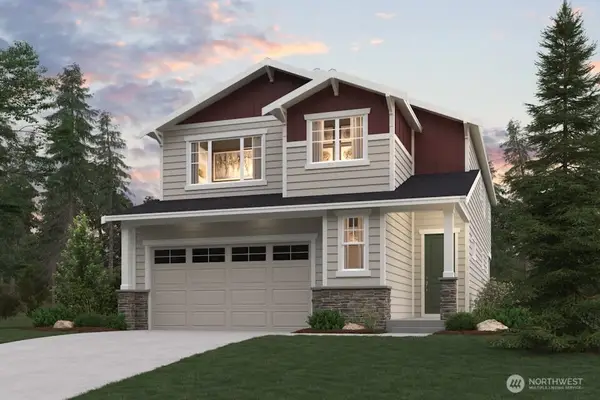
- Open Sat, 12 to 3pmNew
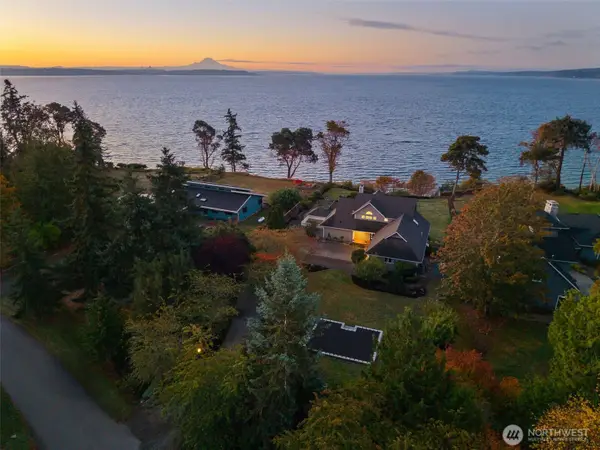
 $949,500Active3 beds 3 baths2,780 sq. ft.
30996 Old Hansville Road Ne, Kingston, WA 98346
MLS# 2485748Listed by: WINDERMERE RE WEST SOUND INC.
- New
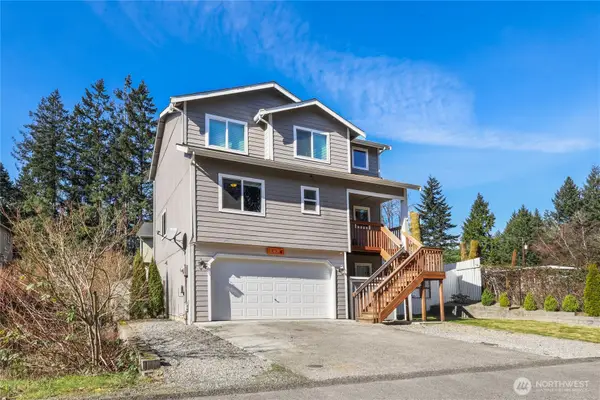
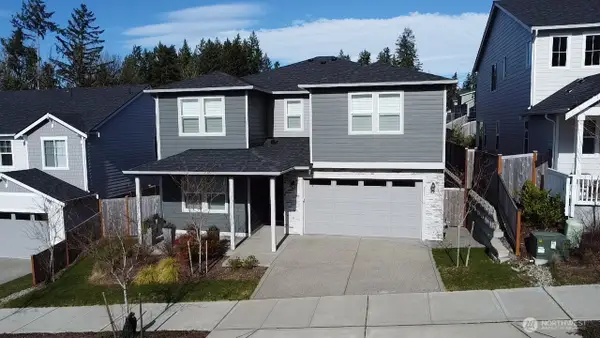
 $679,950Active4 beds 3 baths2,698 sq. ft.
724 S Summit Avenue, Bremerton, WA 98312
MLS# 2490210Listed by: JOHN L. SCOTT, INC.  $649,990Pending3 beds 2 baths1,950 sq. ft.
4141 SW Muller Lane #315, Port Orchard, WA 98367
MLS# 2490844Listed by: RICHMOND REALTY OF WASHINGTON- Open Sat, 11am to 1pmNew
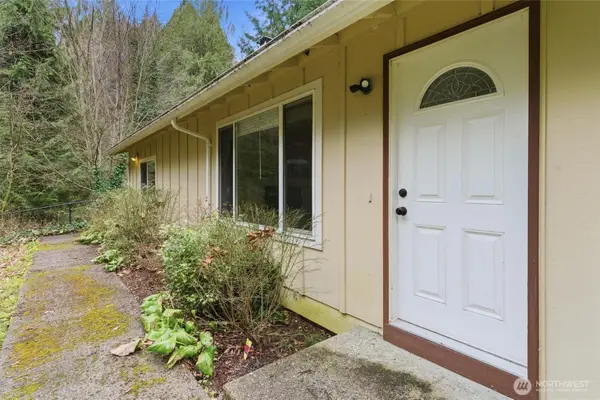
 $440,000Active3 beds 2 baths1,400 sq. ft.
845 SW Shannon Drive, Port Orchard, WA 98367
MLS# 2483797Listed by: REDFIN - New
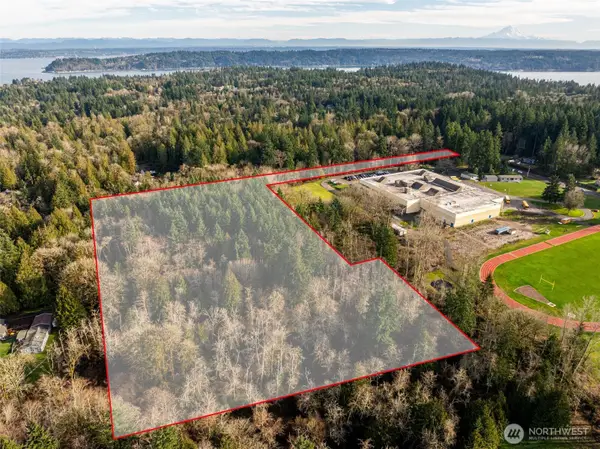
 $699,000Active0.43 Acres
17274 Angeline Avenue South Ne, Suquamish, WA 98392
MLS# 2488943Listed by: COMPASS - Open Fri, 3 to 5pmNew
 $929,000Active4 beds 3 baths2,557 sq. ft.
9916 NW Dishman Road, Bremerton, WA 98312
MLS# 2487172Listed by: KELLER WILLIAMS GREATER 360 - New
 $224,999Active2.78 Acres
0 Olympic View Road Nw, Silverdale, WA 98383
MLS# 2488931Listed by: WINDERMERE RE WEST SOUND INC. - New
 $200,000Active2.66 Acres
11 Cassie Place Nw #11, Poulsbo, WA 98370
MLS# 2488956Listed by: BETTER PROPERTIES KITSAP - Open Sat, 11am to 4pmNew
 $370,000Active2 beds 1 baths806 sq. ft.
4110 W J Street, Bremerton, WA 98312
MLS# 2489960Listed by: JOHN L. SCOTT, INC. - New
 $715,000Active4 beds 2 baths1,724 sq. ft.
1805 Lawrence Street, Port Orchard, WA 98366
MLS# 2490508Listed by: REAL BROKER LLC - New
 $545,000Active3 beds 2 baths1,468 sq. ft.
7451 Ebbert Drive Se, Port Orchard, WA 98367
MLS# 2489535Listed by: REAL BROKER LLC  $944,650Pending4 beds 4 baths3,898 sq. ft.
5402 Thornhill Avenue Sw, Port Orchard, WA 98367
MLS# 2490041Listed by: TEAMBUILDER KW- New
 $925,000Active3 beds 4 baths3,965 sq. ft.
18680 NW Hintzville Road, Seabeck, WA 98380
MLS# 2487061Listed by: RE/MAX EXCLUSIVE - New
 $595,000Active10.55 Acres
0 Lot 2 Mccormick Village, Port Orchard, WA 98367
MLS# 2489798Listed by: HAWKINS POE - New
 $625,000Active0.58 Acres
9190 Fox Cove Lane Ne #6, Bainbridge Island, WA 98110
MLS# 2489431Listed by: CHARTER REAL ESTATE - Open Sat, 11am to 2pmNew
 $534,950Active3 beds 3 baths1,888 sq. ft.
5168 Sinclair Way, Bremerton, WA 98312
MLS# 2489646Listed by: WINDERMERE RE/LAKE TAPPS, INC  $597,481Pending4 beds 3 baths2,457 sq. ft.
6201 Crestner Drive Sw #400, Port Orchard, WA 98367
MLS# 2489645Listed by: KB HOME SALES- New
 $673,720Active3 beds 2 baths1,829 sq. ft.
23382 Marinwood Circle Ne #02112, Kingston, WA 98346
MLS# 2489555Listed by: PULTE HOMES OF WASHINGTON INC - New
 $715,000Active-- beds -- baths1,724 sq. ft.
1805 Lawrence Street, Port Orchard, WA 98366
MLS# 2489581Listed by: REAL BROKER LLC - New
 $949,219Active5 beds 4 baths2,905 sq. ft.
23576 Marinwood Circle Ne #06313, Kingston, WA 98346
MLS# 2478033Listed by: PULTE HOMES OF WASHINGTON INC - New
 $514,900Active3 beds 2 baths1,319 sq. ft.
6312 NW Bruggman Loop, Silverdale, WA 98312
MLS# 2489479Listed by: LGI REALTY - New
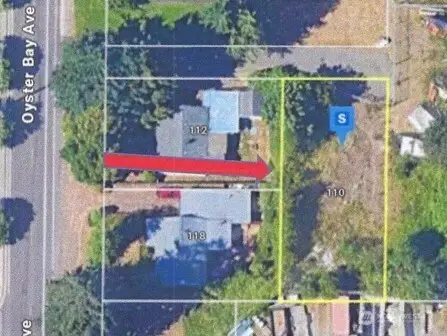 $95,000Active0.14 Acres
110 S Oyster Bay Avenue, Bremerton, WA 98312
MLS# 2484302Listed by: EXP REALTY  $460,000Pending3 beds 2 baths1,248 sq. ft.
2895 Corfu Boulevard Ne, Bremerton, WA 98311
MLS# 2488914Listed by: BETTER PROPERTIES GIG HARBOR $545,000Pending4 beds 3 baths2,356 sq. ft.
1991 NE Trussel Court, Bremerton, WA 98311
MLS# 2488940Listed by: JOHN L. SCOTT, INC.- New
 $425,000Active3 beds 2 baths1,672 sq. ft.
6530 Wellington Lane Ne, Bremerton, WA 98311
MLS# 2489023Listed by: REDFIN - New
 $1,050,000Active2 beds 2 baths2,148 sq. ft.
609 Shore Dr, Bremerton, WA 98310
MLS# 2489274Listed by: DALE WALTERS REAL ESTATE - New
 $509,900Active3 beds 2 baths1,319 sq. ft.
6324 NW Bruggman Loop, Silverdale, WA 98312
MLS# 2489369Listed by: LGI REALTY - New
 $499,900Active3 beds 2 baths1,319 sq. ft.
6379 NW Bruggman Loop, Silverdale, WA 98312
MLS# 2489483Listed by: LGI REALTY - Open Wed, 10:30am to 5:30pmNew
 $1,039,990Active6 beds 4 baths3,392 sq. ft.
2055 NE Norseman Way, Poulsbo, WA 98370
MLS# 2488470Listed by: BMC REALTY ADVISORS INC - New
 $630,000Active3 beds 4 baths2,746 sq. ft.
122 Fireweed Street, Port Orchard, WA 98366
MLS# 2489055Listed by: RE/MAX PLATINUM SRVS/SILVERDAL - New
 $189,500Active0.29 Acres
6022 Osprey Circle, Bremerton, WA 98312
MLS# 2487814Listed by: JOHN L. SCOTT, INC. - New
 $400,000Active-- beds 1 baths480 sq. ft.
4692 NE Lincoln Road, Poulsbo, WA 98370
MLS# 2487266Listed by: EXP REALTY  $575,000Pending3 beds 2 baths1,698 sq. ft.
3380 NW Shadow Glen Boulevard, Silverdale, WA 98383
MLS# 2488124Listed by: REDFIN $599,000Pending3 beds 2 baths2,022 sq. ft.
171 NE Averys Lane, Poulsbo, WA 98370
MLS# 2489098Listed by: WINDERMERE PROF PARTNERS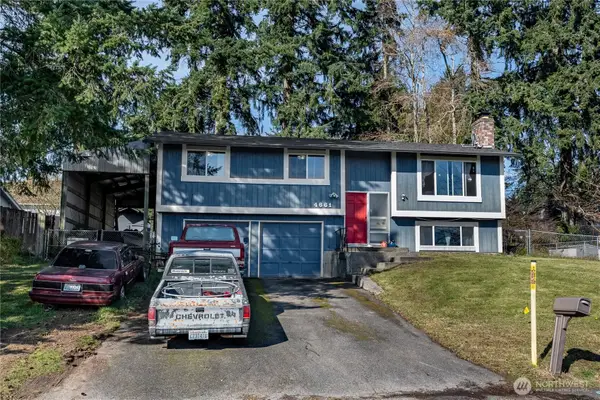 $447,777Pending3 beds 3 baths1,714 sq. ft.
4661 SE Basswood Lane, Port Orchard, WA 98366
MLS# 2466956Listed by: PARAMOUNT REAL ESTATE GROUP- New
 $535,000Active4 beds 4 baths2,636 sq. ft.
147 SW Marcia Way, Port Orchard, WA 98366
MLS# 2485708Listed by: REDFIN - New
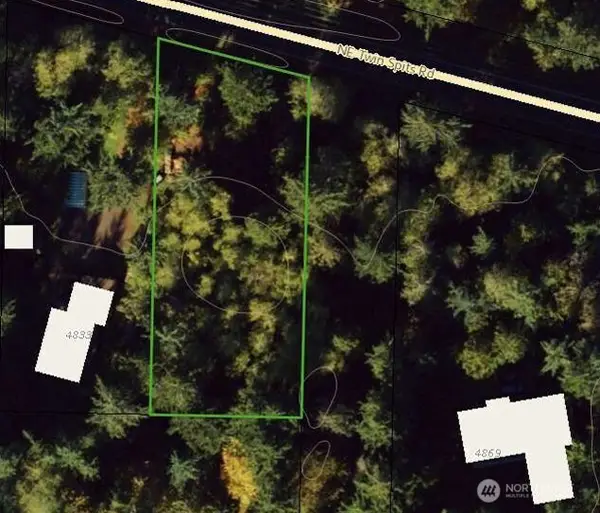 $159,000Active0.54 Acres
4843 NE Twin Spits Road, Hansville, WA 98340
MLS# 2486387Listed by: EXP REALTY - New
 $839,000Active4 beds 3 baths2,338 sq. ft.
9610 NE Meyers Lane, Kingston, WA 98346
MLS# 2484912Listed by: RE/MAX CONNECT - New
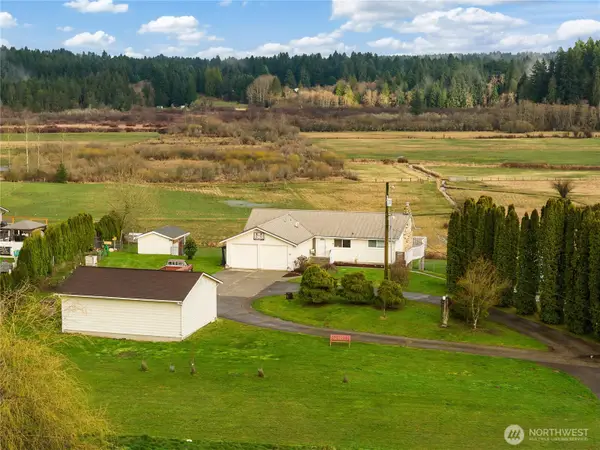 $755,000Active4 beds 2 baths2,856 sq. ft.
7693 Sidney Road Sw, Port Orchard, WA 98367
MLS# 2477431Listed by: BEST CHOICE REALTY LLC  $625,000Pending3 beds 3 baths2,184 sq. ft.
5403 Lone Star Lane Nw, Bremerton, WA 98312
MLS# 2485503Listed by: WINDERMERE PROF PARTNERS- New
 $500,000Active11.92 Acres
0 SE Sedgwick Road, Port Orchard, WA 98366
MLS# 2484243Listed by: KELLER WILLIAMS REALTY PS  $465,000Pending3 beds 3 baths2,468 sq. ft.
1820 Rustic Lane, Bremerton, WA 98310
MLS# 2487171Listed by: KELLER WILLIAMS GREATER 360 $470,000Pending3 beds 2 baths1,418 sq. ft.
2948 SE Alson Ct, Port Orchard, WA 98366
MLS# 2487650Listed by: DALE WALTERS REAL ESTATE- New
 $485,000Active3 beds 2 baths1,360 sq. ft.
9010 Wyvern Drive Se, Port Orchard, WA 98367
MLS# 2487753Listed by: BETTER PROPERTIES GIG HARBOR - New
 $2,350,000Active4 beds 3 baths2,780 sq. ft.
12388 NE Marine View Drive, Kingston, WA 98346
MLS# 2488215Listed by: COMPASS - New
 $675,000Active4 beds 3 baths2,810 sq. ft.
771 Nordmann Loop #34, Port Orchard, WA 98366
MLS# 2485421Listed by: VAN DORM REALTY, INC  $495,000Pending4 beds 4 baths1,837 sq. ft.
991 NW Snow Creek Way, Bremerton, WA 98311
MLS# 2486679Listed by: STERLING PROPERTY GROUP $599,000Pending4 beds 2 baths1,872 sq. ft.
1270 Lansing Avenue, Bremerton, WA 98312
MLS# 2484091Listed by: WINDERMERE PROF PARTNERS $749,000Pending3 beds 4 baths4,250 sq. ft.
3840 NE Ambleside Lane, Bremerton, WA 98311
MLS# 2488072Listed by: JOHN L. SCOTT, INC.- New
 $285,000Active2 beds 2 baths982 sq. ft.
1700 W Sunn Fjord Lane #L-110, Bremerton, WA 98312
MLS# 2488348Listed by: KELLER WILLIAMS GREATER 360 - Open Sun, 1am to 4pmNew
 $1,199,000Active3 beds 3 baths2,980 sq. ft.
13100 NE James Way, Kingston, WA 98346
MLS# 2481842Listed by: LAKE & COMPANY  $995,000Pending3 beds 3 baths3,332 sq. ft.
9918 NE Kingston Farm Road, Kingston, WA 98346
MLS# 2486401Listed by: RE/MAX FIRST INC PORT TOWNSEND $525,000Pending4 beds 2 baths1,388 sq. ft.
405 Falcon Court Ne, Bremerton, WA 98311
MLS# 2469311Listed by: PARAMOUNT REAL ESTATE GROUP- New
 $1,325,000Active3 beds 2 baths1,608 sq. ft.
428 Harborview Drive Se #121, Bainbridge Island, WA 98110
MLS# 2486675Listed by: WINDERMERE RE BAINBRIDGE  $469,995Pending3 beds 2 baths1,530 sq. ft.
3536 Almira Drive, Bremerton, WA 98310
MLS# 2488235Listed by: PARAMOUNT REAL ESTATE GROUP- New
 $485,000Active4 beds 2 baths1,992 sq. ft.
3236 NW Gillard Place, Seabeck, WA 98380
MLS# 2486777Listed by: KELLER WILLIAMS WEST SOUND - New
 $2,095,000Active3 beds 4 baths3,316 sq. ft.
10668 NE Manor Lane, Bainbridge Island, WA 98110
MLS# 2482113Listed by: COLDWELL BANKER BAIN - New
 $2,788,000Active4 beds 4 baths3,917 sq. ft.
6555 Ridge Lane Ne, Bainbridge Island, WA 98110
MLS# 2483812Listed by: COLDWELL BANKER BAIN  $2,950,000Pending3 beds 4 baths2,950 sq. ft.
5256 Old Mill Road Ne, Bainbridge Island, WA 98110
MLS# 2486586Listed by: JOHN L. SCOTT, INC. $1,190,000Pending3 beds 3 baths2,184 sq. ft.
8205 NE Blakely Court W, Bainbridge Island, WA 98110
MLS# 2487641Listed by: COMPASS- New
 $600,000Active3 beds 2 baths1,716 sq. ft.
24382 Catamount Lane Nw, Poulsbo, WA 98370
MLS# 2486933Listed by: JOHN L. SCOTT, INC - New
 $4,250,000Active3 beds 6 baths4,284 sq. ft.
11710 Arrow Point Drive Ne, Bainbridge Island, WA 98110
MLS# 2478795Listed by: COMPASS  $1,200,000Pending3 beds 3 baths2,386 sq. ft.
5384 Crystal Springs Drive Ne, Bainbridge Island, WA 98110
MLS# 2485520Listed by: WINDERMERE RE BAINBRIDGE $499,000Pending2 beds 2 baths1,288 sq. ft.
231 NW Shepard Way, Bainbridge Island, WA 98110
MLS# 2488126Listed by: WINDERMERE RE BAINBRIDGE $670,000Pending4 beds 3 baths2,574 sq. ft.
1339 Baker Heights Loop, Bremerton, WA 98312
MLS# 2482534Listed by: COLDWELL BANKER BAIN- New
 $880,000Active2 beds 2 baths1,188 sq. ft.
1524 Toe Jam Hill Road Ne, Bainbridge Island, WA 98110
MLS# 2486937Listed by: REALOGICS SOTHEBY'S INT'L RLTY - Open Wed, 10am to 1pm
 $849,900Pending5 beds 3 baths3,139 sq. ft.
2463 NE Athlon Court, Poulsbo, WA 98370
MLS# 2483842Listed by: REDFIN - New
 $479,000Active3 beds 2 baths1,344 sq. ft.
2652 Maryland Way E, Port Orchard, WA 98366
MLS# 2482765Listed by: KELLER WILLIAMS GREATER 360 - New
 $2,195,000Active3 beds 2 baths2,649 sq. ft.
6490 NE Monte Vista Drive, Bainbridge Island, WA 98110
MLS# 2486520Listed by: JOHN L. SCOTT, INC.  $649,000Pending4 beds 3 baths2,150 sq. ft.
4844 NW Walgren Drive, Silverdale, WA 98383
MLS# 2487756Listed by: COMMENCEMENT BAY BROKERS LLC- Open Wed, 1 to 5pmNew
 $699,990Active3 beds 2 baths2,099 sq. ft.
5944 Trace Drive Sw, Port Orchard, WA 98367
MLS# 2485051Listed by: BMC REALTY ADVISORS INC - New
 $650,000Active3 beds 2 baths1,410 sq. ft.
16311 W Ludvick Lake Road, Seabeck, WA 98380
MLS# 2485852Listed by: REALOGICS SOTHEBY'S INT'L RLTY  $540,000Pending3 beds 3 baths1,736 sq. ft.
7479 Woodridge Lane Nw, Bremerton, WA 98311
MLS# 2486181Listed by: ANB HOMES- Open Wed, 11am to 6pmNew
 $624,990Active4 beds 3 baths2,448 sq. ft.
3995 Flat Top Drive, Bremerton, WA 98312
MLS# 2484566Listed by: BMC REALTY ADVISORS INC - New
 $179,000Active2 beds 1 baths910 sq. ft.
2530 NE Helm Street, Bremerton, WA 98310
MLS# 2487518Listed by: FATHOM REALTY WA LLC  $2,198,000Pending5 beds 4 baths5,349 sq. ft.
879 Taurnic Place Nw, Bainbridge Island, WA 98110
MLS# 2485900Listed by: REALOGICS SOTHEBY'S INT'L RLTY $625,000Pending3 beds 2 baths1,656 sq. ft.
19763 12th Avenue Ne, Poulsbo, WA 98370
MLS# 2486692Listed by: WINDERMERE RE WEST SOUND INC.- New
 $375,000Active0.86 Acres
35275 Hood Canal Drive Ne #29, Kingston, WA 98346
MLS# 2486002Listed by: WINDERMERE RE WEST SOUND INC.  $499,000Pending-- beds -- baths1,632 sq. ft.
691 Pearl Place, Bremerton, WA 98310
MLS# 2487084Listed by: WESTMORELAND PROPERTIES $550,000Pending3 beds 2 baths1,800 sq. ft.
1332 Nipsic Avenue, Bremerton, WA 98310
MLS# 2486328Listed by: KELLER WILLIAMS GREATER 360- Open Sat, 1 to 3pmNew
 $2,649,000Active4 beds 4 baths4,007 sq. ft.
7535 NE West Port Madison Road, Bainbridge Island, WA 98110
MLS# 2486561Listed by: REALOGICS SOTHEBY'S INT'L RLTY - New
 $875,000Active3 beds 4 baths3,312 sq. ft.
3040 Classic Avenue Ne, Bremerton, WA 98310
MLS# 2486946Listed by: KELLER WILLIAMS GREATER 360 - Open Wed, 11am to 6pmNew
 $634,990Active3 beds 2 baths2,155 sq. ft.
3998 Flat Top Drive, Bremerton, WA 98312
MLS# 2484589Listed by: BMC REALTY ADVISORS INC  $559,000Pending4 beds 4 baths2,258 sq. ft.
4280 Nettle Drive Se, Port Orchard, WA 98366
MLS# 2486809Listed by: KELLER WILLIAMS GREATER 360- New
 $1,249,950Active4 beds 3 baths3,036 sq. ft.
1174 SW Clevenger Lane, Port Orchard, WA 98367
MLS# 2483937Listed by: INSPIRE REALTY - New
 $2,975,000Active3 beds 6 baths4,558 sq. ft.
13970 Manzanita Road Ne, Bainbridge Island, WA 98110
MLS# 2483767Listed by: BAINBRIDGE HOMES REAL ESTATE - New
 $2,975,000Active3 beds 6 baths4,317 sq. ft.
13982 Manzanita Road Ne, Bainbridge Island, WA 98110
MLS# 2483779Listed by: BAINBRIDGE HOMES REAL ESTATE  $450,000Pending3 beds 2 baths1,060 sq. ft.
124 W Lippert Drive, Port Orchard, WA 98366
MLS# 2486278Listed by: CHARTER REAL ESTATE- New
 $535,900Active5 beds 4 baths3,358 sq. ft.
5130 Victory Drive Sw, Port Orchard, WA 98367
MLS# 2486573Listed by: HOMESMART REAL ESTATE ASSOC - New
 $195,995Active2 beds 2 baths972 sq. ft.
1588 Naval Avenue #10, Bremerton, WA 98312
MLS# 2459288Listed by: COMPASS - New
 $1,390,000Active4 beds 2 baths2,810 sq. ft.
11785 Penny Place Ne, Bainbridge Island, WA 98110
MLS# 2486604Listed by: REALOGICS SOTHEBY'S INT'L RLTY - New
 $979,950Active4 beds 3 baths1,973 sq. ft.
4402 Lone Bear Lane Sw, Port Orchard, WA 98367
MLS# 2483525Listed by: RE/MAX EXCLUSIVE - New
 $3,950,000Active3 beds 6 baths3,679 sq. ft.
15550 Sandy Hook Rd Ne, Poulsbo, WA 98370
MLS# 2483578Listed by: COLDWELL BANKER BAIN - New
 $110,000Active4.2 Acres
0 6xxx Se Sedgwick Road #LOT 17, Port Orchard, WA 98366
MLS# 2486266Listed by: JOHN L. SCOTT, INC. - New
 $445,000Active3 beds 3 baths1,441 sq. ft.
6726 NE Columbia Street, Suquamish, WA 98392
MLS# 2460722Listed by: CHARTER REAL ESTATE - Open Wed, 1 to 5pmNew
 $763,990Active5 beds 3 baths2,741 sq. ft.
5964 Trace Drive Sw, Port Orchard, WA 98367
MLS# 2485084Listed by: BMC REALTY ADVISORS INC - New
 $1,850,000Active3 beds 4 baths4,911 sq. ft.
2941 Erlands Beach Loop Nw, Bremerton, WA 98312
MLS# 2486281Listed by: MANETTE REAL ESTATE CO. 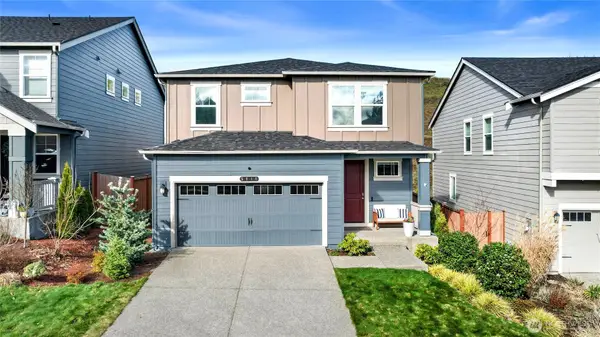 $550,000Pending4 beds 3 baths2,050 sq. ft.
5810 Waverly Road Sw, Port Orchard, WA 98367
MLS# 2483762Listed by: REDFIN- New
 $289,900Active3 beds 2 baths1,820 sq. ft.
6680 NE Aquarius Lane, Bremerton, WA 98311
MLS# 2486200Listed by: WINDERMERE RE WEST SOUND INC. 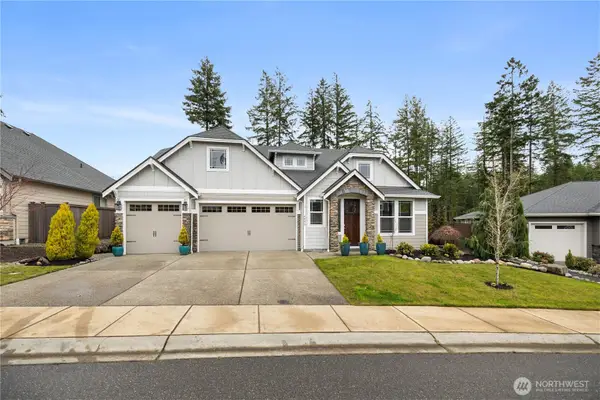 $850,000Pending4 beds 4 baths2,928 sq. ft.
4853 Castleton Road Sw, Port Orchard, WA 98367
MLS# 2475325Listed by: COLDWELL BANKER BAIN- New
 $265,000Active3 beds 1 baths1,584 sq. ft.
517 NW Past Drive, Poulsbo, WA 98370
MLS# 2486245Listed by: JOHN L. SCOTT, INC. 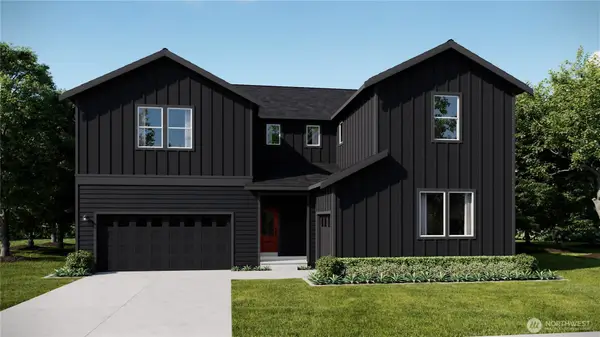 $974,950Pending5 beds 5 baths4,194 sq. ft.
6084 Trace Drive Sw, Port Orchard, WA 98367
MLS# 2486241Listed by: LENNAR SALES CORP.- Open Wed, 10:30am to 5:30pmNew
 $650,890Active4 beds 3 baths2,330 sq. ft.
1900 NW Nahele Court #51, Poulsbo, WA 98370
MLS# 2486216Listed by: KB HOME SALES - Open Wed, 10:30am to 5:30pmNew
 $599,950Active4 beds 3 baths2,330 sq. ft.
1857 NW Nahele Court #56, Poulsbo, WA 98370
MLS# 2486226Listed by: KB HOME SALES - Open Wed, 10:30am to 5:30pmNew
 $599,950Active4 beds 3 baths2,330 sq. ft.
1833 NW Nahele Court #60, Poulsbo, WA 98370
MLS# 2486228Listed by: KB HOME SALES - Open Wed, 10:30am to 5:30pmNew
 $603,880Active3 beds 3 baths1,870 sq. ft.
1875 NW Nahele Court #53, Poulsbo, WA 98370
MLS# 2486197Listed by: KB HOME SALES - New
 $344,900Active3 beds 2 baths1,188 sq. ft.
10030 NW Pioneer Road, Seabeck, WA 98380
MLS# 2485306Listed by: EXP REALTY - New
 $110,000Active3 beds 2 baths1,152 sq. ft.
3060 NE Mcwilliams Road #61, Bremerton, WA 98311
MLS# 2486032Listed by: WINDERMERE RE WEST SOUND INC. - New
 $185,000Active0.22 Acres
37971 Brant Road Ne #20, Hansville, WA 98340
MLS# 2484650Listed by: COLDWELL BANKER DANFORTH - New
 $315,000Active2 beds 1 baths844 sq. ft.
26425 Pennsylvania Avenue Ne #14, Kingston, WA 98346
MLS# 2485646Listed by: WINDERMERE RE WEST SOUND INC. - New
 $1,295,000Active37.81 Acres
26663 Big Valley Road Ne, Poulsbo, WA 98370
MLS# 2486017Listed by: EXP REALTY - Open Wed, 10:30am to 5:30pmNew
 $644,950Active4 beds 3 baths2,755 sq. ft.
22175 Jameson Avenue Nw #79, Poulsbo, WA 98370
MLS# 2486087Listed by: KB HOME SALES  $449,000Pending4 beds 3 baths1,742 sq. ft.
1615 Cottman Avenue, Bremerton, WA 98312
MLS# 2485604Listed by: WINDERMERE RE WEST SOUND INC. $249,800Active4 beds 2 baths1,160 sq. ft.
8161 Sandy Road Ne, Bremerton, WA 98311
MLS# 2485913Listed by: TEC REAL ESTATE INC. $599,900Active3 beds 2 baths2,008 sq. ft.
1046 Puget Drive Se, Port Orchard, WA 98366
MLS# 2485838Listed by: PARAMOUNT REAL ESTATE GROUP- Open Wed, 10am to 5:30pm
 $724,990Pending4 beds 3 baths2,680 sq. ft.
10649 Treasure Drive Nw #119, Silverdale, WA 98383
MLS# 2485859Listed by: RICHMOND REALTY OF WASHINGTON  $1,540,000Active3 beds 5 baths4,650 sq. ft.
14440 Sunrise Drive Ne, Bainbridge Island, WA 98110
MLS# 2473301Listed by: THE AGENCY BAINBRIDGE ISLAND- Open Wed, 1 to 5pm
 $774,990Pending5 beds 4 baths2,949 sq. ft.
5904 Trace Drive Sw, Port Orchard, WA 98367
MLS# 2485026Listed by: BMC REALTY ADVISORS INC  $700,000Active4 beds 3 baths2,276 sq. ft.
8115 Berry Ridge Lane Nw, Silverdale, WA 98383
MLS# 2485202Listed by: GOLDHOUSE REALTY $870,000Active3 beds 3 baths2,609 sq. ft.
6353 Great Glen Road Sw, Port Orchard, WA 98367
MLS# 2483745Listed by: REDFIN- Open Wed, 11am to 6pm
 $659,990Active4 beds 2 baths2,448 sq. ft.
3991 Flat Top Drive, Bremerton, WA 98312
MLS# 2484553Listed by: BMC REALTY ADVISORS INC  $260,000Pending2 beds 2 baths939 sq. ft.
3330 Narrows View Lane Ne #201, Bremerton, WA 98310
MLS# 2485729Listed by: WINDERMERE PROF PARTNERS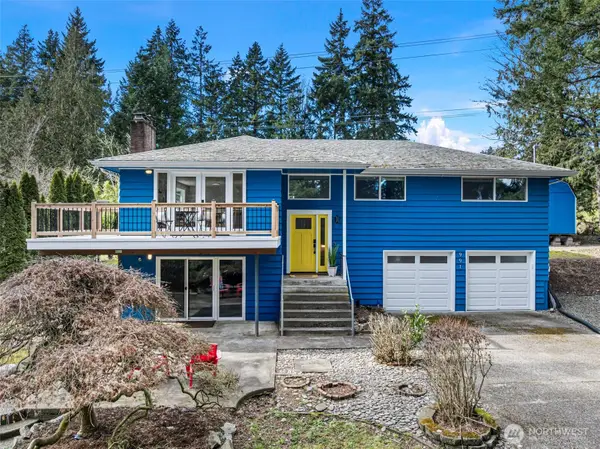 $650,000Pending3 beds 2 baths1,986 sq. ft.
991 NW Anderson Lane, Poulsbo, WA 98370
MLS# 2482340Listed by: KELLER WILLIAMS GREATER 360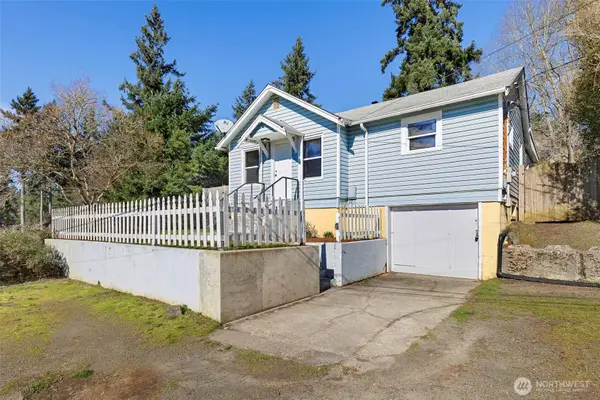 $425,000Pending3 beds 1 baths1,952 sq. ft.
3012 17th Street, Bremerton, WA 98312
MLS# 2484295Listed by: MANETTE REAL ESTATE CO. $445,000Pending3 beds 2 baths1,236 sq. ft.
3670 Westland Court Se, Port Orchard, WA 98366
MLS# 2485509Listed by: PARAMOUNT REAL ESTATE GROUP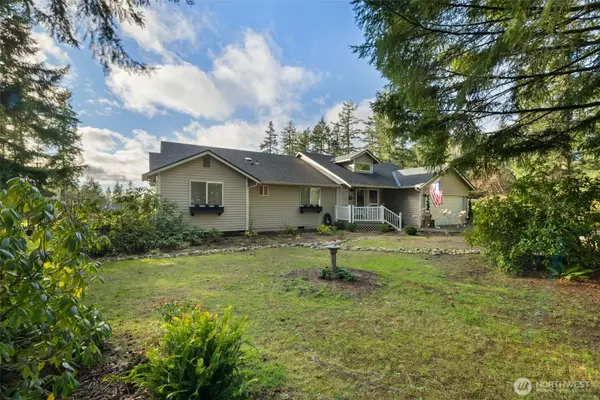 $749,000Active3 beds 3 baths2,079 sq. ft.
13300 Stoney Ridge Lane Sw, Port Orchard, WA 98367
MLS# 2484741Listed by: MARTIN REAL ESTATE GROUP $419,000Pending2 beds 2 baths1,144 sq. ft.
900 NW Leisure Lane, Bremerton, WA 98311
MLS# 2485297Listed by: ALGER REAL ESTATE GROUP, LLC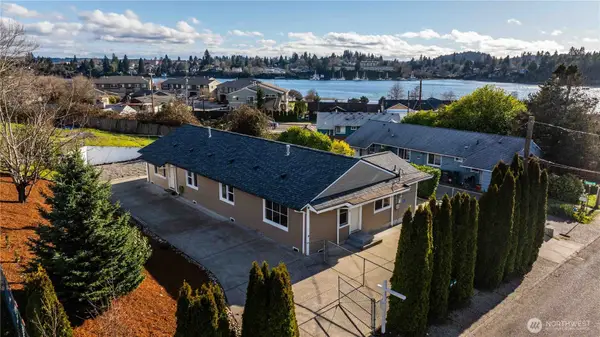 $475,000Pending-- beds -- baths1,440 sq. ft.
119 Elm St Unit #a And #b, Bremerton, WA 98310
MLS# 2485489Listed by: WINDERMERE RE WEST SOUND INC. $525,000Pending3 beds 2 baths1,300 sq. ft.
565 NE Ormsby Way, Bremerton, WA 98311
MLS# 2485590Listed by: JOHN L. SCOTT, INC. $259,000Active2 beds 1 baths865 sq. ft.
2949 Mile Hill Drive Se #C7, Port Orchard, WA 98366
MLS# 2484218Listed by: KELLER WILLIAMS REALTY $519,500Active3 beds 2 baths1,431 sq. ft.
26009 Barrett Road Ne, Kingston, WA 98346
MLS# 2478435Listed by: SKYLINE PROPERTIES, INC. $750,000Pending3 beds 3 baths2,564 sq. ft.
4075 Farmer Dell Road E, Port Orchard, WA 98366
MLS# 2484083Listed by: GOOD PROPERTY MANAGEMENT INC $450,000Active3 beds 2 baths1,224 sq. ft.
7350 E Raintree Lane, Port Orchard, WA 98366
MLS# 2483463Listed by: KELLY RIGHT RE OF SEATTLE LLC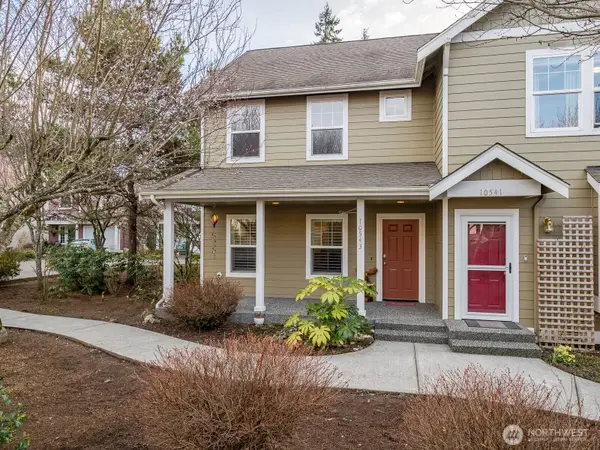 $420,000Active3 beds 3 baths1,261 sq. ft.
10543 NE Kingston Meadows Circle #354, Kingston, WA 98346
MLS# 2480937Listed by: JOHN L. SCOTT, INC. $490,000Pending3 beds 3 baths1,640 sq. ft.
2772 Massachusettes Place E, Port Orchard, WA 98366
MLS# 2482959Listed by: REDFIN $650,000Active5 beds 3 baths2,455 sq. ft.
7861 University Point Circle Ne, Bremerton, WA 98311
MLS# 2484936Listed by: COLDWELL BANKER PARK SHORE RE $400,000Active3 beds 2 baths1,464 sq. ft.
2877 Clare Ave, Bremerton, WA 98310
MLS# 2484952Listed by: WINDERMERE PROF PARTNERS $599,000Pending3 beds 3 baths2,520 sq. ft.
7331 E Center Street, Port Orchard, WA 98366
MLS# 2485163Listed by: CRAFTED REAL ESTATE $785,000Pending3 beds 3 baths2,643 sq. ft.
12775 Ranch Ridge Court Sw, Port Orchard, WA 98367
MLS# 2485248Listed by: NEIGHBORHOOD EXPERTS REAL EST. $514,000Pending3 beds 2 baths1,601 sq. ft.
2337 SE Plymouth Way, Port Orchard, WA 98366
MLS# 2481657Listed by: BCR LLC $989,000Pending3 beds 2 baths1,600 sq. ft.
16395 Norum Road Ne, Poulsbo, WA 98370
MLS# 2483505Listed by: WINDERMERE RE WEST SOUND INC. $395,000Pending3 beds 1 baths1,038 sq. ft.
11618 Fry Avenue Sw, Port Orchard, WA 98367
MLS# 2484894Listed by: COLDWELL BANKER BAIN $374,777Active3 beds 2 baths1,774 sq. ft.
2515 E Williams Lane, Port Orchard, WA 98366
MLS# 2476367Listed by: PARAMOUNT REAL ESTATE GROUP- Open Sat, 10am to 12pm
 $695,000Active3 beds 2 baths2,112 sq. ft.
2461 Cantu Lane Nw, Seabeck, WA 98380
MLS# 2480408Listed by: REDFIN  $795,000Active3 beds 3 baths2,160 sq. ft.
12001 Seabeck Highway Nw, Seabeck, WA 98380
MLS# 2484121Listed by: REALLY PROPERTIES INC $945,508Pending4 beds 4 baths3,898 sq. ft.
5392 Thornhill Avenue Sw, Port Orchard, WA 98367
MLS# 2483386Listed by: TEAMBUILDER KW $569,900Active4 beds 3 baths2,703 sq. ft.
4729 Okanogan Drive Se, Port Orchard, WA 98366
MLS# 2484174Listed by: SKYLINE PROPERTIES, INC. $220,000Active0.24 Acres
3710 Cartier Drive, Bremerton, WA 98312
MLS# 2484814Listed by: JOHN L. SCOTT, INC.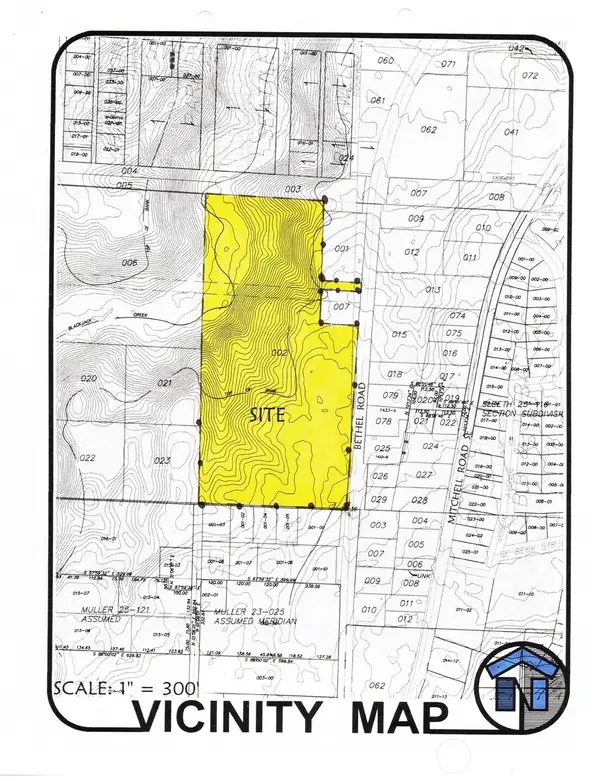 $2,900,000Active18.47 Acres
2200 Bethel Avenue, Port Orchard, WA 98366
MLS# 2485184Listed by: G ANDERSON GROUP LLC $577,777Pending4 beds 3 baths2,080 sq. ft.
9574 Radcliff Avenue Ne, Bremerton, WA 98311
MLS# 2459710Listed by: PARAMOUNT REAL ESTATE GROUP $775,000Active3 beds 2 baths2,888 sq. ft.
3649 Long Lake Road Se, Port Orchard, WA 98366
MLS# 2482988Listed by: RE/MAX EXCLUSIVE $839,950Active3 beds 2 baths1,664 sq. ft.
7605 NE Hidden Cove Rd, Bainbridge Island, WA 98110
MLS# 2483976Listed by: REAL BROKER LLC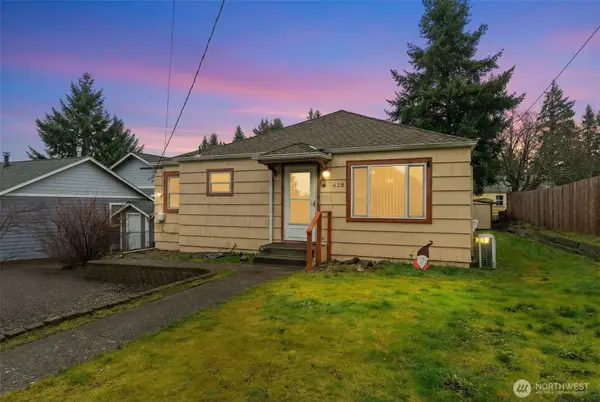 $320,000Active2 beds 1 baths1,259 sq. ft.
628 N Charlotte Avenue, Bremerton, WA 98312
MLS# 2484113Listed by: GOLDHOUSE REALTY $565,000Active4 beds 3 baths2,050 sq. ft.
1177 SW Pendleton Way, Port Orchard, WA 98367
MLS# 2485052Listed by: KELLER WILLIAMS EASTSIDE $550,000Pending3 beds 3 baths2,861 sq. ft.
26081 Tytler Road Ne, Poulsbo, WA 98370
MLS# 2482082Listed by: JOHN L. SCOTT, INC. $425,000Active2 beds 1 baths1,248 sq. ft.
4201 Robinson Road Ne, Bremerton, WA 98310
MLS# 2482443Listed by: RE/MAX EXCLUSIVE $500,000Active3 beds 2 baths1,273 sq. ft.
4517 Bay Vista Boulevard, Bremerton, WA 98312
MLS# 2484596Listed by: EXP REALTY $1,120,000Active3 beds 3 baths1,980 sq. ft.
5540 SW Old Clifton Road, Port Orchard, WA 98367
MLS# 2474845Listed by: PARAMOUNT REAL ESTATE GROUP $525,000Pending3 beds 2 baths1,486 sq. ft.
2025 NW Mulholland Boulevard, Poulsbo, WA 98370
MLS# 2481780Listed by: RE/MAX NORTHWEST $415,000Pending3 beds 2 baths1,227 sq. ft.
2421 Lodgepole Drive Se, Port Orchard, WA 98366
MLS# 2482984Listed by: KELLER WILLIAMS WEST SOUND $448,999Pending2 beds 2 baths2,059 sq. ft.
3110 11th Street, Bremerton, WA 98312
MLS# 2483979Listed by: NEXTHOME PROLIFIC $1,798,000Pending4 beds 4 baths3,232 sq. ft.
4516 Island Avenue Ne, Bainbridge Island, WA 98110
MLS# 2482712Listed by: BAINBRIDGE HOMES REAL ESTATE $420,000Active3 beds 1 baths1,328 sq. ft.
3520 Berger Place Se, Port Orchard, WA 98366
MLS# 2484233Listed by: WINDERMERE RE/HIMLIE $1,895,000Pending4 beds 4 baths3,514 sq. ft.
13221 Teem Loop Road Ne, Bainbridge Island, WA 98110
MLS# 2483864Listed by: REALOGICS SOTHEBY'S INT'L RLTY $235,000Active2 beds 2 baths965 sq. ft.
924 Shorewood Drive #B16, Bremerton, WA 98312
MLS# 2482146Listed by: WINDERMERE PROF PARTNERS $650,000Pending3 beds 2 baths1,456 sq. ft.
1049 Madison Avenue N, Bainbridge Island, WA 98110
MLS# 2484125Listed by: WINDERMERE RE BAINBRIDGE $285,000Active5.28 Acres
8985 SW Lake Flora Road #5, Port Orchard, WA 98367
MLS# 2484500Listed by: WINDERMERE PROF PARTNERS $325,000Active2 beds 1 baths860 sq. ft.
465 Winslow Way E #206, Bainbridge Island, WA 98110
MLS# 2484546Listed by: JOHANSSON CLARK REAL ESTATE- Open Wed, 10am to 5:30pm
 $774,990Active3 beds 3 baths2,460 sq. ft.
10691 Treasure Drive Nw #112, Silverdale, WA 98383
MLS# 2484700Listed by: RICHMOND REALTY OF WASHINGTON  $425,000Active3 beds 1 baths1,900 sq. ft.
327 N Marion Avenue, Bremerton, WA 98312
MLS# 2484601Listed by: WINDERMERE PENINSULAPROPERTIES $2,225,000Pending3 beds 3 baths2,875 sq. ft.
9549 Olympus Beach Road Ne, Bainbridge Island, WA 98110
MLS# 2482898Listed by: BAINBRIDGE HOMES REAL ESTATE $2,198,000Active3 beds 3 baths2,405 sq. ft.
15451 Harvey Road Ne, Bainbridge Island, WA 98110
MLS# 2483608Listed by: WINDERMERE RE BAINBRIDGE $1,046,370Active3 beds 4 baths2,808 sq. ft.
5487 Skyfall Place Nw, Bremerton, WA 98312
MLS# 2482116Listed by: REDFIN $525,000Active2 beds 2 baths1,404 sq. ft.
3897 Christine Lane Nw, Bremerton, WA 98312
MLS# 2483888Listed by: PARAMOUNT REAL ESTATE GROUP $549,900Pending3 beds 3 baths2,300 sq. ft.
7500 NE Harborview Drive, Poulsbo, WA 98370
MLS# 2484412Listed by: KELLY RIGHT RE OF SPOKANE LLC $775,000Active3 beds 2 baths4,701 sq. ft.
5978 Mccormick Woods Drive Sw, Port Orchard, WA 98367
MLS# 2483490Listed by: ALL IN ONE REAL ESTATE $440,000Pending3 beds 3 baths1,374 sq. ft.
3616 W Arsenal Way, Bremerton, WA 98312
MLS# 2483424Listed by: REALOGICS SOTHEBY'S INT'L RLTY $545,000Pending4 beds 3 baths2,095 sq. ft.
256 NE Tronson Circle, Bremerton, WA 98311
MLS# 2477133Listed by: KELLER WILLIAMS GREATER 360 $132,500Active0.46 Acres
0 Beach Drive E, Port Orchard, WA 98366
MLS# 2472511Listed by: RE/MAX EXCLUSIVE $335,000Active2 beds 2 baths1,304 sq. ft.
3268 NW Erlands Court, Bremerton, WA 98312
MLS# 2481998Listed by: PARAMOUNT REAL ESTATE GROUP $1,002,947Pending3 beds 3 baths2,849 sq. ft.
23540 Marinwood Circle Ne #02713, Kingston, WA 98346
MLS# 2478031Listed by: PULTE HOMES OF WASHINGTON INC $429,000Pending3 beds 2 baths1,296 sq. ft.
5435 Bunker Street Nw, Bremerton, WA 98311
MLS# 2481415Listed by: JOHN L. SCOTT, INC.
 $469,000Pending4 beds 3 baths1,406 sq. ft.
7505 Bridge Place Ne, Bremerton, WA 98311
MLS# 2483527Listed by: CENTURY 21 NORTH HOMES REALTY $725,000Active3 beds 4 baths3,800 sq. ft.
8875 Banner Road Se, Port Orchard, WA 98367
MLS# 2482762Listed by: COLDWELL BANKER PARK SHORE RE $614,900Active3 beds 3 baths2,520 sq. ft.
4368 Chatterton Avenue Sw, Port Orchard, WA 98367
MLS# 2483663Listed by: EXP REALTY $525,000Pending5 beds 2 baths1,950 sq. ft.
611 NE Conifer Drive, Bremerton, WA 98311
MLS# 2479959Listed by: EXP REALTY $515,000Pending-- beds -- baths2,652 sq. ft.
3995 Chico Way Nw, Bremerton, WA 98312
MLS# 2483459Listed by: REID PROPERTY MANAGEMENT LLC $779,900Pending4 beds 3 baths2,786 sq. ft.
4484 Benita Place Ne, Bremerton, WA 98310
MLS# 2483330Listed by: KELLER WILLIAMS GREATER 360 $405,000Active3 beds 3 baths1,426 sq. ft.
755 Glenridge Court, Bremerton, WA 98310
MLS# 2477788Listed by: PARAMOUNT REAL ESTATE GROUP $943,995Active4 beds 5 baths4,016 sq. ft.
4051 Wandering Way, Port Orchard, WA 98367
MLS# 2483185Listed by: TEAMBUILDER KW $379,000Pending3 beds 1 baths1,350 sq. ft.
465 Winslow Way E #108, Bainbridge Island, WA 98110
MLS# 2483163Listed by: COMPASS $399,950Pending3 beds 2 baths1,120 sq. ft.
912 Austin Avenue, Port Orchard, WA 98366
MLS# 2482164Listed by: THEORY REAL ESTATE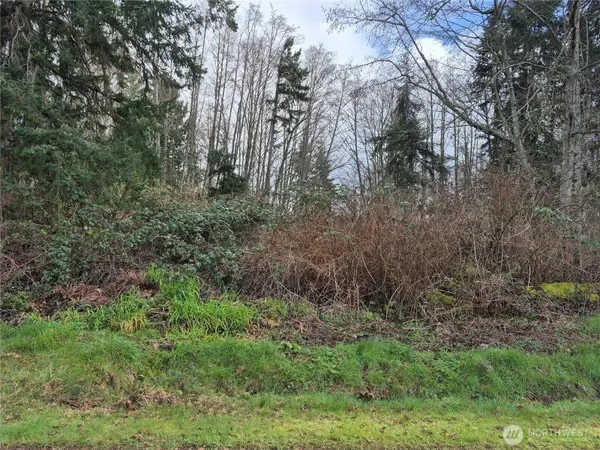 $189,000Active0.64 Acres
38766 Tinker Place Ne #15, Hansville, WA 98340
MLS# 2482894Listed by: WINDERMERE RE WEST SOUND INC.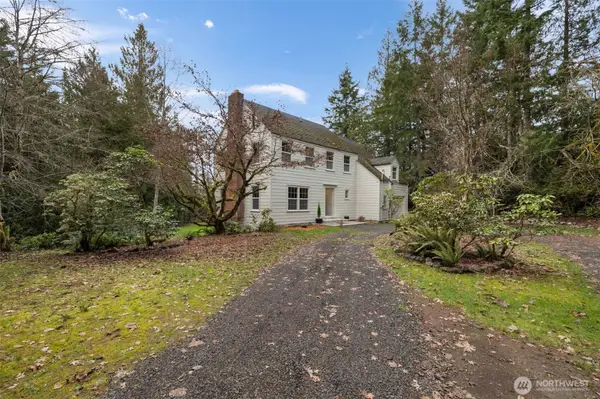 $749,900Active4 beds 4 baths3,368 sq. ft.
9520 Dishman Road Nw, Bremerton, WA 98312
MLS# 2478809Listed by: MARTIN REAL ESTATE GROUP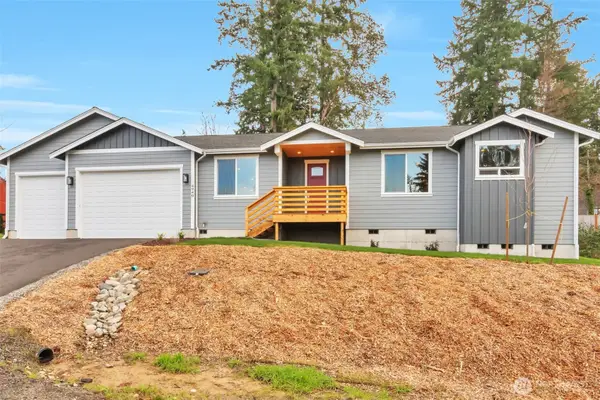 $719,000Active3 beds 2 baths2,206 sq. ft.
4940 Johnson Street Nw, Bremerton, WA 98311
MLS# 2480268Listed by: JOHN L. SCOTT, INC.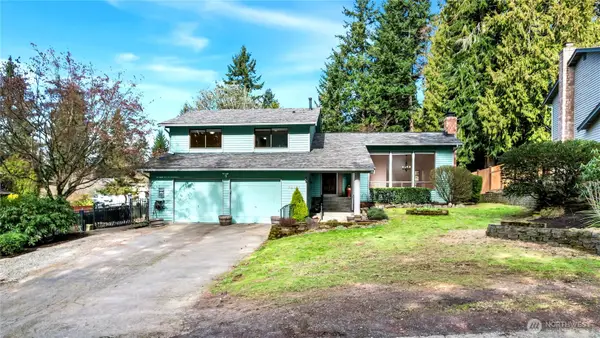 $585,000Pending4 beds 3 baths2,420 sq. ft.
7900 NE Forest Ridge Lane, Bremerton, WA 98311
MLS# 2480436Listed by: REDFIN $95,000Active2.47 Acres
216 Bond Road Ne, Poulsbo, WA 98370
MLS# 2481590Listed by: KW MOUNTAINS TO SOUND REALTY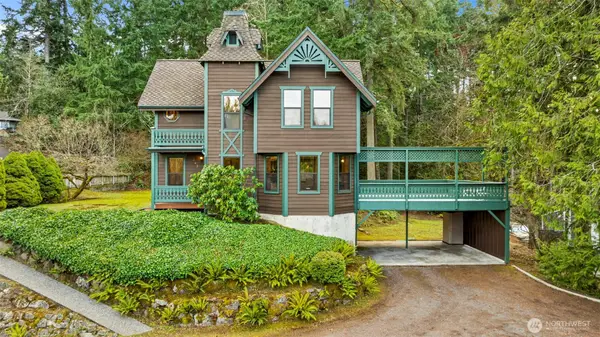 $625,000Pending3 beds 3 baths2,458 sq. ft.
243 NW Solnae Place, Bremerton, WA 98311
MLS# 2482819Listed by: STERLING PROPERTY GROUP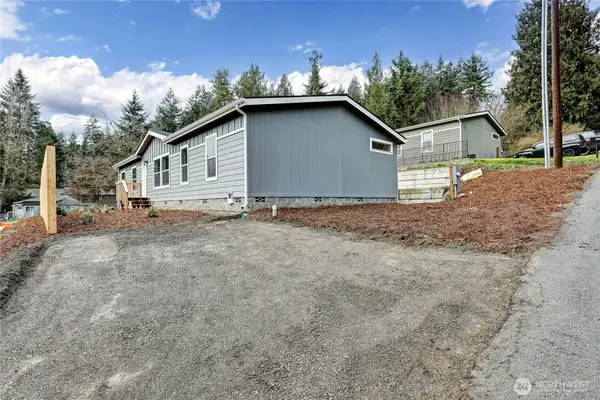 $429,950Pending4 beds 2 baths1,600 sq. ft.
3613 Burwell Street, Bremerton, WA 98312
MLS# 2483008Listed by: BETTER PROPERTIES GIG HARBOR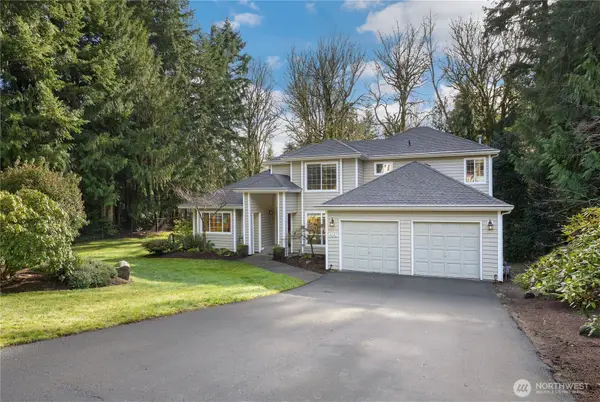 $739,000Active3 beds 3 baths2,343 sq. ft.
4642 SE Parsons Green Court, Port Orchard, WA 98367
MLS# 2475588Listed by: REDFIN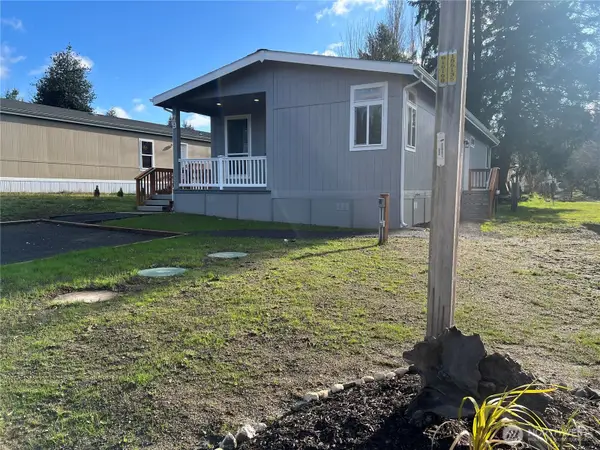 $189,900Active2 beds 2 baths1,344 sq. ft.
3371 SE Bielmeier Road #79, Port Orchard, WA 98367
MLS# 2479865Listed by: BETTER HOMES AND GARDENS RE PC $152,500Active2 beds 2 baths960 sq. ft.
3371 SE Bielmeier Road #33A, Port Orchard, WA 98367
MLS# 2479871Listed by: BETTER HOMES AND GARDENS RE PC $889,000Active3 beds 2 baths2,096 sq. ft.
5825 Ray Road Se, Port Orchard, WA 98367
MLS# 2482347Listed by: PACIFIC RESIDENTIAL BROKERS $449,900Pending3 beds 1 baths2,352 sq. ft.
705 Hull Avenue, Port Orchard, WA 98366
MLS# 2482836Listed by: KELLER WILLIAMS RTY TACOMA $580,000Pending3 beds 3 baths1,454 sq. ft.
23013 Peaceful Place Nw, Poulsbo, WA 98370
MLS# 2482905Listed by: EXP REALTY $575,000Pending4 beds 3 baths2,166 sq. ft.
7614 Orcas Place Nw, Bremerton, WA 98311
MLS# 2480263Listed by: REDFIN $599,777Active3 beds 3 baths2,376 sq. ft.
2750 California Avenue E, Port Orchard, WA 98366
MLS# 2481118Listed by: PARAMOUNT REAL ESTATE GROUP $2,050,000Pending5 beds 5 baths4,345 sq. ft.
8722 NE Winslow Grove Court, Bainbridge Island, WA 98110
MLS# 2481420Listed by: WINDERMERE RE BAINBRIDGE $895,000Pending3 beds 3 baths2,620 sq. ft.
6691 NE Buck Lake Road, Hansville, WA 98340
MLS# 2482144Listed by: PARAMOUNT REAL ESTATE GROUP $519,949Pending3 beds 3 baths2,312 sq. ft.
4520 Victory Place Sw, Port Orchard, WA 98367
MLS# 2482774Listed by: BEST CHOICE REALTY LLC $550,000Pending3 beds 3 baths1,573 sq. ft.
3039 SE Grovewood Street, Port Orchard, WA 98367
MLS# 2480450Listed by: REDFIN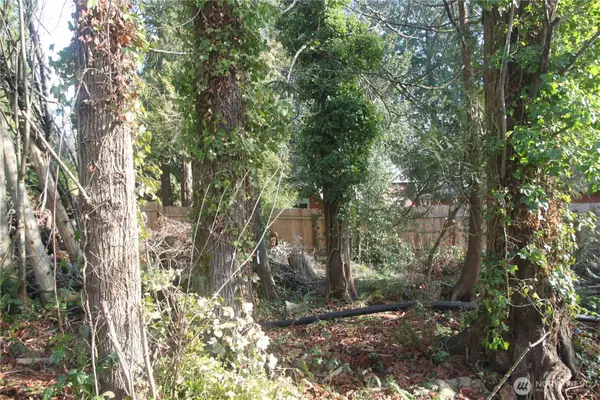 $99,000Active0.15 Acres
0 NE Columbia Street, Suquamish, WA 98392
MLS# 2482406Listed by: WINDERMERE RE WEST SOUND INC. $450,000Pending3 beds 3 baths1,484 sq. ft.
4241 Big Beef Crossing Nw, Bremerton, WA 98312
MLS# 2482843Listed by: DALE WALTERS REAL ESTATE $699,900Active3 beds 2 baths1,615 sq. ft.
7217 NW Scomanov Lane, Olalla, WA 98359
MLS# 2480029Listed by: REDFIN $499,000Pending3 beds 3 baths1,773 sq. ft.
3380 SE Carmae Drive, Port Orchard, WA 98366
MLS# 2482440Listed by: 360 REAL ESTATE GROUP $599,999Pending5 beds 3 baths2,788 sq. ft.
4570 SE Bakken Court, Port Orchard, WA 98366
MLS# 2482469Listed by: REAL BROKER LLC $875,000Pending4 beds 5 baths3,652 sq. ft.
2520 Vardon Circle Sw, Port Orchard, WA 98367
MLS# 2475257Listed by: KELLY RIGHT RE OF SEATTLE LLC $305,000Active1 beds 1 baths425 sq. ft.
926 Austin Avenue, Port Orchard, WA 98366
MLS# 2482736Listed by: BERKSHIRE HATHAWAY HS NW $515,000Active4 beds 2 baths2,306 sq. ft.
1325 Carr Boulevard, Bremerton, WA 98312
MLS# 2470349Listed by: KELLER WILLIAMS WEST SOUND $825,000Active3 beds 3 baths2,025 sq. ft.
6388 Marymere Road Sw, Port Orchard, WA 98367
MLS# 2482187Listed by: INFINITY REAL ESTATE, LLC- Open Wed, 10am to 5:30pm
 $749,990Active4 beds 3 baths2,540 sq. ft.
10655 Treasure Drive Nw #118, Silverdale, WA 98383
MLS# 2482697Listed by: RICHMOND REALTY OF WASHINGTON  $449,995Pending3 beds 1 baths1,612 sq. ft.
1219 Poindexter Avenue, Bremerton, WA 98312
MLS# 2482613Listed by: PREMIER REAL ESTATE PARTNERS $1,600,000Active4.16 Acres
1110 Bethel Avenue, Port Orchard, WA 98366
MLS# 2482680Listed by: G ANDERSON GROUP LLC $350,000Active0.58 Acres
1870 Pottery Avenue #C, Port Orchard, WA 98366
MLS# 2482689Listed by: G ANDERSON GROUP LLC- Open Sat, 1 to 3pm
 $699,000Active4 beds 3 baths2,859 sq. ft.
4892 Amherst Way Sw, Port Orchard, WA 98367
MLS# 2481913Listed by: KELLER WILLIAMS GREATER 360  $665,000Active5 beds 3 baths2,587 sq. ft.
3360 SW Anchorage Lane, Port Orchard, WA 98367
MLS# 2481409Listed by: JOHN L. SCOTT, INC $767,741Active4 beds 3 baths2,472 sq. ft.
23839 Marinwood Circle Ne #03612, Kingston, WA 98370
MLS# 2464923Listed by: PULTE HOMES OF WASHINGTON INC $475,000Active3 beds 2 baths1,326 sq. ft.
6120 Elaine Court, Bremerton, WA 98312
MLS# 2481696Listed by: THE JOSEPH GROUP $749,000Pending3 beds 3 baths2,296 sq. ft.
9240 Priddy Vista Road Nw, Seabeck, WA 98380
MLS# 2482073Listed by: DRIFTWOOD REAL ESTATE $600,000Active3 beds 3 baths1,643 sq. ft.
1404 Eastlake Drive, Bremerton, WA 98312
MLS# 2482143Listed by: KELLER WILLIAMS GREATER 360 $1,299,000Active4 beds 4 baths3,448 sq. ft.
8609 E Caraway Road, Port Orchard, WA 98366
MLS# 2482233Listed by: COLDWELL BANKER PARK SHORE RE $699,000Pending2 beds 2 baths2,316 sq. ft.
2041 Ptarmigan Lane Nw, Poulsbo, WA 98370
MLS# 2481884Listed by: COLDWELL BANKER BAIN $699,000Pending3 beds 3 baths2,119 sq. ft.
2554 Sand Dollar Road W, Bremerton, WA 98312
MLS# 2480256Listed by: REDFIN $625,000Pending4 beds 3 baths2,411 sq. ft.
1945 Kaster Court Ne, Bremerton, WA 98311
MLS# 2481084Listed by: WINDERMERE RE WEST SOUND INC. $440,000Pending2 beds 2 baths1,178 sq. ft.
27525 NE Baywood Drive, Kingston, WA 98346
MLS# 2481764Listed by: CHARTER REAL ESTATE $519,000Pending3 beds 3 baths1,832 sq. ft.
5055 Sherlyn Avenue Se, Port Orchard, WA 98367
MLS# 2481794Listed by: MANETTE REAL ESTATE CO. $310,000Active3 beds 3 baths1,134 sq. ft.
3945 NW Fairway Lane #1-J, Bremerton, WA 98312
MLS# 2482115Listed by: REID PROPERTY MANAGEMENT LLC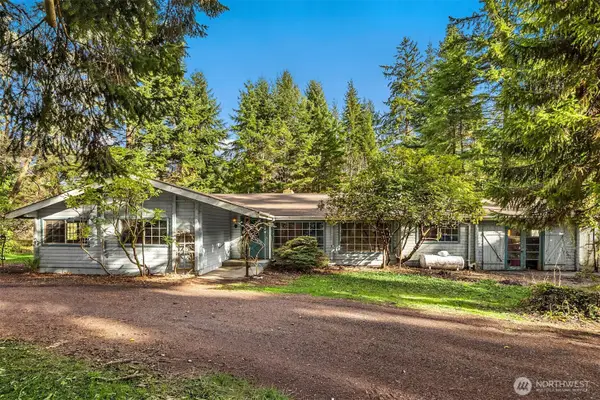 $688,000Pending4 beds 2 baths2,348 sq. ft.
10862 Falk Road Ne, Bainbridge Island, WA 98110
MLS# 2480060Listed by: WINDERMERE RE BAINBRIDGE $1,490,000Active4 beds 3 baths3,223 sq. ft.
14130 Sandy Hook Road Ne, Poulsbo, WA 98383
MLS# 2481204Listed by: COMPASS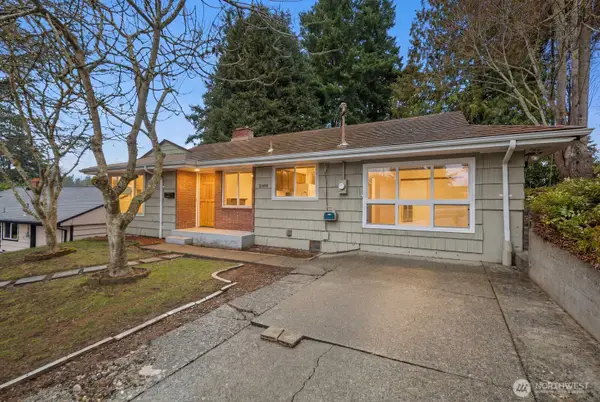 $399,000Pending2 beds 1 baths1,306 sq. ft.
2108 E 24th Street, Bremerton, WA 98310
MLS# 2481454Listed by: WINDERMERE RE WEST SOUND INC.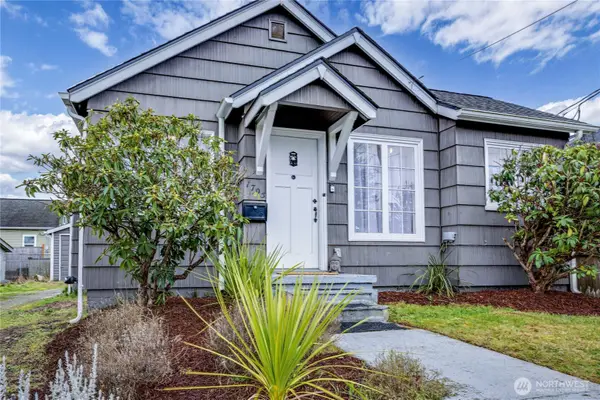 $355,000Pending2 beds 1 baths656 sq. ft.
1705 13th Street, Bremerton, WA 98337
MLS# 2475487Listed by: CHARTER REAL ESTATE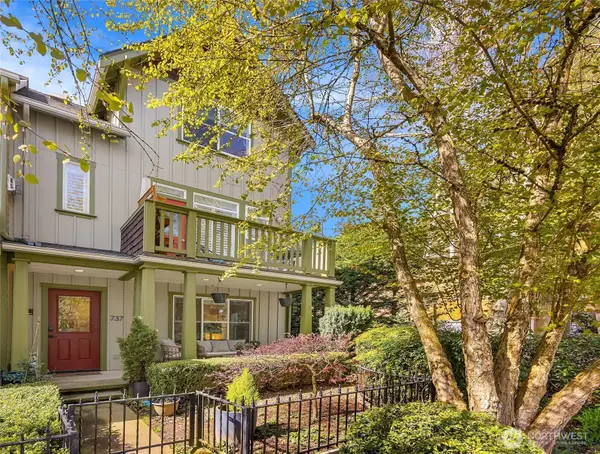 $839,000Active3 beds 4 baths1,651 sq. ft.
737 Madison Avenue N #30, Bainbridge Island, WA 98110
MLS# 2476449Listed by: REALOGICS SOTHEBY'S INT'L RLTY $820,000Active3 beds 2 baths1,468 sq. ft.
5344 Ruby Place Ne, Bainbridge Island, WA 98110
MLS# 2480354Listed by: WINDERMERE RE BAINBRIDGE $1,389,000Pending4 beds 3 baths3,232 sq. ft.
8997 Springwood Avenue Ne, Bainbridge Island, WA 98110
MLS# 2480693Listed by: BAINBRIDGE HOMES REAL ESTATE $545,000Pending3 beds 3 baths1,462 sq. ft.
4172 Forest Drive Ne, Bremerton, WA 98310
MLS# 2481958Listed by: KELLER WILLIAMS GREATER 360 $595,000Pending3 beds 3 baths1,364 sq. ft.
10583 NE West Kingston Road, Kingston, WA 98346
MLS# 2472608Listed by: WINDERMERE PROF PARTNERS $1,100,000Pending3 beds 3 baths2,994 sq. ft.
24376 Fjord Place Nw, Poulsbo, WA 98370
MLS# 2480794Listed by: REDFIN $490,000Pending3 beds 3 baths1,437 sq. ft.
22295 Wavecrest Avenue Ne, Poulsbo, WA 98370
MLS# 2481743Listed by: WINDERMERE RE WEST SOUND INC. $1,798,000Active3 beds 2 baths2,012 sq. ft.
7204 NE Baker Hill Road, Bainbridge Island, WA 98110
MLS# 2479388Listed by: REALOGICS SOTHEBY'S INT'L RLTY $639,950Active2 beds 3 baths1,232 sq. ft.
346 Wyatt Way Ne #10, Bainbridge Island, WA 98110
MLS# 2482092Listed by: REAL PROPERTY ASSOCIATES $225,000Active1 beds 1 baths698 sq. ft.
3390 Narrows Lane Ne #101, Bremerton, WA 98310
MLS# 2481152Listed by: JOHN L. SCOTT, INC. $1,169,900Active3 beds 3 baths2,909 sq. ft.
5541 Skyfall Place Nw, Bremerton, WA 98312
MLS# 2481861Listed by: CONGRESS REALTY $220,000Active0.25 Acres
24700 Taree Boulevard Ne, Kingston, WA 98346
MLS# 2479859Listed by: PARAMOUNT REAL ESTATE GROUP $475,000Active3 beds 3 baths1,689 sq. ft.
1025 12th Street, Bremerton, WA 98337
MLS# 2464459Listed by: WINDERMERE RE WEST SOUND INC. $207,000Active2 beds 2 baths1,200 sq. ft.
6897 Capricorn Lane Ne, Bremerton, WA 98311
MLS# 2475813Listed by: WINDERMERE RE WEST SOUND INC. $878,000Pending3 beds 2 baths1,632 sq. ft.
5836 Battle Point Drive Ne, Bainbridge Island, WA 98110
MLS# 2481554Listed by: WINDERMERE RE BAINBRIDGE $699,000Active0.91 Acres
4830 Bethel Road Se, Port Orchard, WA 98367
MLS# 2481546Listed by: G ANDERSON GROUP LLC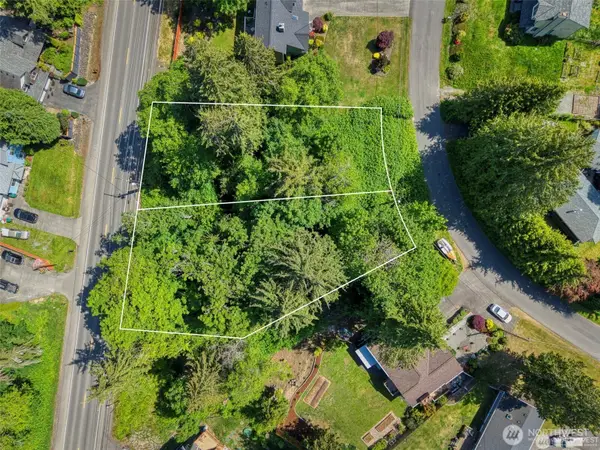 $200,000Active0.65 Acres
24115 Madura Drive Ne, Kingston, WA 98346
MLS# 2480697Listed by: WINDERMERE RE WEST SOUND INC.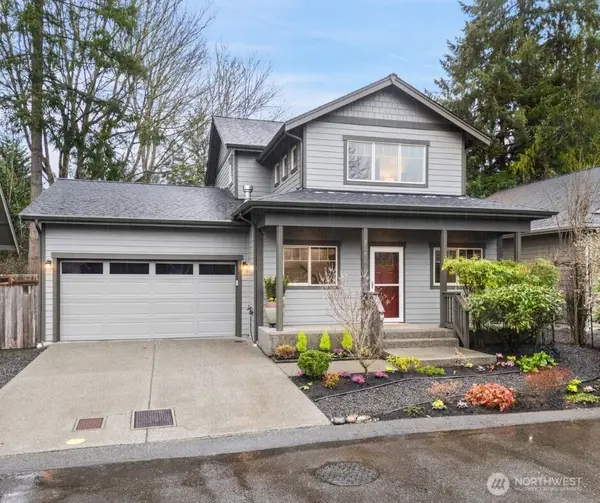 $595,000Pending3 beds 3 baths1,447 sq. ft.
25794 Arklow Place Ne, Kingston, WA 98346
MLS# 2480843Listed by: KELLER WILLIAMS WEST SOUND $210,000Active5.04 Acres
233 State Highway 3 Nw #11, Poulsbo, WA 98370
MLS# 2481202Listed by: KW MOUNTAINS TO SOUND REALTY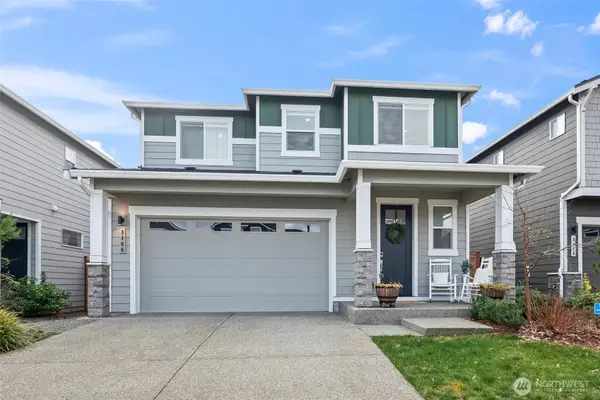 $699,995Pending5 beds 3 baths2,587 sq. ft.
3400 SW Anchorage Lane, Port Orchard, WA 98367
MLS# 2480581Listed by: JOHN L. SCOTT R.E.TACOMA NORTH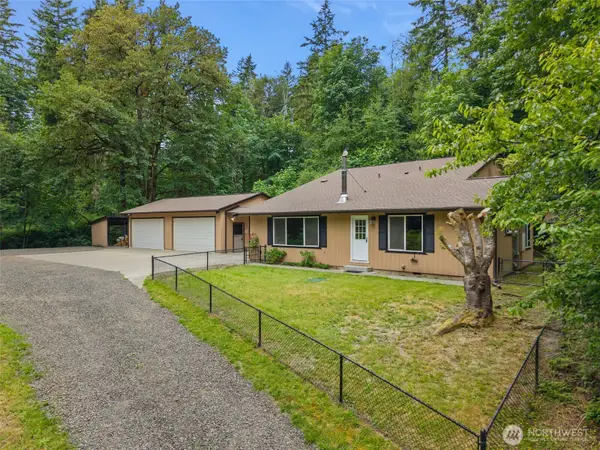 $685,000Active3 beds 2 baths2,096 sq. ft.
4562 SE Burley Olalla Road, Olalla, WA 98359
MLS# 2476174Listed by: PARAMOUNT REAL ESTATE GROUP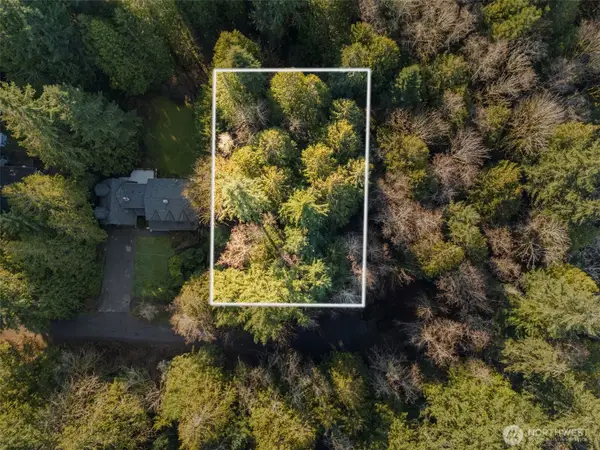 $129,700Pending0.55 Acres
7911 NE Sunnywoods Lane, Kingston, WA 98346
MLS# 2480945Listed by: FATHOM REALTY WA LLC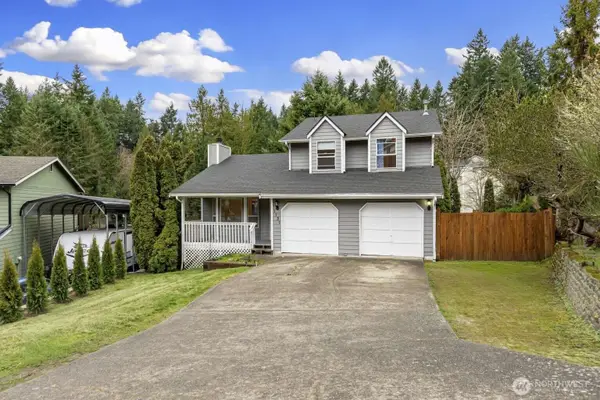 $525,000Pending3 beds 3 baths1,657 sq. ft.
1131 NW Springer, Silverdale, WA 98383
MLS# 2481007Listed by: CONGRESS REALTY $56,999Active0.35 Acres
315 Constitution Avenue S, Bremerton, WA 98312
MLS# 2481010Listed by: PLATLABS, LLC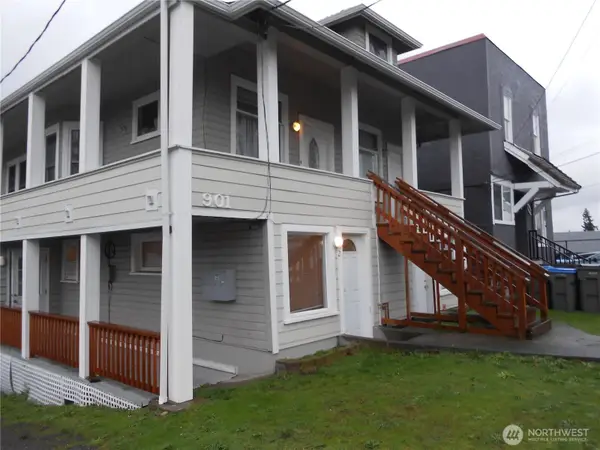 $699,000Pending-- beds -- baths2,759 sq. ft.
901 Pleasant Avenue, Bremerton, WA 98337
MLS# 2480859Listed by: BOB GUARDINO REAL ESTATE SRVS $599,000Pending3 beds 3 baths1,720 sq. ft.
7103 E Chester Road, Port Orchard, WA 98366
MLS# 2480631Listed by: EMERALD REAL ESTATE GROUP INC. $495,000Pending3 beds 2 baths1,342 sq. ft.
39017 Sherlind Drive Ne, Hansville, WA 98340
MLS# 2472259Listed by: WINDERMERE RE WEST SOUND INC. $819,060Pending5 beds 4 baths3,014 sq. ft.
23539 Marinwood Circle Ne #03113, Kingston, WA 98346
MLS# 2478027Listed by: PULTE HOMES OF WASHINGTON INC- Open Wed, 10:30am to 5:30pm
 $597,950Active4 beds 3 baths2,330 sq. ft.
22200 Jameson Avenue Nw #25, Poulsbo, WA 98370
MLS# 2477708Listed by: KB HOME SALES  $594,950Pending3 beds 3 baths2,350 sq. ft.
1852 NW Nahele Court #65, Poulsbo, WA 98370
MLS# 2389616Listed by: KB HOME SALES $550,000Active3 beds 2 baths2,936 sq. ft.
13607 W Raven Lane, Bremerton, WA 98312
MLS# 2479602Listed by: JOHN L. SCOTT, INC. $120,000Active3 beds 2 baths1,188 sq. ft.
857 Mahogany Lane Nw, Silverdale, WA 98383
MLS# 2480585Listed by: JOHN L. SCOTT, INC. $282,900Pending2 beds 2 baths1,005 sq. ft.
1725 W Sunn Fjord Lane #J304, Bremerton, WA 98312
MLS# 2480147Listed by: INSPIRE REALTY $1,895,000Pending4 beds 5 baths3,223 sq. ft.
139 Duane Lane Nw, Bainbridge Island, WA 98110
MLS# 2480019Listed by: THE AGENCY BAINBRIDGE ISLAND $717,562Pending3 beds 2 baths1,829 sq. ft.
23406 Marinwood Circle Ne #01912, Kingston, WA 98346
MLS# 2480646Listed by: PULTE HOMES OF WASHINGTON INC- Open Thu, 11am to 3pm
 $805,603Active4 beds 3 baths2,329 sq. ft.
23827 Marinwood Circle Ne #03512, Kingston, WA 98346
MLS# 2478374Listed by: PULTE HOMES OF WASHINGTON INC  $1,730,000Active4 beds 4 baths3,792 sq. ft.
8784 NE Winslow Grove Court, Bainbridge Island, WA 98110
MLS# 2472125Listed by: JOHN L. SCOTT, INC. $540,000Active3 beds 3 baths2,150 sq. ft.
2729 SW Egret Street, Port Orchard, WA 98367
MLS# 2480599Listed by: JOHN L. SCOTT, INC. $547,000Pending3 beds 3 baths1,560 sq. ft.
849 NW Pioneer Hill Road, Poulsbo, WA 98370
MLS# 2478441Listed by: KELLER WILLIAMS GREATER 360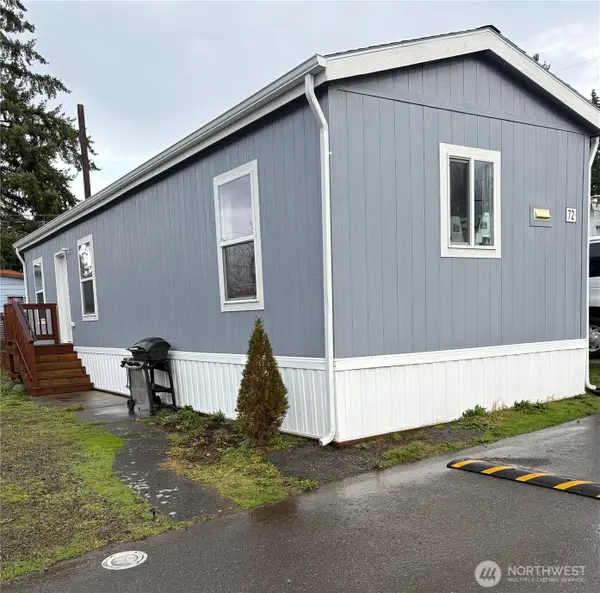 $70,000Active3 beds 1 baths643 sq. ft.
4024 NW Country Lane #72, Bremerton, WA 98312
MLS# 2480564Listed by: KW MOUNTAINS TO SOUND REALTY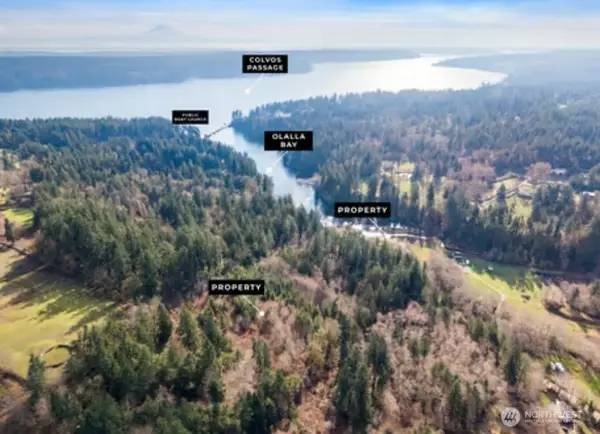 $290,000Active11.04 Acres
0 Olalla Valley Road Se, Olalla, WA 98359
MLS# 2478902Listed by: RE/MAX EXCLUSIVE $599,000Pending1 beds 2 baths992 sq. ft.
13095 Lake Shore Drive Nw, Poulsbo, WA 98370
MLS# 2480364Listed by: CRAFTED REAL ESTATE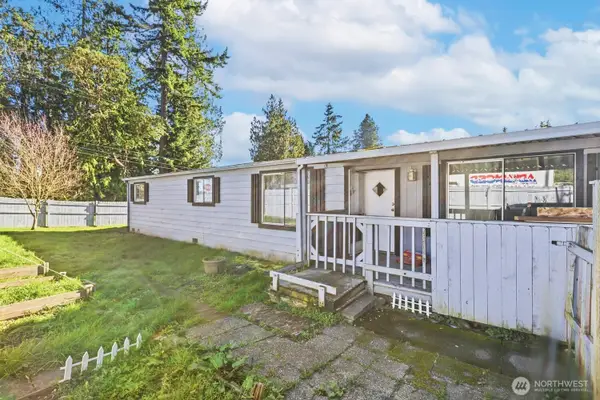 $275,000Active3 beds 2 baths1,423 sq. ft.
7275 NE Geneva Street, Suquamish, WA 98392
MLS# 2480533Listed by: KW LAKE WASHINGTON SO- Open Sat, 11am to 1pm
 $650,000Active3 beds 2 baths1,456 sq. ft.
13080 Old Military Road Ne, Poulsbo, WA 98370
MLS# 2480371Listed by: EXP REALTY 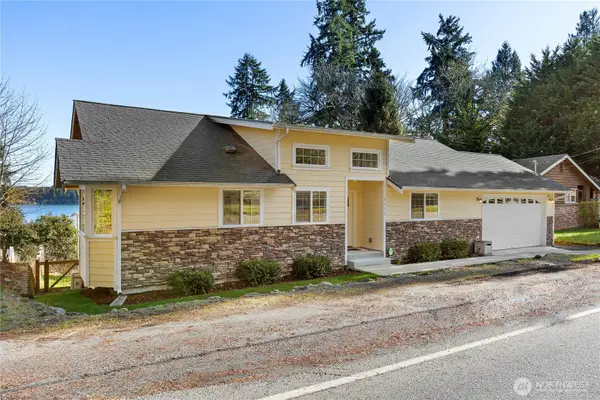 $769,999Active3 beds 3 baths2,984 sq. ft.
8498 Illahee Road Ne, Bremerton, WA 98311
MLS# 2469532Listed by: COLDWELL BANKER BAIN $624,900Pending4 beds 2 baths1,782 sq. ft.
15080 Wilcox Road Nw, Poulsbo, WA 98370
MLS# 2480466Listed by: INTEGRIS REAL ESTATE $725,000Pending3 beds 2 baths2,091 sq. ft.
14825 NW Holly Road, Seabeck, WA 98380
MLS# 2479481Listed by: KELLER WILLIAMS GREATER 360 $569,000Pending3 beds 3 baths1,848 sq. ft.
2037 NE Ridgewood Drive, Poulsbo, WA 98370
MLS# 2472697Listed by: WHISPER REAL ESTATE $249,950Active6.7 Acres
6 NW Seabeck Holly Road, Seabeck, WA 98380
MLS# 2480438Listed by: WINDERMERE RE WEST SOUND INC. $569,500Pending4 beds 3 baths2,100 sq. ft.
2234 NE Goldenrod Avenue, Bremerton, WA 98311
MLS# 2472756Listed by: WINDERMERE RE WEST SOUND INC. $469,000Pending3 beds 3 baths1,748 sq. ft.
3661 NE Liverpool Drive, Bremerton, WA 98311
MLS# 2475151Listed by: KELLER WILLIAMS GREATER 360 $1,500,000Active2 beds 3 baths2,592 sq. ft.
23884 Jefferson Beach Road Ne, Kingston, WA 98346
MLS# 2474820Listed by: KITSAP BROKERS LLC- Open Wed, 1 to 4:30pm
 $724,990Active5 beds 3 baths2,741 sq. ft.
4143 Rustler Street Sw, Port Orchard, WA 98367
MLS# 2477094Listed by: BMC REALTY ADVISORS INC - Open Wed, 1 to 4:30pm
 $599,990Active3 beds 2 baths2,099 sq. ft.
5980 Thornhill Avenue Sw, Port Orchard, WA 98367
MLS# 2479597Listed by: BMC REALTY ADVISORS INC  $1,388,000Active4 beds 4 baths2,704 sq. ft.
8355 Medway Lane Ne, Bainbridge Island, WA 98110
MLS# 2480046Listed by: REALOGICS SOTHEBY'S INT'L RLTY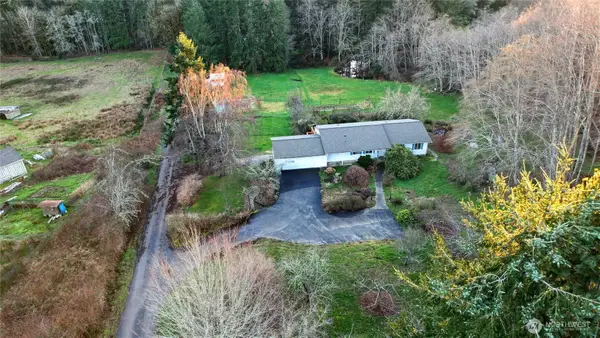 $675,000Pending3 beds 2 baths2,964 sq. ft.
13082 Olalla Valley Road Se, Olalla, WA 98359
MLS# 2477345Listed by: REDFIN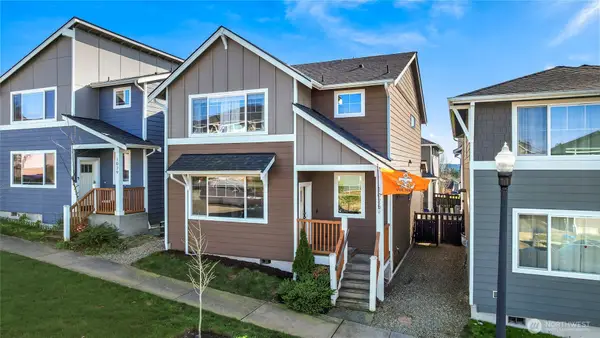 $479,900Pending3 beds 3 baths1,629 sq. ft.
1025 Banyan Street, Bremerton, WA 98310
MLS# 2478146Listed by: REDFIN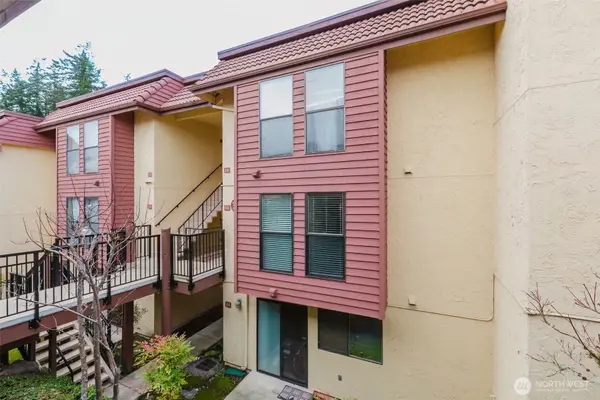 $259,500Active2 beds 2 baths956 sq. ft.
1775 W Sunn Fjord Lane #A-10, Bremerton, WA 98312
MLS# 2478567Listed by: BOB GUARDINO REAL ESTATE SRVS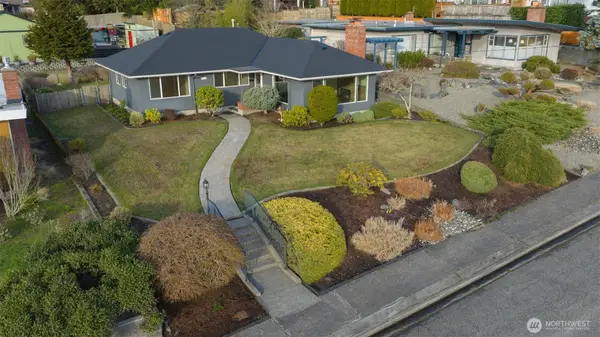 $499,999Pending3 beds 1 baths1,331 sq. ft.
2110 E 17th Street, Bremerton, WA 98310
MLS# 2478689Listed by: JOHN L. SCOTT, INC.
Local realty services provided by:CENTURY 21 Tri-Cities
Listings courtesy of Northwest MLS as distributed by MLS GRID. Based on information submitted to the MLS GRID as of March 11, 2026. All data is obtained from various sources and may not have been verified by broker or MLS GRID. Supplied Open House Information is subject to change without notice. All information should be independently reviewed and verified for accuracy. Properties may or may not be listed by the office/agent presenting the information. Listing information is provided for consumers' personal, non-commercial use, solely to identify prospective properties for potential purchase; all other use is strictly prohibited and may violate relevant federal and state law. Information deemed reliable but not guaranteed. Copyright © 2026 MLS GRID. All Rights Reserved.
Popular searches near Kitsap County, WA
Popular neighborhoods near Kitsap County, WA
- Briarcliff, Seattle homes for sale
- Chico, Silverdale homes for sale
- Enetai, Bremerton homes for sale
- Erland's Point, Bremerton homes for sale
- Indianola, Indianola homes for sale
- Keyport, Keyport homes for sale
- Kingston, Kingston homes for sale
- Lawton Park, Seattle homes for sale
- Lofall, Poulsbo homes for sale
- Manette, Bremerton homes for sale
- Marine Drive, Bremerton homes for sale
- Navy Yard City, Bremerton homes for sale
- Rocky Point, Bremerton homes for sale
- Seabeck, Seabeck homes for sale
- Sheridan Park, Bremerton homes for sale
- Silverdale, Silverdale homes for sale
- South Toandos Peninsula, Quilcene homes for sale
- Sunset Hill, Seattle homes for sale
- Suquamish, Poulsbo homes for sale
- Tracyton, Bremerton homes for sale
Zip codes near Kitsap County, WA
- 98103 homes for sale
- 98107 homes for sale
- 98109 homes for sale
- 98110 homes for sale
- 98116 homes for sale
- 98117 homes for sale
- 98119 homes for sale
- 98133 homes for sale
- 98177 homes for sale
- 98199 homes for sale
- 98310 homes for sale
- 98311 homes for sale
- 98312 homes for sale
- 98337 homes for sale
- 98345 homes for sale
- 98346 homes for sale
- 98366 homes for sale
- 98370 homes for sale
- 98383 homes for sale
- 98392 homes for sale
Protect your home and budget from life's surprises with an Assurant Home Warranty, backed by a partner that supports you through every step of homeownership. Explore Plans.
©2026 Century 21 Real Estate LLC. All rights reserved. CENTURY 21®, the CENTURY 21 Logo and C21® are service marks owned by Century 21 Real Estate LLC. Century 21 Real Estate LLC fully supports the principles of the Fair Housing Act and the Equal Opportunity Act. Each office is independently owned and operated. Listing information is deemed reliable but not guaranteed accurate.