- Haleiwa homes for sale
- Kalaeloa homes for sale
- Kapolei homes for sale
- Kawela Bay homes for sale
- Ko Olina homes for sale
- Maili homes for sale
- Mākaha homes for sale
- Makaha Valley homes for sale
- Makakilo homes for sale
- Mililani homes for sale
- Mililani Town homes for sale
- Mokuleia homes for sale
- Nānākuli homes for sale
- Pupukea homes for sale
- Royal Kunia homes for sale
- Wahiawa homes for sale
- Waialua homes for sale
- Waianae homes for sale
- Waipio Acres homes for sale
- Whitmore Village homes for sale
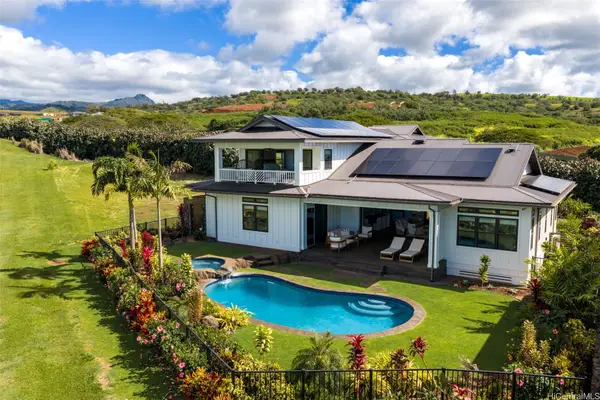
96756, HI - homes for sale
1 of 1 results displayed
Local realty services provided by:CENTURY 21 Island Homes
Based on information from the Multiple Listing Service of HiCentral MLS, Ltd. listings last updated on July 16, 2026. Information is deemed reliable but not guaranteed. Copyright: 2026 by HiCentral MLS, Ltd.
Popular searches near 96756
Popular neighborhoods near 96756
Counties near Koloa, 96756
Protect your home and budget from life's surprises with an Assurant Home Warranty, backed by a partner that supports you through every step of homeownership. Explore Plans.
©2026 Century 21 Real Estate LLC. All rights reserved. CENTURY 21®, the CENTURY 21 Logo and C21® are service marks owned by Century 21 Real Estate LLC. Century 21 Real Estate LLC fully supports the principles of the Fair Housing Act and the Equal Opportunity Act. Each office is independently owned and operated. Listing information is deemed reliable but not guaranteed accurate.