- Aiea, Aiea homes for sale
- Aliamanu, Honolulu homes for sale
- Ewa, Ewa Beach homes for sale
- Kahaluu, Kaneohe homes for sale
- Kailua, Kailua homes for sale
- Kalihi-Palama, Honolulu homes for sale
- Kalihi Valley, Honolulu homes for sale
- Kaneohe, Kaneohe homes for sale
- Liliha, Honolulu homes for sale
- Makakilo, Kapolei homes for sale
- Mililani, Mililani homes for sale
- Mililani Mauka-Launani Valley, Hauula homes for sale
- Moanalua, Honolulu homes for sale
- Nanakuli, Waianae homes for sale
- North Shore, Haleiwa homes for sale
- Nuuanu, Honolulu homes for sale
- Pearl City, Pearl City homes for sale
- Wahiawa, Kunia homes for sale
- Waianae, Waianae homes for sale
- Waipahu, Waipahu homes for sale
Ko'olauloa, Laie, HI - homes for sale
2 of 2 results displayed
- Open Sat, 2 to 5pm
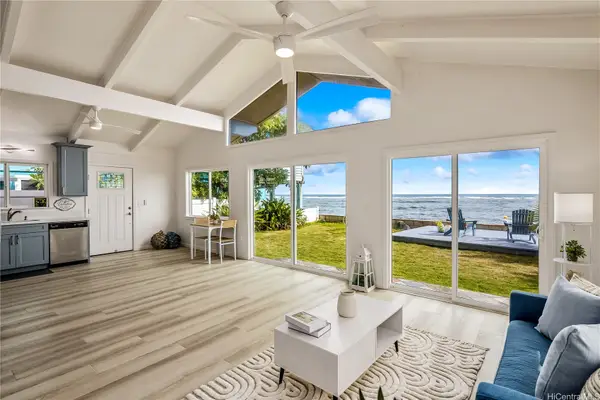
 $1,250,000Active4 beds 2 baths1,656 sq. ft.
53-898 Kamehameha Highway, Hauula, HI 96717
MLS# 202604014Listed by: KELLER WILLIAMS HONOLULU - Open Sun, 2 to 5pm
 $1,188,000Active2 beds 2 baths1,131 sq. ft.
54-259 Kaipapau Loop #B, Hauula, HI 96717
MLS# 202524351Listed by: COLDWELL BANKER REALTY
Local realty services provided by:CENTURY 21 Homefinders of Hawaii
Based on information from the Multiple Listing Service of HiCentral MLS, Ltd. listings last updated on April 1, 2026. Information is deemed reliable but not guaranteed. Copyright: 2026 by HiCentral MLS, Ltd.
Popular neighborhoods near Ko'olauloa, Laie, HI
Zip codes near Ko'olauloa, Laie, HI
- 96701 homes for sale
- 96706 homes for sale
- 96707 homes for sale
- 96712 homes for sale
- 96717 homes for sale
- 96730 homes for sale
- 96731 homes for sale
- 96734 homes for sale
- 96744 homes for sale
- 96762 homes for sale
- 96782 homes for sale
- 96786 homes for sale
- 96789 homes for sale
- 96791 homes for sale
- 96792 homes for sale
- 96797 homes for sale
- 96813 homes for sale
- 96817 homes for sale
- 96818 homes for sale
- 96819 homes for sale
Counties near Ko'olauloa, Laie, HI
Protect your home and budget from life's surprises with an Assurant Home Warranty, backed by a partner that supports you through every step of homeownership. Explore Plans.
©2026 Century 21 Real Estate LLC. All rights reserved. CENTURY 21®, the CENTURY 21 Logo and C21® are service marks owned by Century 21 Real Estate LLC. Century 21 Real Estate LLC fully supports the principles of the Fair Housing Act and the Equal Opportunity Act. Each office is independently owned and operated. Listing information is deemed reliable but not guaranteed accurate.