- Amerige Heights, Fullerton homes for sale
- Anaheim Colony, Anaheim homes for sale
- Atwood, Placentia homes for sale
- Avocado Heights, La Puente homes for sale
- Blackstone, Brea homes for sale
- Imperial Estates, Long Beach homes for sale
- International West, Garden Grove homes for sale
- Michigan Park, Whittier homes for sale
- North Anaheim, Anaheim homes for sale
- North Central Industrial Area, Anaheim homes for sale
- North Whittier, Whittier homes for sale
- Orange Foothills, Orange homes for sale
- Riverbend, Orange homes for sale
- South Anaheim, Anaheim homes for sale
- The Platinum Triangle, Anaheim homes for sale
- The San Gabriel Valley, La Puente homes for sale
- The Southeast, Downey homes for sale
- Tonner Hills, Brea homes for sale
- Vista del Verde, Yorba Linda homes for sale
- West Anaheim, Anaheim homes for sale
La Habra, CA - homes for sale
120 of 120 results displayed
- New
 $189,999Active2 beds 2 baths
1001 W Lambert Road #110, La Habra, CA 90631
MLS# DW26069328Listed by: VIDA REAL ESTATE - New
 $670,000Active4 beds 2 baths1,050 sq. ft.
107 California St, La Habra, CA 90631
MLS# CRPW26064718Listed by: EXP REALTY OF GREATER LOS ANGELES - New
 $505,000Active2 beds 1 baths923 sq. ft.
1440 Lambert, La Habra, CA 90631
MLS# CRPW26063944Listed by: ROBERT BONITO, BROKER - New
 $599,900Active2 beds 3 baths1,232 sq. ft.
603 N Bedford Street, La Habra, CA 90631
MLS# IV26066109Listed by: REAL ESTATE ONE - New
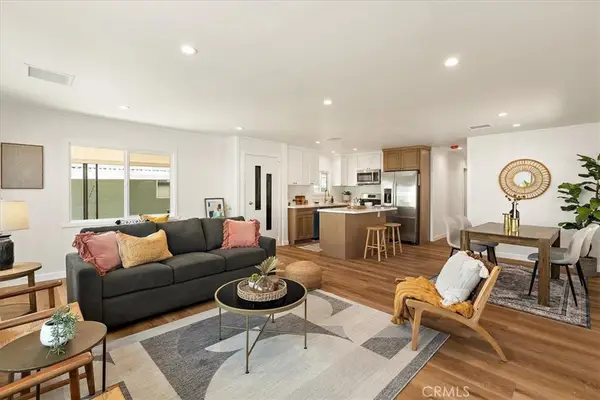
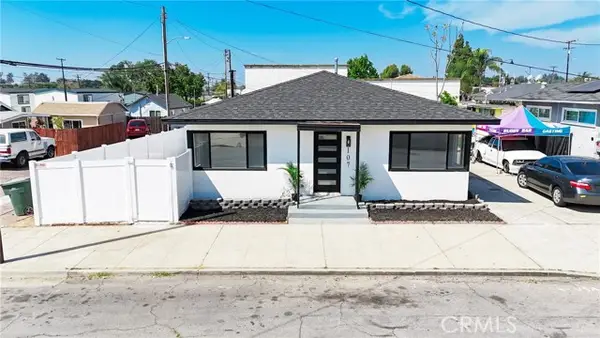
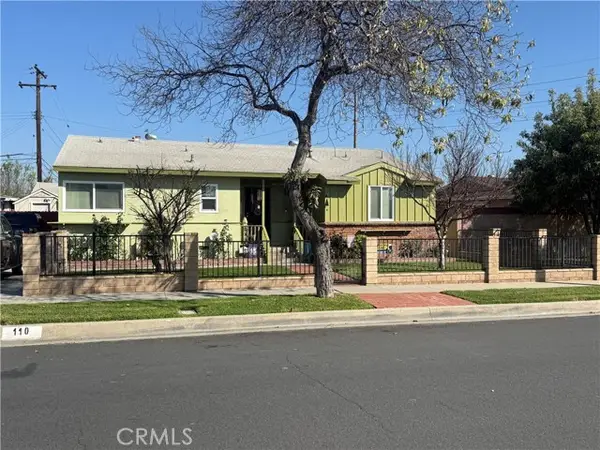 $890,000Active3 beds 2 baths1,200 sq. ft.
110 Rigsby Street, La Habra, CA 90631
MLS# CRPW26062132Listed by: FUSION REALTY GROUP - New
 $938,860Active3 beds 3 baths2,061 sq. ft.
2201 W Toledo, La Habra, CA 90631
MLS# DW26064536Listed by: TRINITY REALTY & INVESTMENTS - New
 $875,000Active3 beds 2 baths1,361 sq. ft.
1041 Derry Street, La Habra, CA 90631
MLS# CRPW26060793Listed by: NEW STAR REALTY & INVESTMENT - New
 $1,485,000Active7 beds 4 baths
630 Ward St, La Habra, CA 90631
MLS# PW26062493Listed by: ERIK MICHAEL RANSDELL, BROKER  $299,000Active2 beds 2 baths1,440 sq. ft.
2210 Lake View Drive #139, La Habra, CA 90631
MLS# PW26060937Listed by: ERA NORTH ORANGE COUNTY $1,125,000Active6 beds 3 baths
1250 Superior, La Habra, CA 90631
MLS# IG26058198Listed by: ELEVATE REAL ESTATE AGENCY $1,280,000Active4 beds 2 baths2,112 sq. ft.
220 Gwynwood Avenue, La Habra, CA 90631
MLS# CROC26052168Listed by: REDFIN $1,180,000Active5 beds 2 baths2,360 sq. ft.
2511 Gregory Lane, La Habra, CA 90631
MLS# AR26051050Listed by: RE/MAX TIME $910,000Active3 beds 2 baths1,400 sq. ft.
401 Keene Drive, La Habra, CA 90631
MLS# CRIV26058666Listed by: EXP REALTY OF SOUTHERN CALIFORNIA INC. $1,050,000Active4 beds 2 baths2,121 sq. ft.
611 Honeywood Lane, La Habra, CA 90631
MLS# OC26055670Listed by: FIDUCIARY REAL ESTATE SERVICES $990,000Pending4 beds 2 baths1,592 sq. ft.
510 Valley Home Avenue, La Habra, CA 90631
MLS# CRDW26053001Listed by: KELLER WILLIAMS SELA $1,195,000Active4 beds 2 baths2,177 sq. ft.
1240 Lynwood St, La Habra, CA 90631
MLS# CRPW26047184Listed by: KELLER WILLIAMS REALTY $1,830,000Pending4 beds 3 baths2,782 sq. ft.
2040 S Armour Court, La Habra, CA 90631
MLS# PW26050327Listed by: COLDWELL BANKER REALTY $3,850,000Active4 beds 3 baths
311 N Idaho, La Habra, CA 90631
MLS# OC26053302Listed by: KIRKLEN INVESTMENT GROUP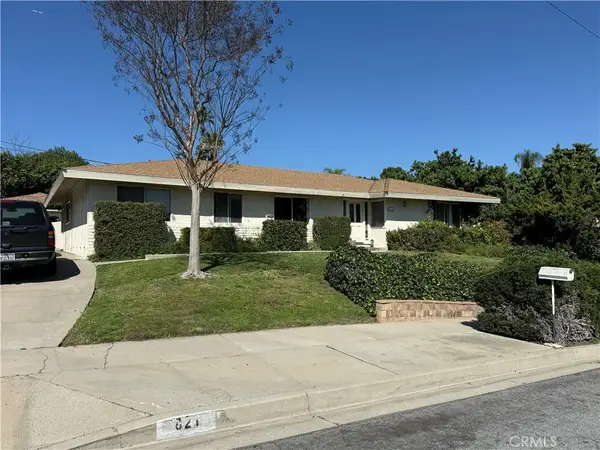 $999,999Pending4 beds 3 baths2,012 sq. ft.
821 Woodcrest Avenue, La Habra, CA 90631
MLS# PW26052795Listed by: NEXTMOVE REAL ESTATE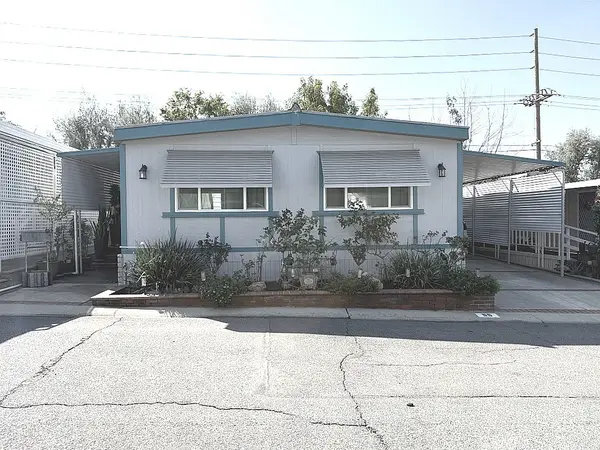 $199,000Active2 beds 2 baths1,152 sq. ft.
1001 W Lambert Road #55, La Habra, CA 90631
MLS# SB26050693Listed by: NEW STAR REALTY & INVESTMENT $749,900Active2 beds 2 baths1,115 sq. ft.
341 Acacia, La Habra, CA 90631
MLS# CRPW26050448Listed by: CAL ALPHA REALTY, INC. $1,378,800Active4 beds 4 baths2,872 sq. ft.
1311 W Dahlia, La Habra, CA 90631
MLS# PW26045822Listed by: LPT REALTY, INC $389,999Active1 beds 1 baths640 sq. ft.
1430 W Lambert #384, La Habra, CA 90631
MLS# CRCV26050067Listed by: PAK HOME REALTY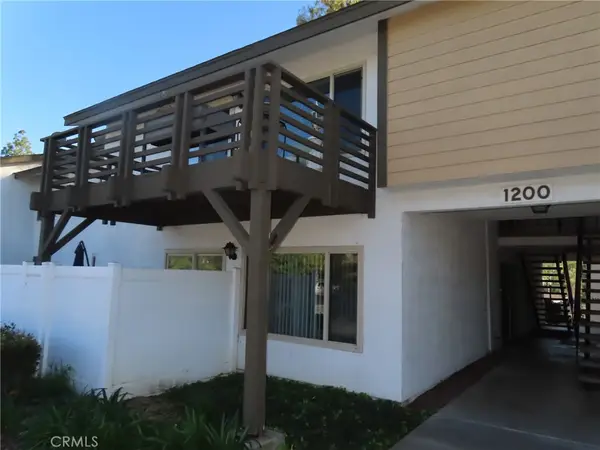 $535,000Active3 beds 1 baths1,053 sq. ft.
1200 W Lambert #32 Road, La Habra, CA 90631
MLS# DW26046168Listed by: BUILDING BETTER HOMES $4,100,000Active-- beds -- baths12,640 sq. ft.
275 S Monte Vista, La Habra, CA 90631
MLS# TR26046764Listed by: ROLLING HILLS REAL ESTATE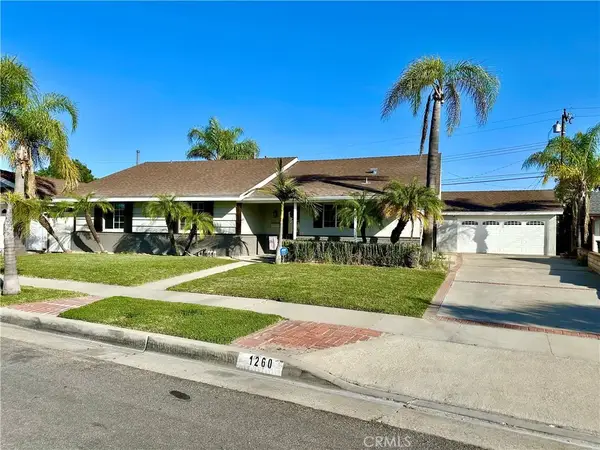 $1,088,800Active4 beds 2 baths1,593 sq. ft.
1260 Summershade, La Habra, CA 90631
MLS# WS26049270Listed by: IRN REALTY $649,800Active3 beds 3 baths1,233 sq. ft.
124 S Valencia, La Habra, CA 90631
MLS# CROC26039692Listed by: REDFIN $958,000Active3 beds 2 baths1,553 sq. ft.
305 N College Drive, La Habra, CA 90631
MLS# CRPW26048426Listed by: J & C INVESTMENT GROUP, INC $2,395,000Active4 beds 5 baths3,572 sq. ft.
1921 S Mangrum Court, La Habra, CA 90631
MLS# PW26044515Listed by: COLDWELL BANKER BEST REALTY $514,500Active1 beds 2 baths900 sq. ft.
957 W Imperial #30, La Habra, CA 90631
MLS# PW26046051Listed by: T.N.G. REAL ESTATE CONSULTANTS $245,000Active2 beds 2 baths1,440 sq. ft.
2201 Lake View, La Habra, CA 90631
MLS# DW26046559Listed by: SYNERGY REAL ESTATE $595,000Pending2 beds 3 baths1,213 sq. ft.
345 S Monte Vista, La Habra, CA 90631
MLS# CRPW26023758Listed by: T.N.G. REAL ESTATE CONSULTANTS
 $524,999Pending2 beds 2 baths1,038 sq. ft.
574 Stone Harbor, La Habra, CA 90631
MLS# RS26045750Listed by: C-21 MASTERS $265,000Active2 beds 2 baths1,368 sq. ft.
1001 W Lambert Rd #spc 129, La Habra, CA 90631
MLS# OC26043538Listed by: K PACIFIC GROUP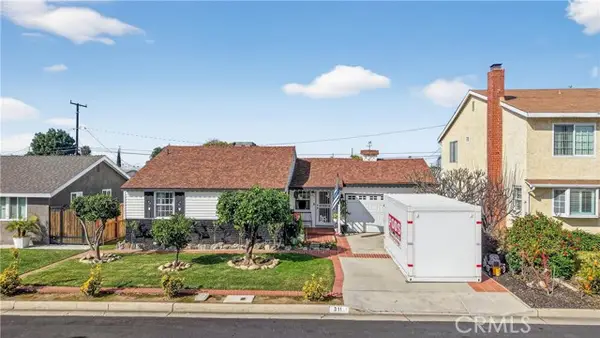 $775,000Active2 beds 1 baths932 sq. ft.
311 S Colfax, La Habra, CA 90631
MLS# CRCV26043275Listed by: THE REAL BROKERAGE, INC.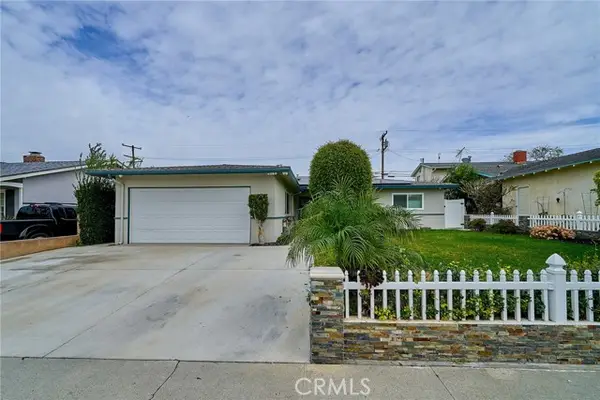 $980,000Active4 beds 2 baths1,643 sq. ft.
2401 Foxdale, La Habra, CA 90631
MLS# CROC26038337Listed by: BETA ONE REALTY & INVESTMENTS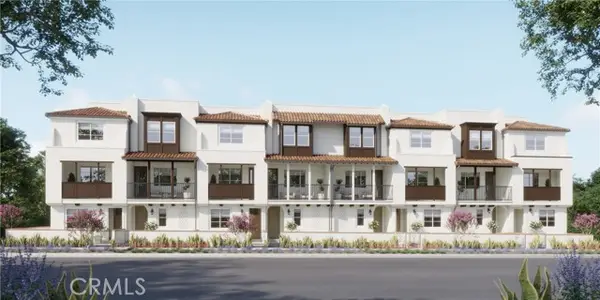 $719,990Pending3 beds 3 baths1,446 sq. ft.
308 E Whittier Boulevard, La Habra, CA 90631
MLS# CROC26042657Listed by: CITY VENTURES CONSTRUCTION, INC.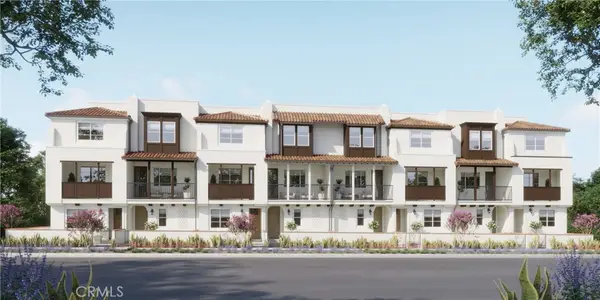 $759,990Pending3 beds 4 baths1,705 sq. ft.
312 E Whittier Boulevard, La Habra, CA 90631
MLS# OC26042672Listed by: CITY VENTURES CONSTRUCTION, INC. $1,175,000Active4 beds 3 baths2,302 sq. ft.
1640 Sheffield, La Habra, CA 90631
MLS# IV26041807Listed by: TOWER AGENCY $505,000Pending2 beds 2 baths1,040 sq. ft.
600 W Lambert Road #48, La Habra, CA 90631
MLS# CRSB26042122Listed by: VISTA SOTHEBYS INTERNATIONAL REALTY $849,900Pending3 beds 2 baths1,388 sq. ft.
1221 N Orange, La Habra, CA 90631
MLS# OC26040251Listed by: COLDWELL BANKER REALTY $1,649,000Active5 beds 4 baths3,139 sq. ft.
1541 Via Los Bonitos, La Habra, CA 90631
MLS# PW26039450Listed by: REDPOINT REALTY $1,199,000Active3 beds 2 baths1,875 sq. ft.
1060 Tropicana, La Habra, CA 90631
MLS# CROC26026314Listed by: APEX REAL ESTATE & ASSOCIATES $825,000Active3 beds 3 baths1,688 sq. ft.
601 N Walnut, La Habra, CA 90631
MLS# CRPW26039010Listed by: RE/MAX UNLIMITED REAL ESTATE $264,900Pending4 beds 2 baths1,658 sq. ft.
936 Ryan Avenue, Baker, LA 70174
MLS# 2026003056Listed by: D.R. HORTON REALTY OF LOUISIAN $565,000Active3 beds 2 baths946 sq. ft.
841 Las Lomas Drive #D, La Habra, CA 90631
MLS# PW26029660Listed by: REDFIN CORPORATION $669,888Active2 beds 2 baths1,438 sq. ft.
1971 Pine, La Habra, CA 90631
MLS# CRDW26024819Listed by: RE/MAX DYNASTY $559,999Active2 beds 2 baths1,140 sq. ft.
919 Glencliff Street, La Habra, CA 90631
MLS# CRPW26034789Listed by: NEXTMOVE REAL ESTATE $950,000Active4 beds 2 baths1,446 sq. ft.
301 W Parkwood, La Habra, CA 90631
MLS# CRPW26035199Listed by: TERESA VICUNA, BROKER $439,000Active2 beds 2 baths886 sq. ft.
1048 S Idaho #8, La Habra, CA 90631
MLS# PW26034489Listed by: ERA NORTH ORANGE COUNTY $1,490,000Active4 beds 3 baths2,445 sq. ft.
1020 Bonnie Ann Court, La Habra, CA 90631
MLS# PW26033129Listed by: DNZ REAL ESTATE, INC. $1,199,999Pending4 beds 3 baths2,595 sq. ft.
1061 N Euclid Street, La Habra, CA 90631
MLS# PW26032133Listed by: NEXTMOVE REAL ESTATE $1,250,000Active4 beds 3 baths2,724 sq. ft.
1091 Citrus Drive, La Habra, CA 90631
MLS# PW26030991Listed by: COLDWELL BANKER UNITED $520,000Active2 beds 2 baths984 sq. ft.
950 W Lambert #4, La Habra, CA 90631
MLS# PW26028438Listed by: CENTURY 21 CORNERSTONE $398,500Active1 beds 1 baths660 sq. ft.
1450 W Lambert Road #366, La Habra, CA 90631
MLS# IV26027894Listed by: BETTER HOMES AND GARDENS REAL ESTATE CHAMPIONS $304,000Active2 beds 2 baths1,440 sq. ft.
2261 Lake Crest Lane #83, La Habra, CA 90631
MLS# CROC26024876Listed by: EVA RALEIGH, BROKER $925,000Pending3 beds 2 baths1,373 sq. ft.
1360 Valwood, La Habra, CA 90631
MLS# CRDW26025234Listed by: CENTURY 21 ALLSTARS $1,168,800Pending3 beds 3 baths2,118 sq. ft.
335 E Francis, La Habra, CA 90631
MLS# PW26025344Listed by: COLDWELL BANKER BEST REALTY $1,599,990Active8 beds -- baths3,757 sq. ft.
1301 Burwood, La Habra, CA 90631
MLS# CRCV26024353Listed by: THE IVRI GROUP, INC. $1,690,000Active-- beds -- baths2,420 sq. ft.
1004 E Erna, La Habra, CA 90631
MLS# PW26023527Listed by: ARK ESTATE, INC. $965,000Active3 beds 2 baths1,604 sq. ft.
411 Parsons Street, La Habra, CA 90631
MLS# CROC26018281Listed by: REDFIN $1,149,999Pending4 beds 3 baths2,229 sq. ft.
171 Avenida Santa Anita, La Habra, CA 90631
MLS# TR26020237Listed by: PINNACLE REAL ESTATE GROUP $699,000Active3 beds 3 baths1,579 sq. ft.
832 Citrus Drive #7, La Habra, CA 90631
MLS# TR26001526Listed by: WESTERN REALTY & INVESTMENTS $158,000Active2 beds 2 baths1,568 sq. ft.
1001 E Lambert #258, La Habra, CA 90631
MLS# PW26019051Listed by: RE/MAX DYNASTY $569,000Active3 beds 2 baths909 sq. ft.
955 Las Lomas Drive #D, La Habra, CA 90631
MLS# PW26010654Listed by: T.N.G. REAL ESTATE CONSULTANTS $215,000Active2 beds 2 baths1,440 sq. ft.
1001 W Lambert Road #284, La Habra, CA 90631
MLS# CRTR26015245Listed by: MASTERS REALTY EASTERN GROUP $440,000Pending2 beds 2 baths886 sq. ft.
1060 S Idaho Street #41, La Habra, CA 90631
MLS# PW26017339Listed by: EHOUSE REALTY $2,195,000Pending4 beds 5 baths3,600 sq. ft.
2201 W Snead Street, La Habra, CA 90631
MLS# PW26012687Listed by: JONG M. HWANG, BROKER $265,900Pending4 beds 2 baths1,658 sq. ft.
954 Ryan Avenue, Baker, LA 70174
MLS# 2026001081Listed by: D.R. HORTON REALTY OF LOUISIAN $439,000Active2 beds 1 baths890 sq. ft.
1200 W Lambert Unit24, La Habra, CA 90631
MLS# CRTR26010265Listed by: RE/MAX CHAMPIONS $1,298,000Active3 beds 4 baths3,056 sq. ft.
355 S Cypress Street, La Habra, CA 90631
MLS# CRDW26009526Listed by: KELLER WILLIAMS REALTY IRVINE $575,000Active3 beds 2 baths1,073 sq. ft.
985 S Idaho Street #40, La Habra, CA 90631
MLS# CRFR26005904Listed by: DOMBROSKI REALTY $1,395,000Active2 beds -- baths3,820 sq. ft.
211 S Valencia Street, La Habra, CA 90631
MLS# CL26635729Listed by: CB RICHARD ELLIS, INC. $1,395,000Active2 beds -- baths3,820 sq. ft.
221 S Valencia Street, La Habra, CA 90631
MLS# CL26635737Listed by: CB RICHARD ELLIS, INC. $449,000Active2 beds 2 baths886 sq. ft.
1060 S Idaho Street #42, La Habra, CA 90631
MLS# DW26003775Listed by: COLDWELL BANKER ENVISION $510,000Pending2 beds 2 baths942 sq. ft.
815 Las Lomas Drive #B, La Habra, CA 90631
MLS# CL26634103Listed by: KELLER WILLIAMS BEVERLY HILLS $2,200,000Active9 beds 7 baths4,802 sq. ft.
501 S Euclid St., La Habra, CA 90631
MLS# 2600513Listed by: COMPASS $1,649,000Active8 beds -- baths4,123 sq. ft.
101 W Olive Avenue, La Habra, CA 90631
MLS# CL26632367Listed by: CB RICHARD ELLIS, INC. $399,000Active1 beds 1 baths660 sq. ft.
1200 W Lambert Road #41, La Habra, CA 90631
MLS# MB25279100Listed by: FTA REALTY $399,000Active1 beds 1 baths660 sq. ft.
1200 W Lambert Road #41, La Habra, CA 90631
MLS# CRMB25279100Listed by: FTA REALTY $329,000Active3 beds 2 baths1,536 sq. ft.
2251 Lake Glen Drive, La Habra, CA 90631
MLS# CRPW25275397Listed by: T.N.G. REAL ESTATE CONSULTANTS $1,050,000Pending5 beds 3 baths2,265 sq. ft.
710 Rye, La Habra, CA 90631
MLS# CRPW25276686Listed by: A-MED REALTY GROUP $399,990Active1 beds 1 baths660 sq. ft.
1410 W Lambert #202, La Habra, CA 90631
MLS# CRPW25272945Listed by: CIRCA PROPERTIES, INC. $334,900Active4 beds 3 baths2,484 sq. ft.
930 Ryan Avenue, Baker, LA 70174
MLS# BR2025021674Listed by: D.R. HORTON REALTY OF LOUISIAN $775,000Active2 beds 1 baths1,141 sq. ft.
850 S Euclid Street, La Habra, CA 90631
MLS# IG25263408Listed by: CLARDY FINANCIAL SERVICES $515,000Active2 beds 2 baths1,040 sq. ft.
600 W Lambert #44, La Habra, CA 90631
MLS# PW25256787Listed by: COLDWELL BANKER ENVISION $825,000Active3 beds 3 baths1,579 sq. ft.
149 E Knox Drive, La Habra, CA 90631
MLS# RS25265299Listed by: JEANNIE LEE REALTY INC. $825,000Active3 beds 3 baths1,579 sq. ft.
149 E Knox Drive, La Habra, CA 90631
MLS# CRRS25265299Listed by: JEANNIE LEE REALTY INC. $799,900Active4 beds 2 baths1,593 sq. ft.
2541 Summershade, La Habra, CA 90631
MLS# PW25245203Listed by: EXP REALTY OF CALIFORNIA INC $395,500Active1 beds 1 baths660 sq. ft.
1480 W Lambert #288, La Habra, CA 90631
MLS# CV25259502Listed by: BEST MORTGAGE & REALTY $880,000Pending3 beds 2 baths1,376 sq. ft.
2430 W Cajon Drive, La Habra, CA 90631
MLS# CL25616053Listed by: REAL BROKER $515,000Active2 beds 2 baths1,040 sq. ft.
600 W Lambert #44, La Habra, CA 90631
MLS# PW25256787Listed by: COLDWELL BANKER ENVISION $538,000Active3 beds 1 baths1,053 sq. ft.
1210 W Lambert Road #58, La Habra, CA 90631
MLS# CRP1-24819Listed by: HYTHE REALTY, INC $254,000Active2 beds 2 baths1,440 sq. ft.
1001 W Lambert #153, La Habra, CA 90631
MLS# DW25252397Listed by: EXP REALTY OF SOUTHERN CALIF $789,990Pending3 beds 4 baths1,730 sq. ft.
304 E Whittier Boulevard, La Habra, CA 90631
MLS# CROC25252808Listed by: CITY VENTURES CONSTRUCTION, INC. $719,990Pending3 beds 3 baths1,446 sq. ft.
320 E Whittier Boulevard, La Habra, CA 90631
MLS# CROC25253036Listed by: CITY VENTURES CONSTRUCTION, INC. $857,490Active3 beds 3 baths1,719 sq. ft.
334 E William Way, La Habra, CA 90631
MLS# CROC25253051Listed by: CITY VENTURES CONSTRUCTION, INC. $799,990Active3 beds 3 baths1,446 sq. ft.
322 E William Way, La Habra, CA 90631
MLS# CROC25253057Listed by: CITY VENTURES CONSTRUCTION, INC. $1,399,990Active5 beds 3 baths2,590 sq. ft.
1020 La Serna, La Habra, CA 90631
MLS# CRSW25248871Listed by: ABUNDANCE REAL ESTATE $811,490Pending4 beds 4 baths1,705 sq. ft.
764 N Orange Street, La Habra, CA 90631
MLS# CROC25248672Listed by: CITY VENTURES CONSTRUCTION, INC. $1,895,000Active8 beds -- baths3,756 sq. ft.
1381 Burwood Street, La Habra, CA 90631
MLS# CL25610397Listed by: PHILCO REALTY $799,990Active4 beds 4 baths1,730 sq. ft.
770 N Orange Street, La Habra, CA 90631
MLS# CROC25235457Listed by: CITY VENTURES CONSTRUCTION, INC. $747,910Pending3 beds 3 baths1,446 sq. ft.
766 N Orange Street, La Habra, CA 90631
MLS# CROC25236273Listed by: CITY VENTURES CONSTRUCTION, INC. $3,999,999Active0 Acres
320 -330 Monte Vista, La Habra, CA 90631
MLS# WS25235921Listed by: HDD REALTY INC. $529,000Active2 beds 2 baths1,027 sq. ft.
994 E La Habra #246, La Habra, CA 90631
MLS# PW25232572-1Listed by: NICK SADEK SOTHEBY'S INTL RLTY $948,000Active3 beds 2 baths1,842 sq. ft.
308 S Valencia Street, La Habra, CA 90631
MLS# CV25227848Listed by: CENTURY 21 MASTERS $460,000Active2 beds 2 baths971 sq. ft.
601 S Euclid Street #4, La Habra, CA 90631
MLS# RS25196901Listed by: COLDWELL BANKER ENVISION $699,900Pending3 beds 2 baths1,216 sq. ft.
2000 Story Avenue, La Habra, CA 90631
MLS# CRPW25196682Listed by: PARTNERS REAL ESTATE GROUP $714,000Active3 beds 3 baths1,657 sq. ft.
1921 Pine Drive, La Habra, CA 90631
MLS# CRPW25183266Listed by: HOUSING SPECIALTIES $475,000Pending3 beds 3 baths1,210 sq. ft.
924 N Walnut Street #9, La Habra, CA 90631
MLS# OC19283140Listed by: FIRST TEAM REAL ESTATE $765,000Pending3 beds 2 baths1,930 sq. ft.
720 W Wedgewood Lane, La Habra, CA 90631
MLS# PW19270980Listed by: STELLARQUEST REAL ESTATE $263,888Active2 beds 2 baths1,368 sq. ft.
1001 W Lambert #146, La Habra, CA 90631
MLS# CRTR25128773Listed by: EXP REALTY OF CALIFORNIA INC $400,000Active0.95 Acres
0 Airoso, La Habra Heights, CA 90631
MLS# CRPW25124461Listed by: REALTY ONE GROUP WEST $1,750,000Active3 beds 1 baths1,948 sq. ft.
720 W La Habra Boulevard, La Habra, CA 90631
MLS# CRPW25105663Listed by: T.N.G. REAL ESTATE CONSULTANTS $255,000Active2 beds 2 baths1,488 sq. ft.
2121 Lake Side Drive #158, La Habra, CA 90631
MLS# CROC25044849Listed by: EVA RALEIGH, BROKER $255,000Active2 beds 2 baths1,488 sq. ft.
2121 Lake Side #158, La Habra, CA 90631
MLS# OC25044849Listed by: EVA RALEIGH, BROKER $159,900Active2 beds 2 baths1,152 sq. ft.
1001 W Lambert Road #127, La Habra, CA 90631
MLS# CRPW25240536Listed by: T.N.G. REAL ESTATE CONSULTANTS $875,000Active3 beds 2 baths1,169 sq. ft.
401 Buena Vista, La Habra, CA 90631
MLS# CRDW25251248Listed by: REMAX SKY $795,000Pending3 beds 1 baths1,338 sq. ft.
111 N Marian Street, La Habra, CA 90631
MLS# PW26031246Listed by: SUPERIOR REAL ESTATE GROUP $574,999Pending3 beds 2 baths1,152 sq. ft.
1074 Las Lomas Drive #A, La Habra, CA 90631
MLS# PW22063767Listed by: ALCHEMY PROPERTIES
Local realty services provided by:CENTURY 21 Jordan-Link, CENTURY 21 Wildwood Properties, Inc., CENTURY 21 Affiliated, CENTURY 21 Bessette Flavin, CENTURY 21 Action Realty
The information being provided by California Regional MLS (Southern California) is for the consumer's personal, non-commercial use and may not be used for any purpose other than to identify prospective properties consumer may be interested in purchasing. Any information relating to real estate for sale referenced on this web site comes from the Internet Data Exchange (IDX) program of the California Regional MLS (Southern California). CENTURY 21 Jordan-Link is not a Multiple Listing Service (MLS), nor does it offer MLS access. This website is a service of CENTURY 21 Jordan-Link, a broker participant of California Regional MLS (Southern California). This web site may reference real estate listing(s) held by a brokerage firm other than the broker and/or agent who owns this web site.
The accuracy of all information, regardless of source, including but not limited to open house information, square footages and lot sizes, is deemed reliable but not guaranteed and should be personally verified through personal inspection by and/or with the appropriate professionals. The data contained herein is copyrighted by California Regional MLS (Southern California) and is protected by all applicable copyright laws. Any unauthorized dissemination of this information is in violation of copyright laws and is strictly prohibited.
Copyright 2021 California Regional MLS (Southern California). All rights reserved.
This information is deemed reliable but not guaranteed. You should rely on this information only to decide whether or not to further investigate a particular property. BEFORE MAKING ANY OTHER DECISION, YOU SHOULD PERSONALLY INVESTIGATE THE FACTS (e.g. square footage and lot size) with the assistance of an appropriate professional. You may use this information only to identify properties you may be interested in investigating further. All uses except for personal, non-commercial use in accordance with the foregoing purpose are prohibited. Redistribution or copying of this information, any photographs or video tours is strictly prohibited. This information is derived from the Internet Data Exchange (IDX) service provided by San Diego MLS®. Displayed property listings may be held by a brokerage firm other than the broker and/or agent responsible for this display. The information and any photographs and video tours and the compilation from which they are derived is protected by copyright. Compilation © 2020 San Diego MLS®, Inc.
Neighborhoods near La Habra, CA
Zip codes near La Habra, CA
- 90602 homes for sale
- 90603 homes for sale
- 90604 homes for sale
- 90605 homes for sale
- 90620 homes for sale
- 90621 homes for sale
- 90631 homes for sale
- 90638 homes for sale
- 90670 homes for sale
- 90703 homes for sale
- 91744 homes for sale
- 91745 homes for sale
- 91748 homes for sale
- 92801 homes for sale
- 92821 homes for sale
- 92831 homes for sale
- 92832 homes for sale
- 92833 homes for sale
- 92835 homes for sale
- 92870 homes for sale
Popular searches near La Habra, CA
- Anaheim homes for sale
- Brea homes for sale
- Buena Park homes for sale
- Cerritos homes for sale
- East Whittier homes for sale
- Fullerton homes for sale
- Hacienda Heights homes for sale
- Industry homes for sale
- La Habra Heights homes for sale
- La Mirada homes for sale
- La Palma homes for sale
- La Puente homes for sale
- Norwalk homes for sale
- Placentia homes for sale
- Rowland Heights homes for sale
- Santa Fe Springs homes for sale
- South San Jose Hills homes for sale
- South Whittier homes for sale
- West Whittier-Los Nietos homes for sale
- Whittier homes for sale
Protect your home and budget from life's surprises with an Assurant Home Warranty, backed by a partner that supports you through every step of homeownership. Explore Plans.
©2026 Century 21 Real Estate LLC. All rights reserved. CENTURY 21®, the CENTURY 21 Logo and C21® are service marks owned by Century 21 Real Estate LLC. Century 21 Real Estate LLC fully supports the principles of the Fair Housing Act and the Equal Opportunity Act. Each office is independently owned and operated. Listing information is deemed reliable but not guaranteed accurate.