- Amerige Heights, Fullerton homes for sale
- Avocado Heights, La Puente homes for sale
- California Village, Pasadena homes for sale
- Carpenter-Nathanson Tracts, Alhambra homes for sale
- Chapman, Pasadena homes for sale
- Coyote Hills Estates, Fullerton homes for sale
- East Shorb, Alhambra homes for sale
- Eastmont, Los Angeles homes for sale
- Ethel Park, Alhambra homes for sale
- Hastings Ranch, Pasadena homes for sale
- Lindaraxa Park, Alhambra homes for sale
- Martha Baldwin, Alhambra homes for sale
- Michigan Park, Whittier homes for sale
- North Whittier, Whittier homes for sale
- The San Gabriel Valley, La Puente homes for sale
- The Southeast, Downey homes for sale
- Vista del Verde, Yorba Linda homes for sale
- West Coyote Hills, Fullerton homes for sale
- Westridge, La Habra homes for sale
- Windmill Creek, Chino Hills homes for sale
La Puente, CA - homes for sale
55 of 55 results displayed
- Open Sat, 11am to 4pmNew
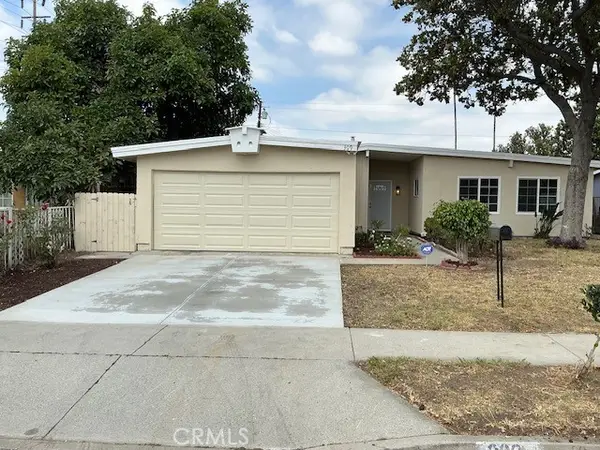 $775,000Active4 beds 2 baths1,284 sq. ft.
309 N Siesta, La Puente, CA 91746
MLS# OC26104980Listed by: COUNTRYWIDE REALTY & MORTGAGE - Open Sat, 11am to 4pmNew
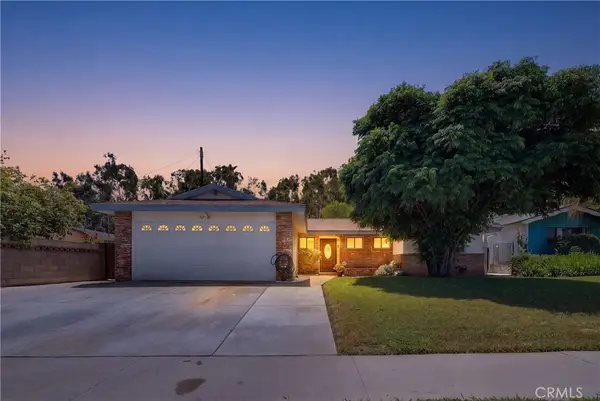 $825,000Active4 beds 2 baths1,437 sq. ft.
16560 Wing Lane, La Puente, CA 91744
MLS# AR26104261Listed by: HIGH TEN PARTNERS, INC. - New
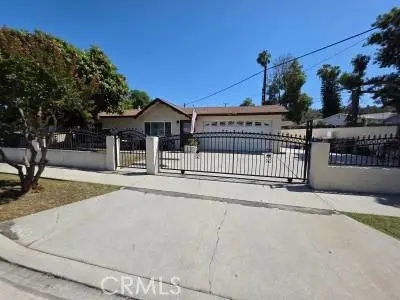 $750,000Active3 beds 2 baths1,490 sq. ft.
16802 Wing, La Puente, CA 91744
MLS# CV26103137Listed by: HERN REAL ESTATE & ASSOCIATES - Open Sat, 11am to 2pmNew
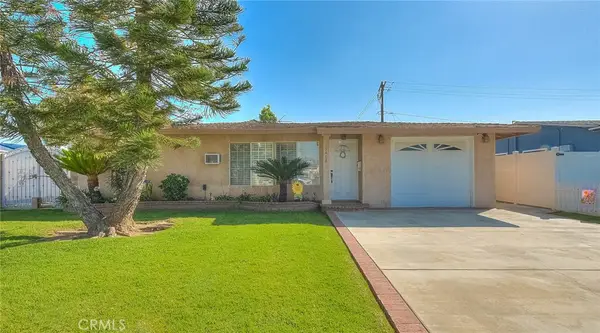 $810,000Active4 beds 2 baths1,886 sq. ft.
15468 Prichard Street, La Puente, CA 91744
MLS# TR26099289Listed by: COLDWELL BANKER TOP TEAM - New
 $749,900Active3 beds 2 baths1,012 sq. ft.
15316 Giordano, La Puente, CA 91744
MLS# CV26097001Listed by: CENTURY 21 MASTERS - Open Sat, 11am to 2pmNew
 $1,075,000Active4 beds 4 baths2,026 sq. ft.
431 Cabana Ave, La Puente, CA 91744
MLS# CV26095758Listed by: COLDWELL BANKER LEADERS  $605,000Pending3 beds 2 baths1,027 sq. ft.
806 Sunkist, La Puente, CA 91746
MLS# IG26095367Listed by: EXP REALTY OF CALIFORNIA INC.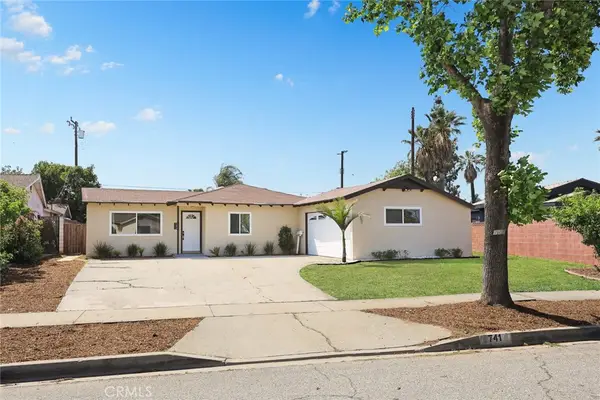 $856,000Active3 beds 2 baths1,531 sq. ft.
741 Frandale Avenue, La Puente, CA 91744
MLS# AR26077952Listed by: RE/MAX PREMIER PROP ARCADIA $769,000Active5 beds 3 baths1,887 sq. ft.
715 Van Wig, La Puente, CA 91746
MLS# DW26089916Listed by: EHOMES $1,100,000Active5 beds 3 baths2,227 sq. ft.
1123 Aldgate, La Puente, CA 91744
MLS# TR26064527Listed by: EXP REALTY OF CALIFORNIA INC- Open Sat, 11am to 3pm
 $769,000Active3 beds 2 baths1,204 sq. ft.
13624 Lassalette, La Puente, CA 91746
MLS# DW26087524Listed by: CENTURY 21 LOTUS - Open Sat, 2 to 4pm
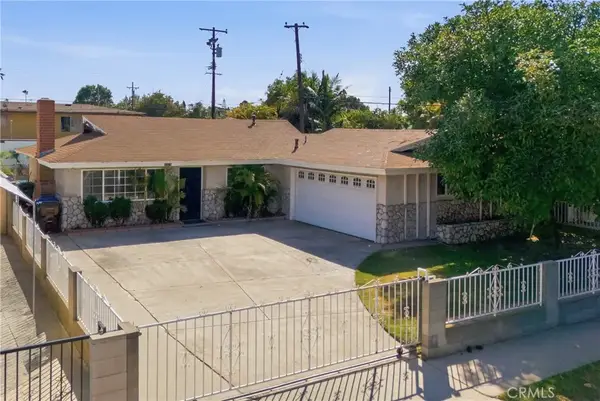
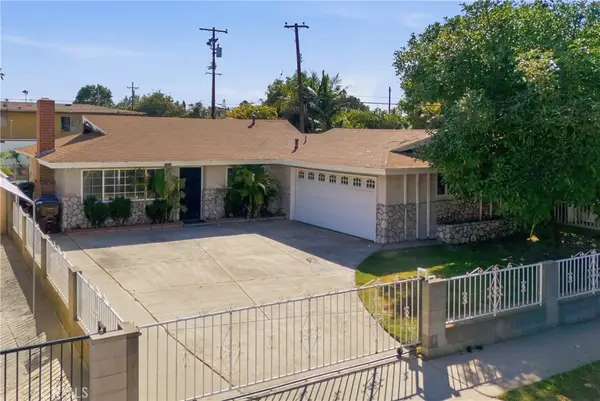
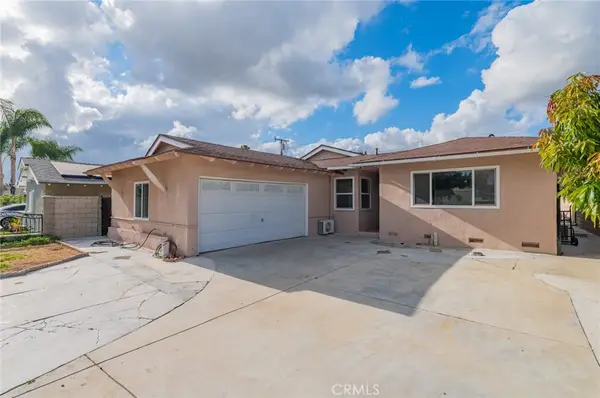
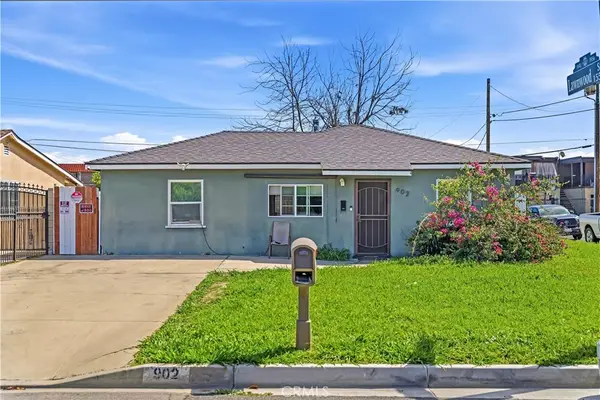 $699,000Active3 beds 2 baths1,095 sq. ft.
902 Ballista Avenue, La Puente, CA 91744
MLS# AR26087599Listed by: WETRUST REALTY - Open Sat, 1 to 4pm
 $729,900Active3 beds 2 baths997 sq. ft.
1033 Clintwood, La Puente, CA 91744
MLS# CV26085557Listed by: ELEVATE REAL ESTATE AGENCY - Open Sat, 11am to 3pm
 $769,000Active3 beds 2 baths1,204 sq. ft.
13624 Lassalette, La Puente, CA 91746
MLS# DW26087524Listed by: CENTURY 21 LOTUS - Open Sat, 1 to 5pm
 $818,000Active4 beds 2 baths1,394 sq. ft.
15611 Mulvane, La Puente, CA 91744
MLS# TR26085788Listed by: IRN REALTY 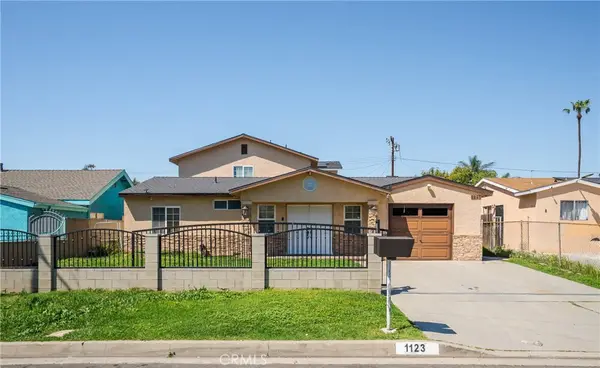 $1,100,000Active5 beds 3 baths2,227 sq. ft.
1123 Aldgate, La Puente, CA 91744
MLS# TR26064527Listed by: EXP REALTY OF CALIFORNIA INC- Open Sat, 10am to 2pm
 $749,999Active3 beds 1 baths959 sq. ft.
1139 Aldgate, La Puente, CA 91744
MLS# CV26083047Listed by: RE/MAX CHAMPIONS  $771,000Pending3 beds 2 baths1,092 sq. ft.
14809 Dancer Street, La Puente, CA 91744
MLS# 26719733Listed by: OPENDOOR BROKERAGE INC. $719,000Active3 beds 2 baths1,301 sq. ft.
632 Ranlett, La Puente, CA 91744
MLS# IG26080541Listed by: PONCE & PONCE REALTY, INC $719,000Active3 beds 2 baths1,301 sq. ft.
632 Ranlett, La Puente, CA 91744
MLS# IG26080541Listed by: PONCE & PONCE REALTY, INC- Open Sat, 12 to 3pm
 $746,000Active4 beds 2 baths1,166 sq. ft.
527 Melham, La Puente, CA 91744
MLS# TR26078907Listed by: CENTURY 21 MASTERS 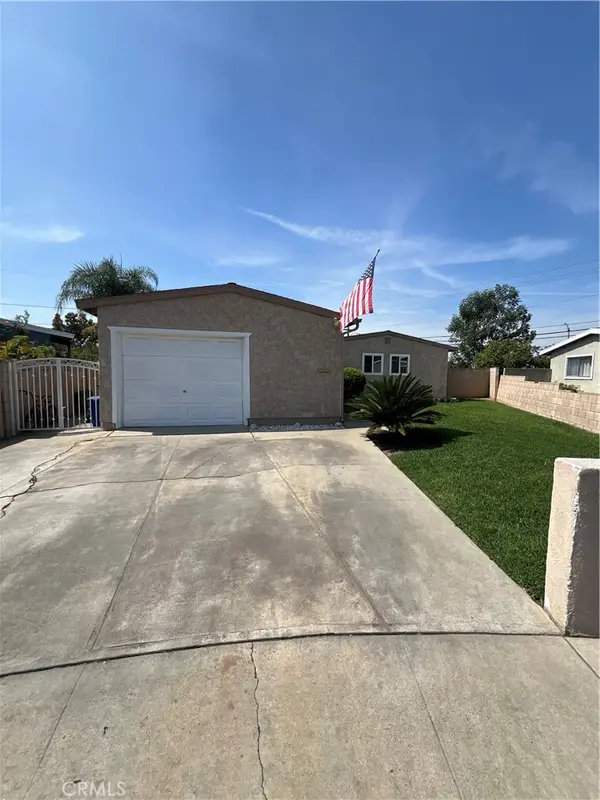 $849,888Active5 beds 2 baths1,561 sq. ft.
15204 Giordano, La Puente, CA 91744
MLS# MB26074058Listed by: MERIT REALTY GROUP $785,000Active4 beds 2 baths1,368 sq. ft.
14537 Flanner, La Puente, CA 91744
MLS# GD26073938Listed by: LAS CASAS REALTY, INC. $895,000Active4 beds 2 baths1,166 sq. ft.
15145 Beckner, La Puente, CA 91744
MLS# PW26070510Listed by: MILLENNIUM HOUSES AND ESTATES- Open Sat, 12 to 4pm
 $920,000Active4 beds 3 baths1,728 sq. ft.
509 Sandy Hook Avenue, La Puente, CA 91744
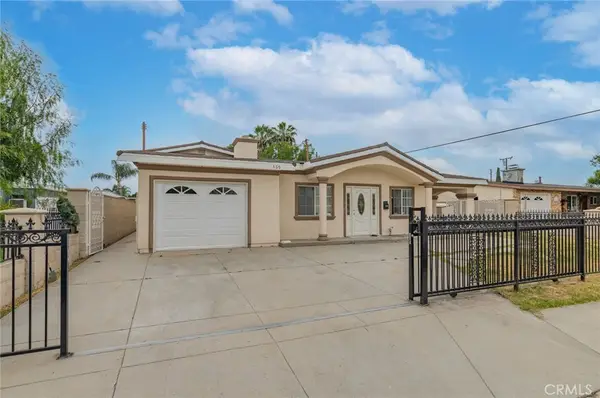
MLS# TR26070117Listed by: REMAX 2000 REALTY 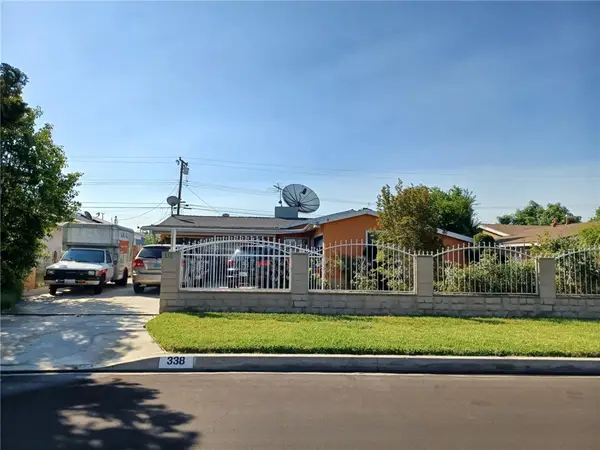 $810,000Active3 beds 2 baths996 sq. ft.
338 Conlon, La Puente, CA 91744
MLS# TR26066494Listed by: COLDWELL BANKER ENVISION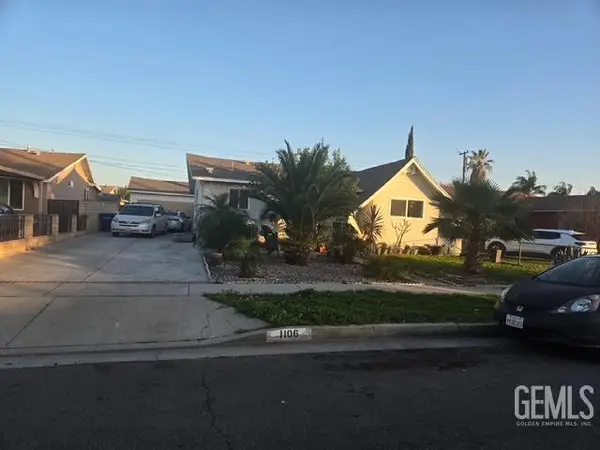 $650,000Active3 beds 3 baths
1106 SUNKIST AVENUE, La Puente, CA 91746
MLS# 202603330Listed by: GOLDEN VALLEY REAL ESTATE GROUP- Open Sat, 1 to 3pm
 $719,900Active3 beds 2 baths1,043 sq. ft.
13622 Hartsville Street, La Puente, CA 91746
MLS# AR26059837Listed by: REAL BROKERAGE TECHNOLOGIES, INC  $699,995Active3 beds 2 baths1,082 sq. ft.
731 N Orange, La Puente, CA 91744
MLS# OC26055031Listed by: LANDMARK REALTY & MORTGAGE $749,000Active3 beds 2 baths1,030 sq. ft.
882 Tamar, La Puente, CA 91746
MLS# WS26055028Listed by: NOBLE NETWORK & INVESTMENT- Open Sat, 12 to 4pm
 $799,000Active4 beds 2 baths1,190 sq. ft.
15014 Ragus, La Puente, CA 91744
MLS# DW26054273Listed by: CRISTAL REAL ESTATE GROUP  $830,000Pending4 beds 2 baths1,214 sq. ft.
15625 Loukelton, La Puente, CA 91744
MLS# CV26054783Listed by: PAK HOME REALTY $710,000Active3 beds 1 baths1,048 sq. ft.
1502 Vanderwell, La Puente, CA 91744
MLS# DW26050864Listed by: SYNERGY REAL ESTATE $799,000Active5 beds 2 baths1,586 sq. ft.
17437 Northam, La Puente, CA 91744
MLS# PW26049221Listed by: NEXTEAM REAL ESTATE $749,000Pending3 beds 2 baths1,328 sq. ft.
15865 Cadwell, La Puente, CA 91744
MLS# TR26039346Listed by: HOMEQUEST REAL ESTATE $769,000Pending3 beds 2 baths1,376 sq. ft.
16336 Dalark, La Puente, CA 91744
MLS# PW26039869Listed by: 1ST CLASS REALTY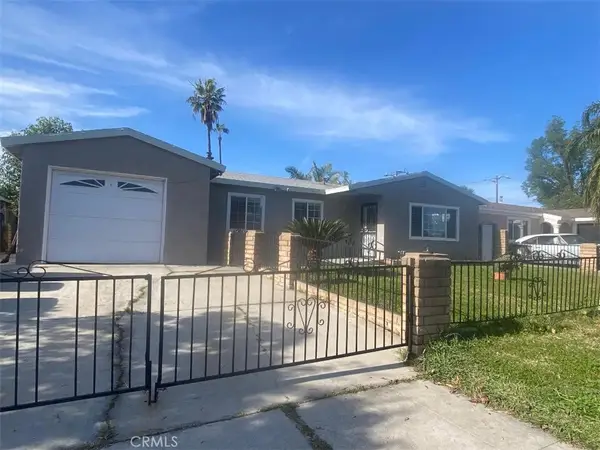 $829,000Active4 beds 2 baths1,520 sq. ft.
1133 Aldgate, La Puente, CA 91744
MLS# TR26040886Listed by: 168 REALTY INC. $759,000Active4 beds 2 baths1,541 sq. ft.
16108 Maplegrove Street, La Puente, CA 91744
MLS# IV26037643Listed by: ELEVATE REAL ESTATE AGENCY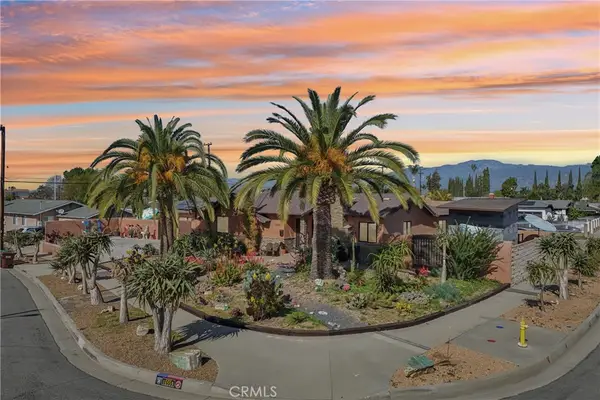 $899,000Active4 beds 2 baths1,601 sq. ft.
16559 Mcwood, La Puente, CA 91744
MLS# CV26024646Listed by: WERE REAL ESTATE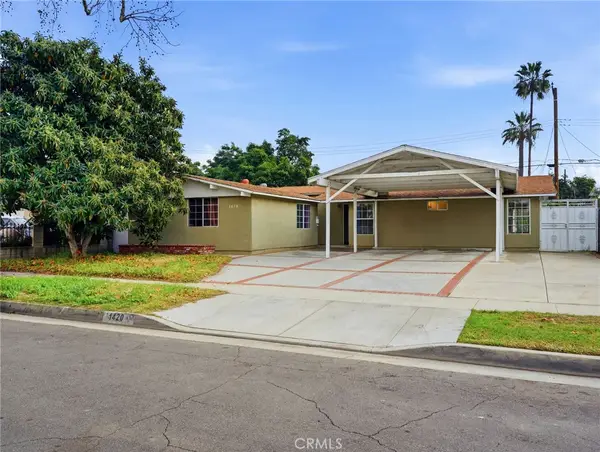 $899,000Active5 beds 3 baths1,978 sq. ft.
1420 Glenshaw Avenue, La Puente, CA 91744
MLS# SB26018934Listed by: JASON MITCHELL REAL ESTATE CA $768,000Active4 beds 1 baths1,480 sq. ft.
226 Shay Avenue, La Puente, CA 91744
MLS# TR26021221Listed by: REMAX 2000 REALTY $759,000Active3 beds 2 baths1,285 sq. ft.
16060 Las Vecinas Drive, La Puente, CA 91744
MLS# IG26016699Listed by: RIVER WALK REALTY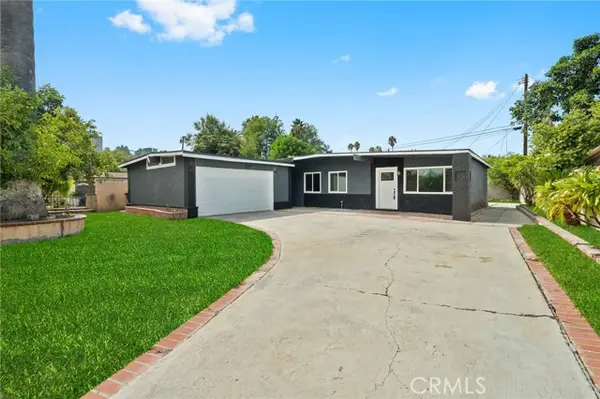 $799,000Pending4 beds 2 baths1,196 sq. ft.
529 Raminda, La Puente, CA 91744
MLS# CRDW26062663Listed by: LPT REALTY, INC $659,000Active3 beds 1 baths1,186 sq. ft.
611 Santo Oro, La Puente, CA 91744
MLS# AR26015111Listed by: ADAK PACIFIC REALTY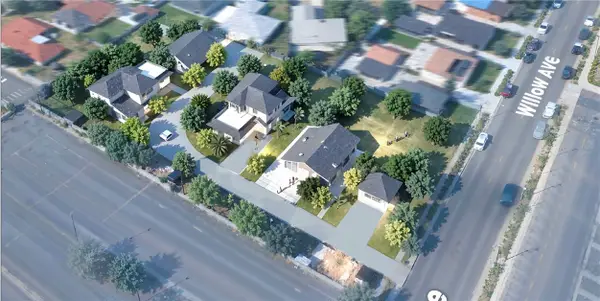 $1,780,000Active5 beds 3 baths2,849 sq. ft.
335 Willow Avenue, La Puente, CA 91746
MLS# TR26014017Listed by: PINNACLE REAL ESTATE GROUP $645,000Active3 beds 3 baths1,372 sq. ft.
15426 Hayland, La Puente, CA 91744
MLS# CV25271114Listed by: TRT CAPITAL $949,000Pending4 beds 3 baths2,339 sq. ft.
1850 Neff, La Puente, CA 91744
MLS# CV25273297Listed by: PRIME REAL ESTATE $599,000Active3 beds 1 baths868 sq. ft.
15937 Amar Road, La Puente, CA 91744
MLS# TR25201222Listed by: COLDWELL BANKER ENVISION $630,000Pending4 beds 2 baths1,514 sq. ft.
1084 Del Valle Avenue, La Puente, CA 91744
MLS# CV25190362Listed by: SUAREZ REALTY GROUP $679,000Pending5 beds 4 baths3,096 sq. ft.
1094 Molinar Avenue, La Puente, CA 91744
MLS# CV19273996Listed by: RE/MAX 2000 REALTY $749,999Pending4 beds 2 baths1,410 sq. ft.
138 Banbridge Avenue, La Puente, CA 91744
MLS# DW25149886Listed by: CENTURY 21 A BETTER SERVICE $799,000Pending4 beds 2 baths1,541 sq. ft.
16108 Maplegrove Street, La Puente, CA 91744
MLS# IV25044903Listed by: LUXURY COLLECTIVE $750,000Active3 beds 2 baths1,340 sq. ft.
16723 Wegman Drive, La Puente, CA 91744
MLS# CRIV23210523Listed by: PURPLE REIGN REALTY, INC $669,800Pending3 beds 1 baths1,392 sq. ft.
211 Common Ave, La Puente, CA 91744
MLS# CRTR23216383Listed by: COUNTRY QUEEN REAL ESTATE $725,000Pending3 beds 1 baths986 sq. ft.
16125 Central Avenue, La Puente, CA 91744
MLS# CL23318017Listed by: TEAM SPIRIT REALTY
Local realty services provided by:CENTURY 21 Epic, CENTURY 21 Masters, CENTURY 21 Jordan-Link, CENTURY 21 Sierra Properties
The information being provided by California Regional MLS (Southern California) is for the consumer's personal, non-commercial use and may not be used for any purpose other than to identify prospective properties consumer may be interested in purchasing. Any information relating to real estate for sale referenced on this web site comes from the Internet Data Exchange (IDX) program of the California Regional MLS (Southern California). CENTURY 21 Epic is not a Multiple Listing Service (MLS), nor does it offer MLS access. This website is a service of CENTURY 21 Epic, a broker participant of California Regional MLS (Southern California). This web site may reference real estate listing(s) held by a brokerage firm other than the broker and/or agent who owns this web site.
The accuracy of all information, regardless of source, including but not limited to open house information, square footages and lot sizes, is deemed reliable but not guaranteed and should be personally verified through personal inspection by and/or with the appropriate professionals. The data contained herein is copyrighted by California Regional MLS (Southern California) and is protected by all applicable copyright laws. Any unauthorized dissemination of this information is in violation of copyright laws and is strictly prohibited.
Copyright 2021 California Regional MLS (Southern California). All rights reserved.
This information is deemed reliable but not guaranteed. You should rely on this information only to decide whether or not to further investigate a particular property. BEFORE MAKING ANY OTHER DECISION, YOU SHOULD PERSONALLY INVESTIGATE THE FACTS (e.g. square footage and lot size) with the assistance of an appropriate professional. You may use this information only to identify properties you may be interested in investigating further. All uses except for personal, non-commercial use in accordance with the foregoing purpose are prohibited. Redistribution or copying of this information, any photographs or video tours is strictly prohibited. This information is derived from the Internet Data Exchange (IDX) service provided by San Diego MLS®. Displayed property listings may be held by a brokerage firm other than the broker and/or agent responsible for this display. The information and any photographs and video tours and the compilation from which they are derived is protected by copyright. Compilation © 2020 San Diego MLS®, Inc.
Neighborhoods near La Puente, CA
Zip codes near La Puente, CA
- 90601 homes for sale
- 90602 homes for sale
- 90603 homes for sale
- 90606 homes for sale
- 90631 homes for sale
- 91706 homes for sale
- 91722 homes for sale
- 91723 homes for sale
- 91724 homes for sale
- 91731 homes for sale
- 91732 homes for sale
- 91733 homes for sale
- 91744 homes for sale
- 91745 homes for sale
- 91746 homes for sale
- 91748 homes for sale
- 91789 homes for sale
- 91790 homes for sale
- 91791 homes for sale
- 91792 homes for sale
Popular searches near La Puente, CA
- Avocado Heights homes for sale
- Baldwin Park homes for sale
- Charter Oak homes for sale
- Covina homes for sale
- East San Gabriel Valley homes for sale
- El Monte homes for sale
- Hacienda Heights homes for sale
- Industry homes for sale
- La Habra Heights homes for sale
- North El Monte homes for sale
- Rose Hills homes for sale
- Rowland Heights homes for sale
- South El Monte homes for sale
- South San Jose Hills homes for sale
- Valinda homes for sale
- Vincent homes for sale
- Walnut homes for sale
- West Covina homes for sale
- West Puente Valley homes for sale
- Whittier homes for sale
Protect your home and budget from life's surprises with an Assurant Home Warranty, backed by a partner that supports you through every step of homeownership. Explore Plans.
©2026 Century 21 Real Estate LLC. All rights reserved. CENTURY 21®, the CENTURY 21 Logo and C21® are service marks owned by Century 21 Real Estate LLC. Century 21 Real Estate LLC fully supports the principles of the Fair Housing Act and the Equal Opportunity Act. Each office is independently owned and operated. Listing information is deemed reliable but not guaranteed accurate.