- Beacon Hill, Laguna Niguel homes for sale
- Bear Brand, Laguna Niguel homes for sale
- Colinas de Capistrano, Laguna Niguel homes for sale
- Connemara, San Juan Capistrano homes for sale
- Dana Point Town Center, Dana Point homes for sale
- Doheny Village, Capistrano Beach homes for sale
- El Niguel Heights, Laguna Niguel homes for sale
- Lantern Village, Dana Point homes for sale
- Marbella, San Juan Capistrano homes for sale
- Marina Hills, Laguna Niguel homes for sale
- Monarch Bay, Dana Point homes for sale
- Monarch Bay Terrace, Dana Point homes for sale
- Monarch Summit, Laguna Niguel homes for sale
- Niguel Shores, Dana Point homes for sale
- Niguel Summit, Laguna Niguel homes for sale
- Rancho Niguel, Laguna Niguel homes for sale
- San Joaquin Hills, Laguna Niguel homes for sale
- South Laguna Village, Laguna Beach homes for sale
- Three Arch Bay, Laguna Beach homes for sale
- Wycliffe Village, Ladera Ranch homes for sale
Laguna Heights, Laguna Niguel, CA - homes for sale
10 of 10 results displayed
- Coming Soon
 $1,888,000Coming Soon3 beds 3 baths
12 Saint Croix, Laguna Niguel, CA 92677
MLS# OC26066989Listed by: COLDWELL BANKER REALTY - New
 $1,798,000Active3 beds 3 baths1,881 sq. ft.
26 Salt Spray Drive, Laguna Niguel, CA 92677
MLS# OC26057821Listed by: DOUGLAS ELLIMAN OF CALIFORNIA  $1,249,000Active2 beds 2 baths1,237 sq. ft.
4 Saint Martin, Laguna Niguel, CA 92677
MLS# OC26054419Listed by: HOMESMART, EVERGREEN REALTY $1,099,000Active2 beds 3 baths1,200 sq. ft.
6 Stream, Laguna Niguel, CA 92677
MLS# OC26053030Listed by: BULLOCK RUSSELL RE SERVICES $1,200,000Active2 beds 2 baths1,250 sq. ft.
64 Saint Croix, Laguna Niguel, CA 92677
MLS# OC26051704Listed by: FIRST TEAM REAL ESTATE $1,350,000Pending3 beds 3 baths1,746 sq. ft.
1 Saint Isabella, Laguna Niguel, CA 92677
MLS# 219144379DAListed by: WINDERMERE REAL ESTATE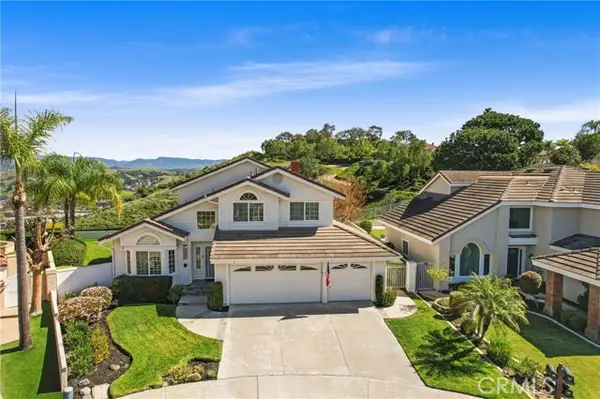 $1,800,000Pending3 beds 3 baths2,070 sq. ft.
4 Precipice, Laguna Niguel, CA 92677
MLS# CRLG26046876Listed by: REGENCY REAL ESTATE BROKERS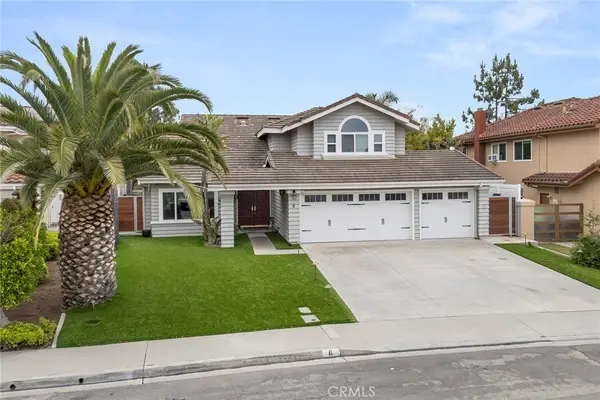 $2,350,000Pending5 beds 3 baths2,876 sq. ft.
6 Sand Pointe, Laguna Niguel, CA 92677
MLS# PW26029826Listed by: PARTNERS REAL ESTATE GROUP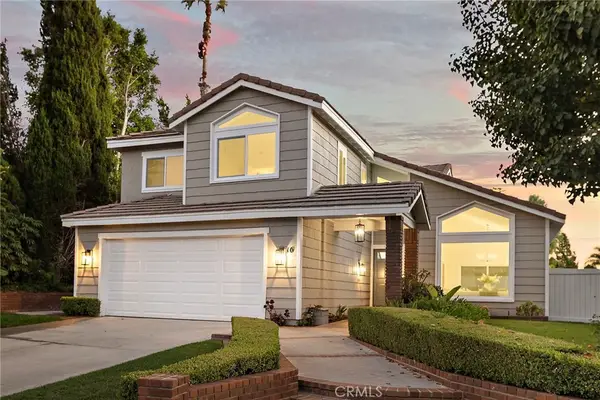 $1,849,000Active4 beds 3 baths2,147 sq. ft.
10 Serenity, Laguna Niguel, CA 92677
MLS# OC26002802Listed by: TMP PROPERTIES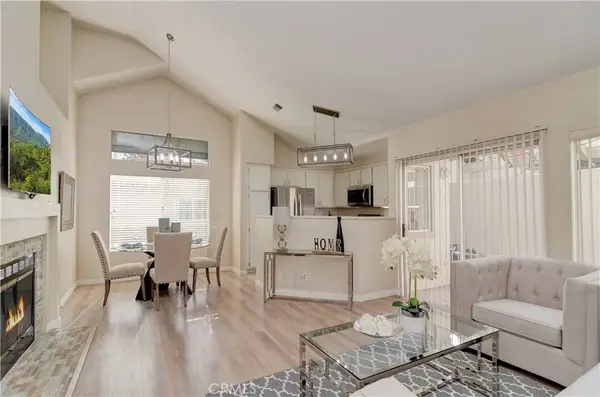 $379,900Pending1 beds 1 baths817 sq. ft.
13 Sandy Cove #60, Laguna Niguel, CA 92677
MLS# OC20016592Listed by: COLDWELL BANKER REALTY
Local realty services provided by:CENTURY 21 LOTUS, CENTURY 21 Affiliated, CENTURY 21 Sierra Properties
The information being provided by California Regional MLS (Southern California) is for the consumer's personal, non-commercial use and may not be used for any purpose other than to identify prospective properties consumer may be interested in purchasing. Any information relating to real estate for sale referenced on this web site comes from the Internet Data Exchange (IDX) program of the California Regional MLS (Southern California). CENTURY 21 LOTUS is not a Multiple Listing Service (MLS), nor does it offer MLS access. This website is a service of CENTURY 21 LOTUS, a broker participant of California Regional MLS (Southern California). This web site may reference real estate listing(s) held by a brokerage firm other than the broker and/or agent who owns this web site.
The accuracy of all information, regardless of source, including but not limited to open house information, square footages and lot sizes, is deemed reliable but not guaranteed and should be personally verified through personal inspection by and/or with the appropriate professionals. The data contained herein is copyrighted by California Regional MLS (Southern California) and is protected by all applicable copyright laws. Any unauthorized dissemination of this information is in violation of copyright laws and is strictly prohibited.
Copyright 2021 California Regional MLS (Southern California). All rights reserved.
This information is deemed reliable but not guaranteed. You should rely on this information only to decide whether or not to further investigate a particular property. BEFORE MAKING ANY OTHER DECISION, YOU SHOULD PERSONALLY INVESTIGATE THE FACTS (e.g. square footage and lot size) with the assistance of an appropriate professional. You may use this information only to identify properties you may be interested in investigating further. All uses except for personal, non-commercial use in accordance with the foregoing purpose are prohibited. Redistribution or copying of this information, any photographs or video tours is strictly prohibited. This information is derived from the Internet Data Exchange (IDX) service provided by San Diego MLS®. Displayed property listings may be held by a brokerage firm other than the broker and/or agent responsible for this display. The information and any photographs and video tours and the compilation from which they are derived is protected by copyright. Compilation © 2020 San Diego MLS®, Inc.
Popular neighborhoods near Laguna Heights, Laguna Niguel, CA
Zip codes near Laguna Heights, Laguna Niguel, CA
- 92603 homes for sale
- 92610 homes for sale
- 92618 homes for sale
- 92624 homes for sale
- 92625 homes for sale
- 92629 homes for sale
- 92630 homes for sale
- 92637 homes for sale
- 92651 homes for sale
- 92653 homes for sale
- 92656 homes for sale
- 92657 homes for sale
- 92673 homes for sale
- 92675 homes for sale
- 92677 homes for sale
- 92679 homes for sale
- 92688 homes for sale
- 92691 homes for sale
- 92692 homes for sale
- 92694 homes for sale
Counties near Laguna Heights, Laguna Niguel, CA
Protect your home and budget from life's surprises with an Assurant Home Warranty, backed by a partner that supports you through every step of homeownership. Explore Plans.
©2026 Century 21 Real Estate LLC. All rights reserved. CENTURY 21®, the CENTURY 21 Logo and C21® are service marks owned by Century 21 Real Estate LLC. Century 21 Real Estate LLC fully supports the principles of the Fair Housing Act and the Equal Opportunity Act. Each office is independently owned and operated. Listing information is deemed reliable but not guaranteed accurate.