- Barhamsville homes for sale
- Berkeley homes for sale
- Buena Vista homes for sale
- Charles City homes for sale
- Claremont homes for sale
- Jamestown homes for sale
- Lanexa homes for sale
- Little Plymouth homes for sale
- Mattaponi homes for sale
- New Kent homes for sale
- Powhatan homes for sale
- Providence Forge homes for sale
- Quinton homes for sale
- Saluda homes for sale
- Shacklefords homes for sale
- Shanghai homes for sale
- Stonehouse homes for sale
- Toano homes for sale
- West Point homes for sale
- Williamsburg homes for sale
23089, VA - homes for sale
31 of 31 results displayed
- New
 $600,000Active3 beds 2 baths2,133 sq. ft.
1025 Riverside Drive, Lanexa, VA 23089
MLS# 10627412Listed by: Liz Moore & Associates LLC 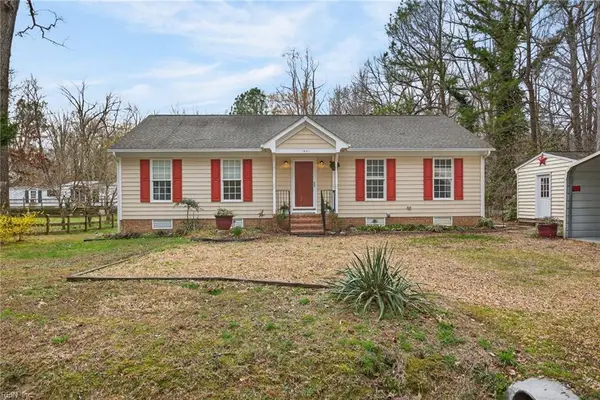 $399,000Active2 beds 2 baths1,344 sq. ft.
7641 Beechwood Drive, Lanexa, VA 23089
MLS# 10625494Listed by: Liz Moore & Associates LLC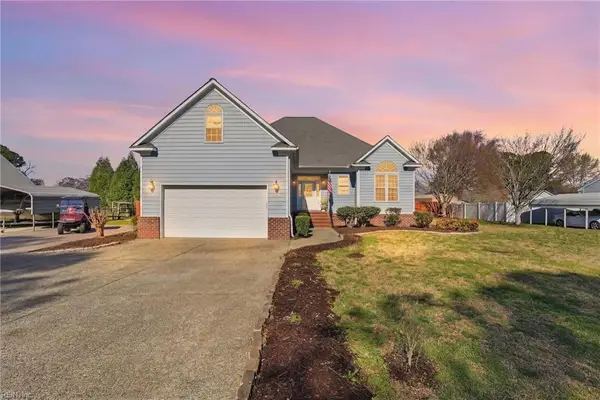 $505,000Active3 beds 3 baths2,267 sq. ft.
7221 Otey Drive, Lanexa, VA 23089
MLS# 10625413Listed by: Garrett Realty Partners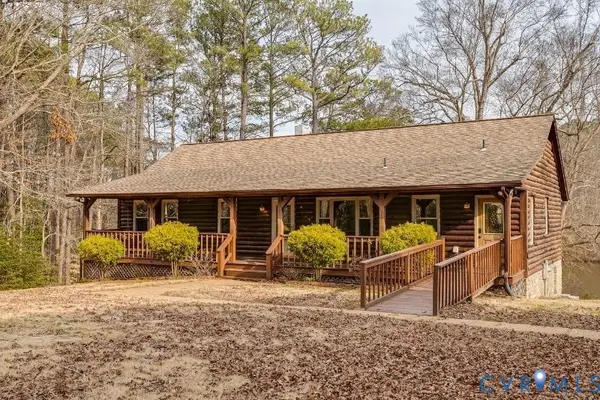 $869,950Active6 beds 3 baths3,320 sq. ft.
14401 Doctors Creek Road, Lanexa, VA 23089
MLS# 2604744Listed by: TOWNE & COUNTRY REAL ESTATE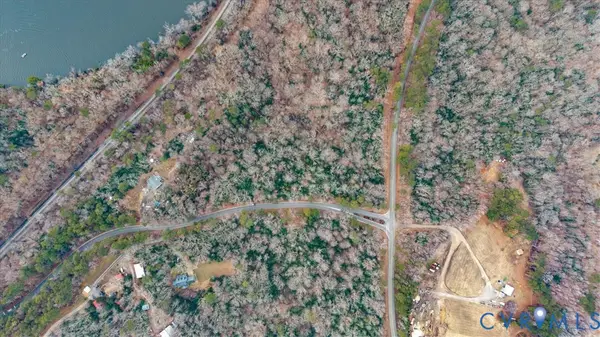 $95,000Active2.7 Acres
2.7 AC Colony Trail, New Kent, VA 23089
MLS# 2604904Listed by: HOWARD HANNA WILLIAM E WOOD $95,000Active2.7 Acres
2.7 AC Colony Trail, New Kent, VA 23124
MLS# 10623104Listed by: Howard Hanna Real Estate Svcs. $324,900Pending3 beds 1 baths1,280 sq. ft.
1026 Stewarts Road, Lanexa, VA 23089
MLS# 10622682Listed by: Virginia Capital Realty LLC $324,900Pending3 beds 1 baths1,400 sq. ft.
3641 Good Hope Road, Lanexa, VA 23089
MLS# 10619882Listed by: Howard Hanna Real Estate Svcs. $369,475Pending3 beds 2 baths1,440 sq. ft.
7085 Cunningham Drive, Toano, VA 23168
MLS# 10619807Listed by: BHHS RW Towne Realty $550,000Active5.71 Acres
00 Turners Landing Road, Lanexa, VA 23089
MLS# 2602622Listed by: HOMETOWN REALTY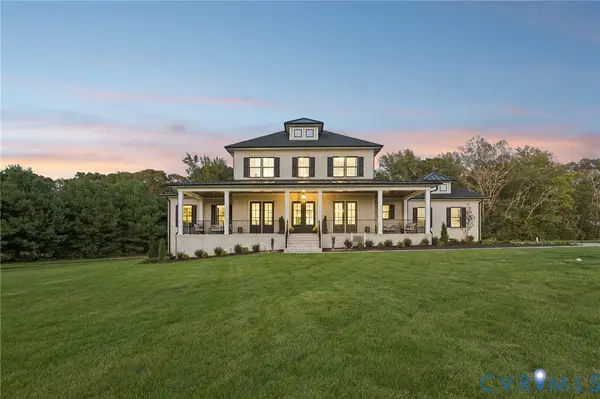 $1,276,630Active4 beds 4 baths4,067 sq. ft.
00 Turners Landing Road, Lanexa, VA 23089
MLS# 2602638Listed by: HOMETOWN REALTY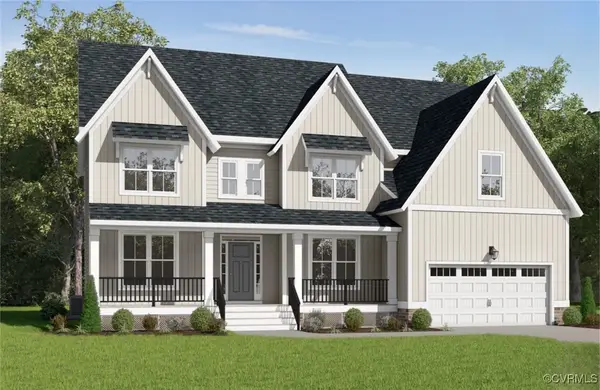 $754,950Pending4 beds 3 baths2,881 sq. ft.
14310 Walsingham Way, Lanexa, VA 23089
MLS# 2509939Listed by: VIRGINIA COLONY REALTY INC $579,000Active4 beds 3 baths3,467 sq. ft.
7609 Beechwood Drive, Lanexa, VA 23089
MLS# 10618238Listed by: Garrett Realty Partners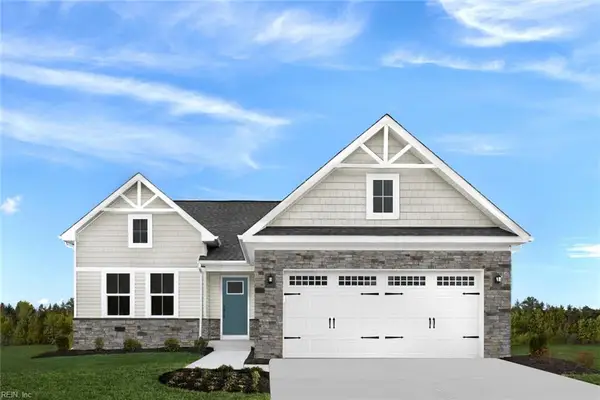 $430,975Pending4 beds 3 baths2,560 sq. ft.
7055 Cunningham Drive, Toano, VA 23168
MLS# 10616882Listed by: BHHS RW Towne Realty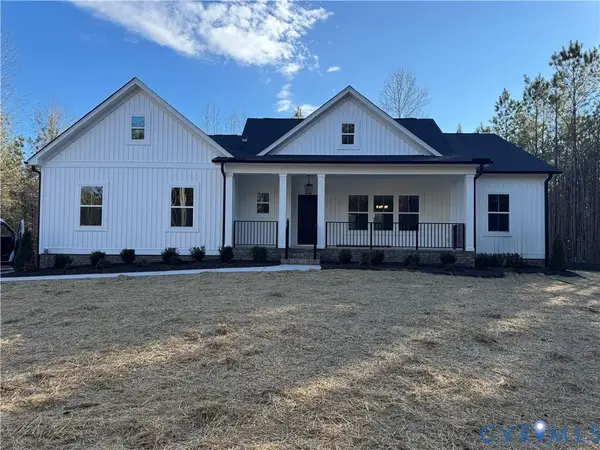 $664,900Active3 beds 2 baths1,689 sq. ft.
TBD Pocahontas Trail, Providence Forge, VA 23089
MLS# 2601413Listed by: HOMETOWN REALTY $75,000Active1 Acres
TBD S Waterside Drive, Lanexa, VA 23089
MLS# 2600443Listed by: UNITED REAL ESTATE RICHMOND $674,900Pending3 beds 2 baths1,689 sq. ft.
12920 Pocahontas Trail, Providence Forge, VA 23089
MLS# 2532832Listed by: HOMETOWN REALTY $450,000Active4 beds 4 baths2,688 sq. ft.
517 W Riverside Dr, LANEXA, VA 23089
MLS# VANK2000130Listed by: KELLER WILLIAMS REALTY $809,950Active4 beds 4 baths4,070 sq. ft.
2-3 Old Telegraph Court, New Kent, VA 23089
MLS# 2531165Listed by: HOMETOWN REALTY SERVICES INC $633,000Pending3 beds 3 baths1,843 sq. ft.
15830 New Kent Highway, Lanexa, VA 23089
MLS# 10609066Listed by: Howard Hanna Real Estate Svcs. $374,000Active3 beds 3 baths1,600 sq. ft.
2359 N Waterside Drive, Lanexa, VA 23089
MLS# 2606946Listed by: METRO REALTY SERVICES INC $487,500Active3 beds 2 baths1,752 sq. ft.
0 N Waterside Drive, Lanexa, VA 23089
MLS# 2526822Listed by: HIGHLANDER REALTY LLC $145,000Active5.21 Acres
00 N Waterside Drive, Lanexa, VA 23089
MLS# 2525725Listed by: COLDWELL BANKER TRADITIONS $950,025Pending4 beds 4 baths4,070 sq. ft.
002 Homestead Road, Lanexa, VA 23089
MLS# 2518834Listed by: HOMETOWN REALTY $824,900Pending4 beds 4 baths4,040 sq. ft.
001 Homestead Road, Lanexa, VA 23089
MLS# 2518825Listed by: HOMETOWN REALTY $758,950Pending4 beds 3 baths3,459 sq. ft.
Lot 6 Walsingham Way, Lanexa, VA 23089
MLS# 2518501Listed by: VIRGINIA COLONY REALTY INC $615,950Pending4 beds 4 baths2,958 sq. ft.
Lot 41 E. Vaidens Pond Road, Lanexa, VA 23089
MLS# 2511575Listed by: VIRGINIA COLONY REALTY INC $70,000Active1.9 Acres
0 Two Rivers Trail, Lanexa, VA 23089
MLS# 2600881Listed by: EXP REALTY LLC- New
 $825,000Active3 beds 4 baths5,089 sq. ft.
276 Colony Trail, Lanexa, VA 23089
MLS# 10626231Listed by: Howard Hanna Real Estate Svcs.  $120,000Pending5 Acres
0 Good Hope Road, Lanexa, VA 23089
MLS# 2501743Listed by: COLDWELL BANKER TRADITIONS $139,000Active8.83 Acres
15507 Fort James Court, Lanexa, VA 23089
MLS# 10419528Listed by: BHHS RW Towne Realty
Local realty services provided by:CENTURY 21 Realty @ Home, CENTURY 21 Charles Smith Agency, Inc.
The listings data displayed on this medium comes in part from the Real Estate Information Network Inc. (REIN) and has been authorized by participating listing Broker Members of REIN for display. REIN's listings are based upon Data submitted by its Broker Members, and REIN therefore makes no representation or warranty regarding the accuracy of the Data. All users of REIN's listings database should confirm the accuracy of the listing information directly with the listing agent. 2026 REIN. REIN's listings Data and information is protected under federal copyright laws. Federal law prohibits, among other acts, the unauthorized copying or alteration of, or preparation of derivative works from, all or any part of copyrighted materials, including certain compilations of Data and information. COPYRIGHT VIOLATORS MAY BE SUBJECT TO SEVERE FINES AND PENALTIES UNDER FEDERAL LAW. REIN updates its listings on a daily basis. Data last updated: March 28, 2026 This application does not include information on all of the properties available for sale at this time.
Some listings may be duplicated in the search results due to the co-mingling of listings from more than one multiple listing service. Should there be different listing information between the duplicated listings; user is advised to verify the accuracy of the listing information before making any financial decisions.
2026 REIN, Inc. Information Deemed Reliable But Not Guaranteed.
Popular searches near 23089
Popular neighborhoods near 23089
- Carleton Falls, Newport News homes for sale
- Chimborazo, Richmond homes for sale
- Church Hill, Richmond homes for sale
- Church Hill North, Richmond homes for sale
- East Side, Richmond homes for sale
- Ford's Colony, Williamsburg homes for sale
- Fulton, Henrico homes for sale
- Kingsmill, Williamsburg homes for sale
- Lees Mill, Newport News homes for sale
- New Town, Williamsburg homes for sale
- Oakwood, Richmond homes for sale
- Skiffes Creek Landing, Newport News homes for sale
- Snidow, Newport News homes for sale
- Stonehouse, Toano homes for sale
- Stoney Brook, Newport News homes for sale
- The Forest, Newport News homes for sale
- The Governor's Land At Two Rivers, Williamsburg homes for sale
- Village of Rockett's Landing, Henrico homes for sale
- Warwick Landing, Newport News homes for sale
- Woodville, Richmond homes for sale
Counties near Lanexa, 23089
- Charles City County homes for sale
- Colonial Heights city County homes for sale
- Essex County homes for sale
- Gloucester County homes for sale
- Henrico County homes for sale
- Hopewell city County homes for sale
- James City County homes for sale
- King and Queen County homes for sale
- King William County homes for sale
- Lancaster County homes for sale
- Mathews County homes for sale
- Middlesex County homes for sale
- New Kent County homes for sale
- Newport News city County homes for sale
- Petersburg city County homes for sale
- Prince George County homes for sale
- Richmond County homes for sale
- Richmond city County homes for sale
- Surry County homes for sale
- Williamsburg city County homes for sale
Protect your home and budget from life's surprises with an Assurant Home Warranty, backed by a partner that supports you through every step of homeownership. Explore Plans.
©2026 Century 21 Real Estate LLC. All rights reserved. CENTURY 21®, the CENTURY 21 Logo and C21® are service marks owned by Century 21 Real Estate LLC. Century 21 Real Estate LLC fully supports the principles of the Fair Housing Act and the Equal Opportunity Act. Each office is independently owned and operated. Listing information is deemed reliable but not guaranteed accurate.