- Blue Diamond homes for sale
- Boulder City homes for sale
- Clark homes for sale
- Cold Creek homes for sale
- Enterprise homes for sale
- Henderson homes for sale
- Indian Springs homes for sale
- Jean homes for sale
- Las Vegas homes for sale
- Moapa homes for sale
- Mt Charleston homes for sale
- North Las Vegas homes for sale
- Pahrump homes for sale
- Paradise homes for sale
- Sandy Valley homes for sale
- Spring Valley homes for sale
- Summerlin South homes for sale
- Sunrise Manor homes for sale
- Whitney homes for sale
- Winchester homes for sale
89108, NV - homes for sale
288 of 288 results displayed
- New
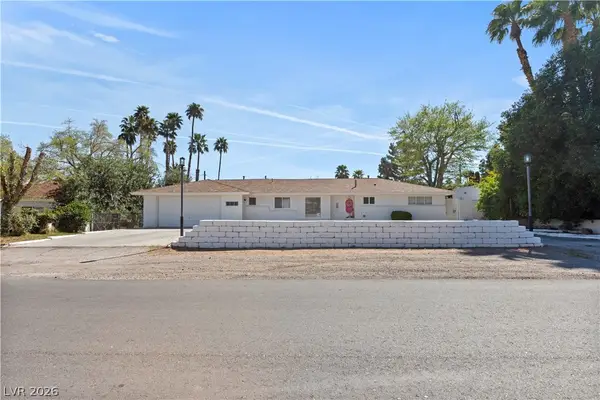
 $235,000Active0.47 Acres
5638 Alfred Drive, Las Vegas, NV 89108
MLS# 2768608Listed by: GALINDO GROUP REAL ESTATE - New
 $195,000Active2 beds 2 baths888 sq. ft.
2111 Hussium Hills Street #202, Las Vegas, NV 89108
MLS# 2768990Listed by: AVALON REALTY & OAKTREE MGMT - New
 $375,000Active4 beds 2 baths1,410 sq. ft.
6325 Portola Road, Las Vegas, NV 89108
MLS# 2768821Listed by: IRON MOUNTAIN REALTY - New
 $185,000Active1 beds 1 baths720 sq. ft.
2451 N Rainbow Boulevard #1051, Las Vegas, NV 89108
MLS# 2766642Listed by: SIMPLY VEGAS - New
 $249,000Active2 beds 2 baths1,342 sq. ft.
3917 Lazy Pine Street #102, Las Vegas, NV 89108
MLS# 2768391Listed by: SIGNATURE REAL ESTATE GROUP - New
 $345,000Active4 beds 2 baths1,205 sq. ft.
4104 Broadriver Drive, Las Vegas, NV 89108
MLS# 2768474Listed by: REALTY ONE GROUP, INC - New
 $153,000Active1 beds 1 baths695 sq. ft.
2801 N Rainbow Boulevard #133, Las Vegas, NV 89108
MLS# 2768303Listed by: MEGA REALTY - New
 $199,000Active2 beds 2 baths900 sq. ft.
2136 Bavington Drive #C, Las Vegas, NV 89108
MLS# 2768088Listed by: EXP REALTY - New
 $249,000Active2 beds 2 baths1,156 sq. ft.
3500 Winterhaven Street #101, Las Vegas, NV 89108
MLS# 2768291Listed by: RED ROCK REAL ESTATE - New
 $399,000Active4 beds 2 baths1,775 sq. ft.
5809 Pebble Beach Boulevard, Las Vegas, NV 89108
MLS# 2768189Listed by: PLATINUM REAL ESTATE PROF - New
 $429,000Active4 beds 3 baths1,744 sq. ft.
4140 Compass Rose Way, Las Vegas, NV 89108
MLS# 2767770Listed by: BHHS NEVADA PROPERTIES - New
 $329,900Active2 beds 2 baths1,125 sq. ft.
6576 Gazelle Drive, Las Vegas, NV 89108
MLS# 2768143Listed by: LIFE REALTY DISTRICT  $500,000Pending5 beds 3 baths2,105 sq. ft.
5701 Avenida Tampico, Las Vegas, NV 89108
MLS# 2767995Listed by: EXP REALTY- New
 $374,500Active4 beds 2 baths1,402 sq. ft.
1400 Pyramid Drive, Las Vegas, NV 89108
MLS# 2767839Listed by: MONOPOLY REALTY & MGMT INC - New
 $439,900Active3 beds 2 baths1,521 sq. ft.
1936 St Lawrence Drive, Las Vegas, NV 89108
MLS# 2767869Listed by: REALTY ONE GROUP, INC - New
 $249,500Active3 beds 2 baths1,212 sq. ft.
6500 W Lake Mead Boulevard #227, Las Vegas, NV 89108
MLS# 2767287Listed by: HUNTINGTON & ELLIS, A REAL EST - New
 $434,000Active3 beds 2 baths1,208 sq. ft.
5805 Maynard Avenue, Las Vegas, NV 89108
MLS# 2767588Listed by: CENTURY 21 CONSOLIDATED  $231,000Pending3 beds 2 baths1,188 sq. ft.
5820 Carmen Boulevard, Las Vegas, NV 89108
MLS# 2766836Listed by: EXP REALTY- New
 $325,000Active3 beds 2 baths1,175 sq. ft.
3300 Point Lobos Drive, Las Vegas, NV 89108
MLS# 2767507Listed by: UNITED REALTY GROUP - New
 $479,900Active5 beds 3 baths2,181 sq. ft.
2429 Charteroak Street, Las Vegas, NV 89108
MLS# 2767139Listed by: GALINDO GROUP REAL ESTATE - New
 $230,000Active3 beds 2 baths1,237 sq. ft.
2451 N Rainbow Boulevard #2127, Las Vegas, NV 89108
MLS# 2767306Listed by: BHHS NEVADA PROPERTIES - New
 $429,995Active4 beds 3 baths1,763 sq. ft.
2701 Riley Oaks Court, Las Vegas, NV 89108
MLS# 2767346Listed by: INFINITY BROKERAGE - New
 $205,000Active2 beds 2 baths900 sq. ft.
2032 Bavington Drive #B, Las Vegas, NV 89108
MLS# 2767158Listed by: LINDA BOTHOF - New
 $395,000Active3 beds 2 baths1,307 sq. ft.
6557 Beacon Road, Las Vegas, NV 89108
MLS# 2766219Listed by: RE/MAX LEGACY - New
 $380,000Active3 beds 2 baths1,548 sq. ft.
2424 Indian Sage Way, Las Vegas, NV 89108
MLS# 2766605Listed by: REALTY ONE GROUP, INC  $375,000Pending4 beds 2 baths1,562 sq. ft.
6317 Cambria Avenue, Las Vegas, NV 89108
MLS# 2763505Listed by: SIGNATURE REAL ESTATE GROUP- New
 $208,900Active2 beds 2 baths1,081 sq. ft.
4428 W Lake Mead Boulevard #101, Las Vegas, NV 89108
MLS# 2766289Listed by: REALTY ONE GROUP, INC - New
 $459,900Active3 beds 2 baths1,686 sq. ft.
4167 Pleasant Road, Las Vegas, NV 89108
MLS# 2766253Listed by: LIFE REALTY DISTRICT  $188,500Active2 beds 2 baths944 sq. ft.
2801 N Rainbow Boulevard #273, Las Vegas, NV 89108
MLS# 2765995Listed by: REDFIN $180,000Active2 beds 2 baths1,128 sq. ft.
2451 N Rainbow Boulevard #1026, Las Vegas, NV 89108
MLS# 2765962Listed by: SIGNATURE REAL ESTATE GROUP $345,000Active2 beds 1 baths944 sq. ft.
6300 Espinosa Avenue, Las Vegas, NV 89108
MLS# 2765973Listed by: THE COLLECTION- Open Thu, 11am to 4pm
 $474,995Active4 beds 2 baths2,192 sq. ft.
2129 N Michael Way, Las Vegas, NV 89108
MLS# 2765538Listed by: INFINITY BROKERAGE  $389,900Active3 beds 2 baths1,413 sq. ft.
6805 Selkirk Circle, Las Vegas, NV 89108
MLS# 2763992Listed by: SIGNATURE REAL ESTATE GROUP $489,900Active4 beds 2 baths2,208 sq. ft.
4428 Parkchester Drive, Las Vegas, NV 89108
MLS# 2765754Listed by: ELITE REALTY $389,900Active4 beds 2 baths1,548 sq. ft.
2512 Indian Sage Way, Las Vegas, NV 89108
MLS# 2765711Listed by: EXP REALTY $214,900Active2 beds 2 baths728 sq. ft.
2128 Chertsey Drive #C, Las Vegas, NV 89108
MLS# 2764275Listed by: UNITED REALTY GROUP $399,000Pending4 beds 2 baths1,848 sq. ft.
6229 Blossomwood Avenue, Las Vegas, NV 89108
MLS# 2765508Listed by: HUNTINGTON & ELLIS, A REAL EST $215,000Active2 beds 2 baths945 sq. ft.
1858 N Decatur Boulevard #101, Las Vegas, NV 89108
MLS# 2765227Listed by: ERA BROKERS CONSOLIDATED $430,000Active3 beds 3 baths1,676 sq. ft.
2404 Cherrywood Street, Las Vegas, NV 89108
MLS# 2764156Listed by: REDFIN $199,999Pending2 beds 2 baths1,032 sq. ft.
2341 Wooster Circle #B, Las Vegas, NV 89108
MLS# 2765394Listed by: LYONS SHARE REAL ESTATE $428,000Pending3 beds 2 baths1,653 sq. ft.
6808 Selkirk Circle, Las Vegas, NV 89108
MLS# 2763535Listed by: COLDWELL BANKER PREMIER $825,000Active-- beds -- baths4,244 sq. ft.
6233 Ilanos Lane, Las Vegas, NV 89108
MLS# 2764819Listed by: IHOME REALTY LLC $470,000Pending3 beds 3 baths1,603 sq. ft.
1512 Winwood Street, Las Vegas, NV 89108
MLS# 2737264Listed by: LAS VEGAS SOTHEBY'S INT'L $525,000Pending2 beds 2 baths1,847 sq. ft.
6720 Buckskin Avenue, Las Vegas, NV 89108
MLS# 2765135Listed by: REAL BROKER LLC $165,000Active2 beds 2 baths1,081 sq. ft.
4316 W Lake Mead Boulevard #101, Las Vegas, NV 89108
MLS# 2765163Listed by: BRAZILL TEAM REAL ESTATE $415,000Active3 beds 3 baths1,711 sq. ft.
3909 Rhine Way, Las Vegas, NV 89108
MLS# 2762913Listed by: SIGNATURE REAL ESTATE GROUP $499,000Pending4 beds 3 baths2,134 sq. ft.
3017 Brair Knoll Court, Las Vegas, NV 89108
MLS# 2764340Listed by: REALTY ONE GROUP, INC $425,000Active3 beds 3 baths1,489 sq. ft.
6721 Evanston Avenue, Las Vegas, NV 89108
MLS# 2762822Listed by: REAL BROKER LLC $279,999Active2 beds 2 baths1,026 sq. ft.
6469 Melody Rose Avenue, Las Vegas, NV 89108
MLS# 2763760Listed by: REALTY ONE GROUP, INC $189,000Pending2 beds 2 baths1,128 sq. ft.
2451 N Rainbow Blvd #1083, Las Vegas, NV 89108
MLS# 2758429Listed by: JMG REAL ESTATE $460,000Pending4 beds 3 baths1,859 sq. ft.
6820 War Eagle Circle, Las Vegas, NV 89108
MLS# 2764373Listed by: HUNTINGTON & ELLIS, A REAL EST $454,900Active3 beds 2 baths1,860 sq. ft.
2825 Glen Aulin Street, Las Vegas, NV 89108
MLS# 2764390Listed by: MOTION PROPERTIES $310,000Active3 beds 2 baths1,289 sq. ft.
3605 Spanish Butterfly Street #101, Las Vegas, NV 89108
MLS# 2763037Listed by: REALTY ONE GROUP, INC $433,000Active4 beds 3 baths1,841 sq. ft.
6437 Peachwood Road, Las Vegas, NV 89108
MLS# 2764331Listed by: NEVADA REAL ESTATE CORP $669,000Active4 beds 3 baths2,578 sq. ft.
1885 Valley Drive, Las Vegas, NV 89108
MLS# 2762381Listed by: DEVEN CHASE REALTY $285,000Pending2 beds 1 baths896 sq. ft.
6676 Fredonia Drive, Las Vegas, NV 89108
MLS# 2764046Listed by: REALTY ONE GROUP, INC $499,000Active4 beds 2 baths1,807 sq. ft.
3709 Broxburn Street, Las Vegas, NV 89108
MLS# 2760007Listed by: COLDWELL BANKER PREMIER $355,000Pending3 beds 3 baths1,483 sq. ft.
6388 Blue Twilight Court, Las Vegas, NV 89108
MLS# 2764109Listed by: LYONS SHARE REAL ESTATE $415,000Active3 beds 2 baths1,373 sq. ft.
3512 Corona Del Mar Drive, Las Vegas, NV 89108
MLS# 2763960Listed by: KELLER WILLIAMS MARKETPLACE $219,000Active2 beds 2 baths728 sq. ft.
2140 Chertsey Drive #B, Las Vegas, NV 89108
MLS# 2763643Listed by: ELITE REALTY $340,000Pending2 beds 2 baths1,213 sq. ft.
6540 Burlwood Way, Las Vegas, NV 89108
MLS# 2763512Listed by: KIM'S REALTY SOLUTIONS $375,000Active3 beds 2 baths1,236 sq. ft.
3712 Rainy River Road, Las Vegas, NV 89108
MLS# 2761327Listed by: SIGNATURE REAL ESTATE GROUP $215,000Active2 beds 2 baths1,075 sq. ft.
1401 N Michael Way #228, Las Vegas, NV 89108
MLS# 2763355Listed by: PLATINUM REAL ESTATE PROF $188,000Active2 beds 2 baths986 sq. ft.
1438 N Jones Boulevard, Las Vegas, NV 89108
MLS# 2763034Listed by: REAL BROKER LLC $209,998Active2 beds 2 baths1,122 sq. ft.
6033 Vegas Drive, Las Vegas, NV 89108
MLS# 2763322Listed by: REALTY ONE GROUP, INC $274,500Active2 beds 2 baths1,041 sq. ft.
5424 Comchec Way #103, Las Vegas, NV 89108
MLS# 2763243Listed by: VISION REALTY GROUP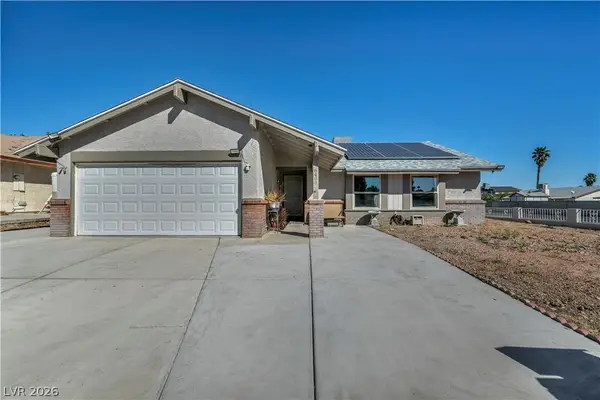 $398,000Active3 beds 2 baths1,734 sq. ft.
6400 Starcrest Drive, Las Vegas, NV 89108
MLS# 2760426Listed by: CENTURY 21 AMERICANA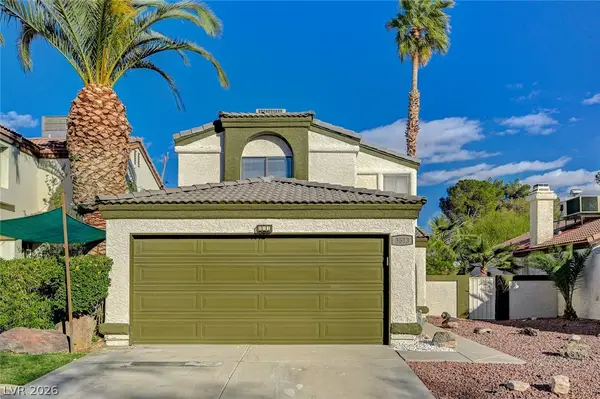 $399,900Pending3 beds 3 baths2,038 sq. ft.
3613 Rainy River Road, Las Vegas, NV 89108
MLS# 2762888Listed by: KELLER WILLIAMS MARKETPLACE $299,000Active3 beds 2 baths1,289 sq. ft.
3605 Galatea Street #101, Las Vegas, NV 89108
MLS# 2761941Listed by: RUSTIC PROPERTIES $287,000Active2 beds 3 baths1,091 sq. ft.
6964 Coral Rock Drive, Las Vegas, NV 89108
MLS# 2759034Listed by: SCOFIELD GROUP LLC $335,000Active3 beds 2 baths1,490 sq. ft.
901 Artesia Way, Las Vegas, NV 89108
MLS# 2762546Listed by: REALTY BROKERS, INC $390,000Active3 beds 3 baths1,642 sq. ft.
4332 Fox Point Drive, Las Vegas, NV 89108
MLS# 2762497Listed by: LAS VEGAS REALTY LLC $250,000Pending2 beds 2 baths900 sq. ft.
1703 Discus Drive, Las Vegas, NV 89108
MLS# 2760782Listed by: REALTY OF AMERICA LLC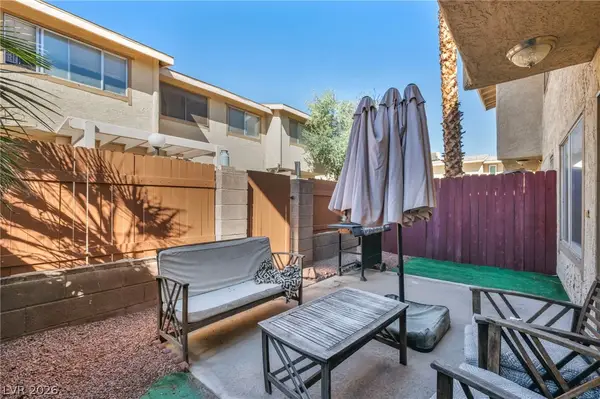 $275,000Active2 beds 2 baths1,051 sq. ft.
6443 Big Pine Way, Las Vegas, NV 89108
MLS# 2761929Listed by: LPT REALTY, LLC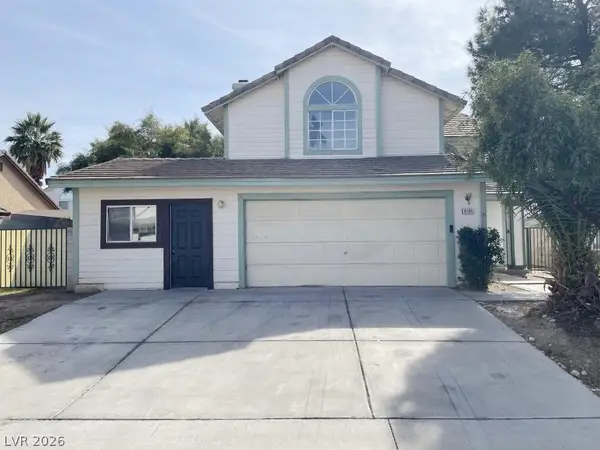 $243,000Pending4 beds 3 baths2,190 sq. ft.
6105 Castle Bay Drive, Las Vegas, NV 89108
MLS# 2758952Listed by: HASTINGS BROKERAGE LTD $400,000Pending4 beds 2 baths1,236 sq. ft.
6656 Light Breeze Drive, Las Vegas, NV 89108
MLS# 2761981Listed by: REALTY OF AMERICA LLC $195,000Active2 beds 2 baths728 sq. ft.
2124 Chertsey Drive #B, Las Vegas, NV 89108
MLS# 2761842Listed by: ELITE REALTY- Open Sat, 12 to 3pm
 $425,000Active3 beds 2 baths1,315 sq. ft.
2300 Steinke Lane, Las Vegas, NV 89108
MLS# 2760441Listed by: KEY REALTY  $199,999Active2 beds 2 baths945 sq. ft.
1812 N Decatur Boulevard #101, Las Vegas, NV 89108
MLS# 2760719Listed by: KELLER WILLIAMS MARKETPLACE $199,999Active2 beds 2 baths945 sq. ft.
1804 N Decatur Boulevard #104, Las Vegas, NV 89108
MLS# 2760736Listed by: KELLER WILLIAMS MARKETPLACE $424,900Active3 beds 2 baths1,558 sq. ft.
2808 Mountain Violet Court, Las Vegas, NV 89108
MLS# 2761592Listed by: WEST CAPITAL REAL ESTATE & INV $285,000Active3 beds 2 baths1,182 sq. ft.
6409 Blue Blossom Avenue, Las Vegas, NV 89108
MLS# 2758185Listed by: SIGNATURE REAL ESTATE GROUP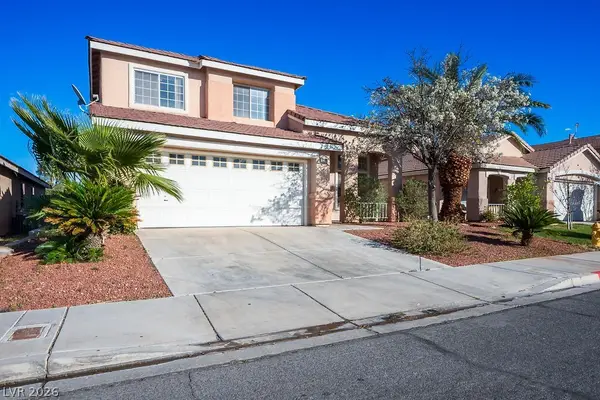 $400,000Pending3 beds 3 baths1,702 sq. ft.
2340 Steinke Lane, Las Vegas, NV 89108
MLS# 2760473Listed by: REALTY ONE GROUP, INC $299,999Pending3 beds 3 baths1,448 sq. ft.
3908 Sweet Pine Street #102, Las Vegas, NV 89108
MLS# 2760232Listed by: REALTY ONE GROUP, INC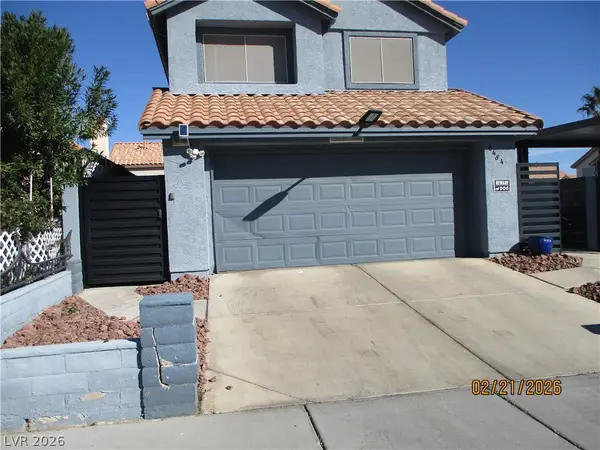 $467,000Active3 beds 3 baths1,755 sq. ft.
6484 Lombard Drive, Las Vegas, NV 89108
MLS# 2760691Listed by: SCOFIELD GROUP LLC $230,000Active3 beds 2 baths1,237 sq. ft.
2451 N Rainbow Boulevard #1078, Las Vegas, NV 89108
MLS# 2759738Listed by: PAK HOME REALTY $495,000Active0.4 Acres
Lake Mead And Fairhaven, Las Vegas, NV 89108
MLS# 2760192Listed by: LPT REALTY, LLC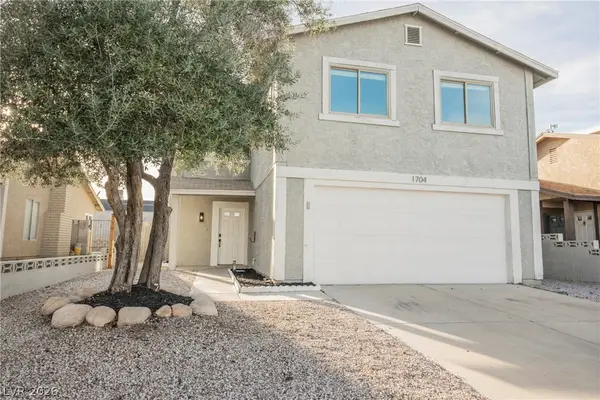 $449,900Active4 beds 3 baths1,680 sq. ft.
1704 Kismet Circle, Las Vegas, NV 89108
MLS# 2759828Listed by: PLATINUM REAL ESTATE PROF $359,500Pending3 beds 2 baths1,874 sq. ft.
5917 Martita Avenue, Las Vegas, NV 89108
MLS# 2760113Listed by: LPT REALTY, LLC $220,000Active2 beds 2 baths728 sq. ft.
2132 Chertsey Drive #B, Las Vegas, NV 89108
MLS# 2759867Listed by: REALTY ONE GROUP, INC $350,000Pending3 beds 2 baths1,221 sq. ft.
6516 Deadwood Road, Las Vegas, NV 89108
MLS# 2760072Listed by: PERLA HERRERA REALTY $359,900Active2 beds 2 baths1,033 sq. ft.
6344 Moonmist Avenue, Las Vegas, NV 89108
MLS# 2758431Listed by: ERA BROKERS CONSOLIDATED $230,000Active0.47 Acres
Peak And Jones, Las Vegas, NV 89108
MLS# 2758343Listed by: SIMPLY VEGAS $350,000Pending3 beds 2 baths1,221 sq. ft.
2528 Charteroak Street, Las Vegas, NV 89108
MLS# 2759069Listed by: EXP REALTY $305,000Active3 beds 3 baths1,408 sq. ft.
2753 Stargate Street, Las Vegas, NV 89108
MLS# 2759416Listed by: NEW STAR REALTY $410,000Pending4 beds 2 baths1,480 sq. ft.
5912 Carpenteria Way, Las Vegas, NV 89108
MLS# 2759170Listed by: SPHERE REAL ESTATE $299,888Active2 beds 1 baths784 sq. ft.
1713 Barrel Cactus Court, Las Vegas, NV 89108
MLS# 2757849Listed by: REAL BROKER LLC $435,000Pending4 beds 3 baths1,558 sq. ft.
1968 Weenap Drive, Las Vegas, NV 89108
MLS# 2759216Listed by: REALTY ONE GROUP, INC $339,990Active3 beds 3 baths1,357 sq. ft.
6311 Blue Twilight Court, Las Vegas, NV 89108
MLS# 2758835Listed by: UNITED REALTY GROUP $230,000Active3 beds 2 baths1,237 sq. ft.
2451 N Rainbow Boulevard #2123, Las Vegas, NV 89108
MLS# 2758601Listed by: KELLER WILLIAMS VIP $175,000Active1 beds 1 baths720 sq. ft.
2451 N Rainbow Boulevard #2063, Las Vegas, NV 89108
MLS# 2759011Listed by: KELLER WILLIAMS REALTY LAS VEG $182,500Active2 beds 1 baths844 sq. ft.
5921 Smoke Ranch Road #C, Las Vegas, NV 89108
MLS# 2758886Listed by: MILLENNIUM REALTY $285,500Active3 beds 2 baths1,220 sq. ft.
6412 Big Pine Way, Las Vegas, NV 89108
MLS# 2758518Listed by: WARDLEY REAL ESTATE $219,500Active2 beds 2 baths969 sq. ft.
2051 Hussium Hills Street #104, Las Vegas, NV 89108
MLS# 2758157Listed by: SIGNATURE REAL ESTATE GROUP $290,000Active3 beds 2 baths1,289 sq. ft.
3605 Galatea Street #201, Las Vegas, NV 89108
MLS# 2756686Listed by: REDFIN $450,000Active4 beds 3 baths1,753 sq. ft.
6508 Moon Roses Court, Las Vegas, NV 89108
MLS# 2758069Listed by: COMPASS REALTY & MANAGEMENT $225,000Active2 beds 2 baths1,075 sq. ft.
1401 N Michael Way #240, Las Vegas, NV 89108
MLS# 2757179Listed by: SIGNATURE REAL ESTATE GROUP $245,000Active3 beds 2 baths1,237 sq. ft.
2451 N Rainbow Boulevard #1127, Las Vegas, NV 89108
MLS# 2757850Listed by: KELLER WILLIAMS MARKETPLACE $389,888Active3 beds 2 baths1,334 sq. ft.
1208 Saylor Way, Las Vegas, NV 89108
MLS# 2757599Listed by: GALINDO GROUP REAL ESTATE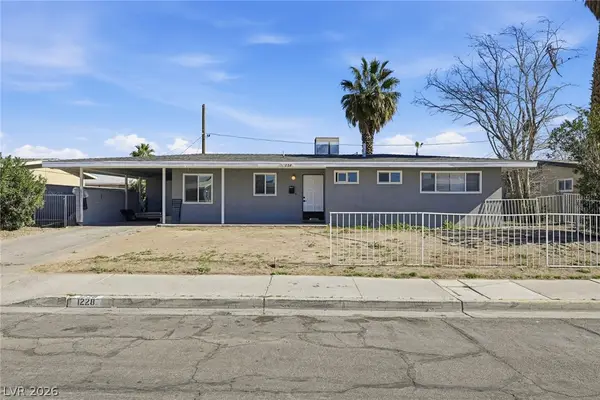 $380,000Pending4 beds 2 baths1,239 sq. ft.
1228 Purple Sage Avenue, Las Vegas, NV 89108
MLS# 2757733Listed by: INNOVATIVE REAL ESTATE STRATEG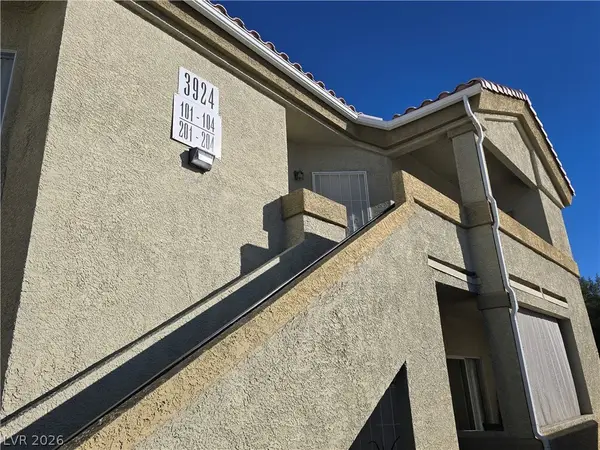 $249,900Active2 beds 2 baths1,369 sq. ft.
3924 Quiet Pine Street #202, Las Vegas, NV 89108
MLS# 2757471Listed by: CENTURY 21 1ST PRIORITY REALTY $759,999Active3 beds 3 baths2,248 sq. ft.
1963 Catalpa Trail, Las Vegas, NV 89108
MLS# 2757129Listed by: REAL BROKER LLC $180,000Active2 beds 1 baths844 sq. ft.
5713 Smoke Ranch Road #D, Las Vegas, NV 89108
MLS# 2757230Listed by: REALTY ONE GROUP, INC $149,000Active1 beds 1 baths695 sq. ft.
2801 N Rainbow Boulevard #106, Las Vegas, NV 89108
MLS# 2756982Listed by: ORANGE REALTY GROUP LLC $202,000Active2 beds 2 baths976 sq. ft.
1600 N Torrey Pines Drive #202, Las Vegas, NV 89108
MLS# 2755860Listed by: REALTY ONE GROUP, INC $332,000Active3 beds 2 baths1,069 sq. ft.
6625 Lund Drive, Las Vegas, NV 89108
MLS# 2755465Listed by: BHHS NEVADA PROPERTIES $217,000Active2 beds 2 baths1,075 sq. ft.
1401 N Michael Way #220, Las Vegas, NV 89108
MLS# 2756885Listed by: LIFE REALTY DISTRICT $390,000Pending3 beds 2 baths1,560 sq. ft.
1405 Winwood Street, Las Vegas, NV 89108
MLS# 2756598Listed by: ROI ASSETS REALTY $189,900Active2 beds 2 baths900 sq. ft.
2116 Bavington Drive #C, Las Vegas, NV 89108
MLS# 2755179Listed by: EPIQUE REALTY $625,000Pending3 beds 2 baths1,543 sq. ft.
6304 Jennifer Court, Las Vegas, NV 89108
MLS# 2755965Listed by: RE/MAX ADVANTAGE $204,990Pending2 beds 2 baths728 sq. ft.
2140 Petersham Court #A, Las Vegas, NV 89108
MLS# 2756081Listed by: EXP REALTY $480,000Active3 beds 3 baths1,600 sq. ft.
2433 Cycad Tree Street, Las Vegas, NV 89108
MLS# 2756137Listed by: CENTURY 21 AMERICANA $430,000Active4 beds 3 baths1,591 sq. ft.
4981 Jean Avenue, Las Vegas, NV 89108
MLS# 2756460Listed by: BHHS NEVADA PROPERTIES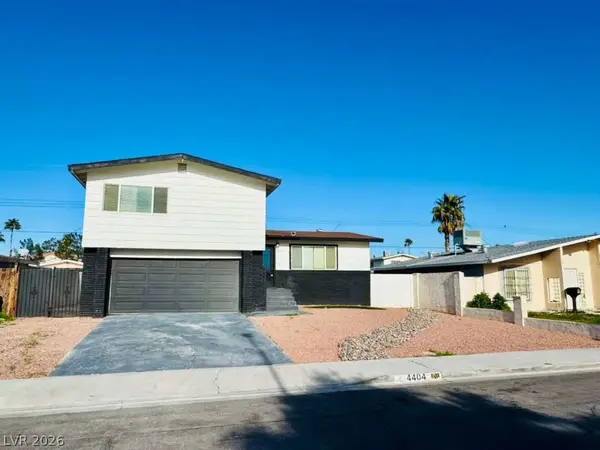 $489,000Active4 beds 4 baths2,006 sq. ft.
4404 Edward Avenue, Las Vegas, NV 89108
MLS# 2755047Listed by: DH CAPITAL REALTY- $159,000Active1 beds 1 baths720 sq. ft.
2451 N Rainbow Boulevard #1019, Las Vegas, NV 89108
MLS# 2755901Listed by: HUNTINGTON & ELLIS, A REAL EST 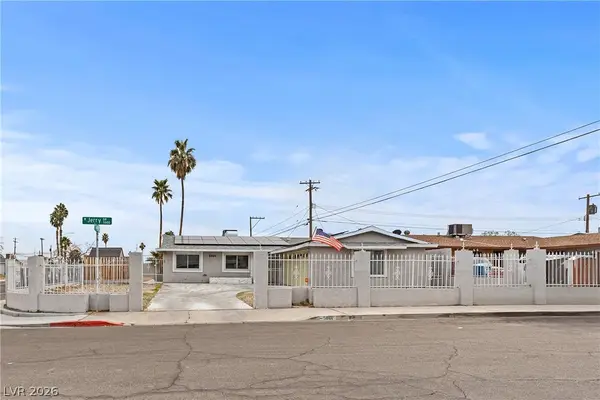 $399,900Active4 beds 2 baths1,334 sq. ft.
5801 Jerry Drive, Las Vegas, NV 89108
MLS# 2750832Listed by: VICE REALTY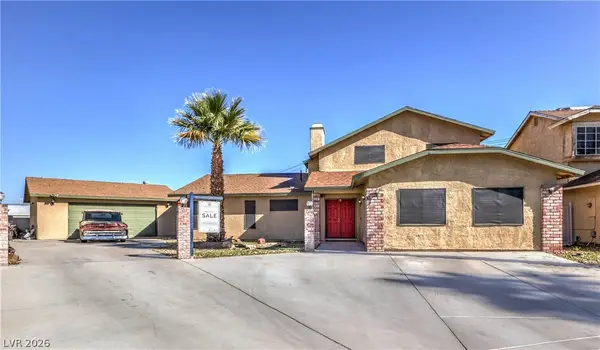 $500,000Pending4 beds 4 baths2,721 sq. ft.
1833 Palo Alto Circle, Las Vegas, NV 89108
MLS# 2752979Listed by: HUNTINGTON & ELLIS, A REAL EST $314,000Active3 beds 3 baths1,408 sq. ft.
5012 Sublight Avenue, Las Vegas, NV 89108
MLS# 2754638Listed by: ELITE REALTY $260,000Active2 beds 2 baths1,049 sq. ft.
5449 Bugle Way #101, Las Vegas, NV 89108
MLS# 2754625Listed by: KELLER WILLIAMS MARKETPLACE $699,900Active5 beds 5 baths3,984 sq. ft.
1963 Sycamore Trail, Las Vegas, NV 89108
MLS# 2755160Listed by: FIRST MUTUAL REALTY GROUP $225,000Active3 beds 2 baths1,212 sq. ft.
6500 W Lake Mead Boulevard #123, Las Vegas, NV 89108
MLS# 2755024Listed by: HUNTINGTON & ELLIS, A REAL EST $380,000Active3 beds 2 baths1,288 sq. ft.
6209 Long Valley Drive, Las Vegas, NV 89108
MLS# 2754979Listed by: DESERT VISION REALTY $399,000Active4 beds 3 baths1,418 sq. ft.
3304 San Juan Drive, Las Vegas, NV 89108
MLS# 2736358Listed by: LAS VEGAS SOTHEBY'S INT'L $330,000Active2 beds 2 baths1,125 sq. ft.
6649 Fredonia Drive, Las Vegas, NV 89108
MLS# 2751548Listed by: WIN WIN REAL ESTATE $400,000Pending3 beds 2 baths1,180 sq. ft.
1824 Yellow Rose Street, Las Vegas, NV 89108
MLS# 2753807Listed by: GALINDO GROUP REAL ESTATE $600,000Active4 beds 3 baths2,027 sq. ft.
5905 Paseo Montana, Las Vegas, NV 89108
MLS# 2754084Listed by: LPT REALTY, LLC $410,000Active3 beds 2 baths1,221 sq. ft.
6669 Pleasant Plains Way, Las Vegas, NV 89108
MLS# 2753768Listed by: GALINDO GROUP REAL ESTATE $333,800Active3 beds 3 baths1,534 sq. ft.
2744 Stars End Street, Las Vegas, NV 89108
MLS# 2753658Listed by: THE AGENCY LAS VEGAS $385,000Active3 beds 3 baths1,292 sq. ft.
1904 Bookbinder Drive, Las Vegas, NV 89108
MLS# 2752357Listed by: OMNI REALTY & INVESTMENTS $615,000Active-- beds -- baths3,196 sq. ft.
5104 Pebble Beach Boulevard, Las Vegas, NV 89108
MLS# 2753473Listed by: INTERNATIONAL REALTY LV $215,900Active2 beds 2 baths912 sq. ft.
1616 Burningwood Lane #101, Las Vegas, NV 89108
MLS# 2752405Listed by: REAL BROKER LLC $340,000Active2 beds 2 baths1,175 sq. ft.
1900 Caviar Drive, Las Vegas, NV 89108
MLS# 2753232Listed by: FATHOM REALTY $311,000Pending2 beds 2 baths1,098 sq. ft.
2320 El Molino Circle, Las Vegas, NV 89108
MLS# 2751650Listed by: COLDWELL BANKER PREMIER $165,000Active1 beds 1 baths720 sq. ft.
2451 N Rainbow Boulevard #2035, Las Vegas, NV 89108
MLS# 2752575Listed by: REALTY OF AMERICA LLC $169,999Pending1 beds 1 baths720 sq. ft.
2451 N Rainbow Boulevard #1058, Las Vegas, NV 89108
MLS# 2752351Listed by: JMG REAL ESTATE $425,000Active3 beds 2 baths1,175 sq. ft.
6013 Santa Catalina Avenue, Las Vegas, NV 89108
MLS# 2751852Listed by: KELLER WILLIAMS MARKETPLACE $169,999Active1 beds 1 baths649 sq. ft.
2011 Sue Court #203, Las Vegas, NV 89108
MLS# 2751958Listed by: AWARD REALTY $750,000Active0.53 Acres
2200 N Decatur, Las Vegas, NV 89108
MLS# 2751907Listed by: UNITED REALTY GROUP $430,000Active3 beds 3 baths1,887 sq. ft.
6672 Golden Pond Circle, Las Vegas, NV 89108
MLS# 2751305Listed by: LIMESTONE INVESTMENTS LLC $139,900Active2 beds 2 baths912 sq. ft.
3720 Snorkel Circle #D, Las Vegas, NV 89108
MLS# 2751101Listed by: INNOVATIVE REAL ESTATE STRATEG $199,000Active2 beds 2 baths1,081 sq. ft.
4408 W Lake Mead Boulevard #201, Las Vegas, NV 89108
MLS# 2758852Listed by: LEGACY REAL ESTATE GROUP $199,000Active2 beds 2 baths1,128 sq. ft.
2451 N Rainbow Boulevard #2155, Las Vegas, NV 89108
MLS# 2749895Listed by: EXP REALTY $189,000Active2 beds 2 baths1,081 sq. ft.
4428 W Lake Mead Boulevard #102, Las Vegas, NV 89108
MLS# 2749901Listed by: REALTY ONE GROUP, INC $749,999Active4 beds 3 baths2,445 sq. ft.
5854 Alfred Drive, Las Vegas, NV 89108
MLS# 2750220Listed by: MOTION PROPERTIES $484,999Active4 beds 3 baths1,605 sq. ft.
1832 Goose Creek Place, Las Vegas, NV 89108
MLS# 2749782Listed by: SIMPLY VEGAS $689,990Active-- beds -- baths3,720 sq. ft.
1717 Cordoba Lane, Las Vegas, NV 89108
MLS# 2750256Listed by: UNITED REALTY GROUP $420,000Active3 beds 2 baths1,395 sq. ft.
3109 Autumn Leaf Court, Las Vegas, NV 89108
MLS# 2750007Listed by: SIGNATURE REAL ESTATE GROUP $525,000Active3 beds 3 baths1,702 sq. ft.
2217 Avery Drive, Las Vegas, NV 89108
MLS# 2749944Listed by: REAL BROKER LLC $728,076Active4 beds 3 baths2,557 sq. ft.
9228 Simon Street, Las Vegas, NV 89166
MLS# 2749499Listed by: NEW DOOR RESIDENTIAL $408,000Pending4 beds 3 baths1,329 sq. ft.
4909 Cannon Boulevard, Las Vegas, NV 89108
MLS# 2749405Listed by: DH CAPITAL REALTY $225,000Active3 beds 2 baths1,103 sq. ft.
2801 N Rainbow Boulevard #178, Las Vegas, NV 89108
MLS# 2748943Listed by: REALTY ONE GROUP, INC $185,000Active2 beds 2 baths945 sq. ft.
1812 N Decatur Boulevard #202, Las Vegas, NV 89108
MLS# 2733612Listed by: REALTY EXECUTIVES SOUTHERN $269,900Active2 beds 2 baths1,051 sq. ft.
2228 Silver Pine Drive, Las Vegas, NV 89108
MLS# 2748143Listed by: CENTURY 21 CONSOLIDATED $180,000Active2 beds 2 baths1,128 sq. ft.
2451 N Rainbow Boulevard #2160, Las Vegas, NV 89108
MLS# 2747821Listed by: AXIS REAL ESTATE LLC $394,999Active3 beds 2 baths1,248 sq. ft.
2132 Jeanne Drive, Las Vegas, NV 89108
MLS# 2747549Listed by: AXIS REAL ESTATE LLC $325,000Active3 beds 2 baths1,182 sq. ft.
6405 Blue Blossom Avenue, Las Vegas, NV 89108
MLS# 2747406Listed by: KELLER WILLIAMS MARKETPLACE $360,000Active3 beds 2 baths1,460 sq. ft.
6231 Santa Maria Avenue, Las Vegas, NV 89108
MLS# 2747328Listed by: KELLER WILLIAMS MARKETPLACE $189,000Active2 beds 2 baths1,128 sq. ft.
2451 N Rainbow Boulevard #2065, Las Vegas, NV 89108
MLS# 2747208Listed by: ROOFTOP REALTY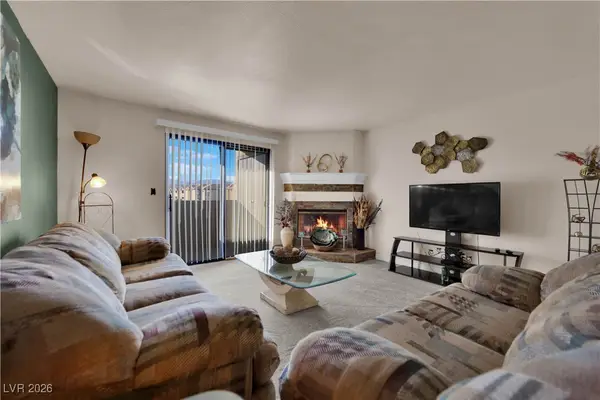 $168,999Active2 beds 2 baths1,128 sq. ft.
2451 N Rainbow Boulevard #2140, Las Vegas, NV 89108
MLS# 2745733Listed by: GALINDO GROUP REAL ESTATE $190,000Pending2 beds 2 baths969 sq. ft.
2141 Hussium Hills Street #108, Las Vegas, NV 89108
MLS# 2746319Listed by: SIGNATURE REAL ESTATE GROUP $385,000Active3 beds 3 baths1,857 sq. ft.
5066 El Castano Avenue, Las Vegas, NV 89108
MLS# 2747046Listed by: KELLER WILLIAMS MARKETPLACE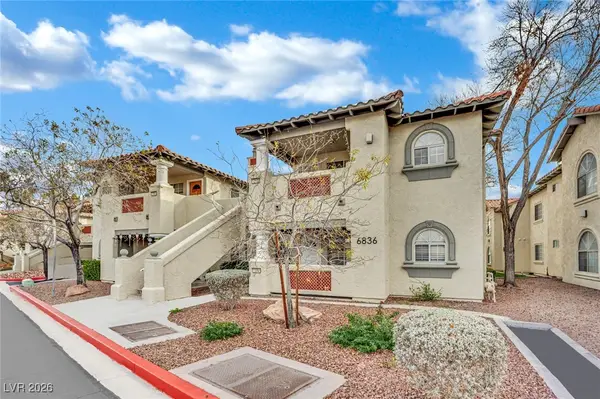 $255,000Active2 beds 2 baths1,137 sq. ft.
6836 Elm Creek Drive #201, Las Vegas, NV 89108
MLS# 2746820Listed by: BOTTEGA REAL ESTATE $900,000Active-- beds -- baths3,834 sq. ft.
2321 N Jones Boulevard, Las Vegas, NV 89108
MLS# 2746485Listed by: PRESIDIO REAL ESTATE SERVICES $900,000Active-- beds -- baths3,834 sq. ft.
2317 N Jones Boulevard, Las Vegas, NV 89108
MLS# 2746494Listed by: PRESIDIO REAL ESTATE SERVICES $429,998Active4 beds 2 baths1,636 sq. ft.
5820 Mary Way, Las Vegas, NV 89108
MLS# 2744194Listed by: HUNTINGTON & ELLIS, A REAL EST $340,000Active2 beds 2 baths1,219 sq. ft.
6425 Eagle Point Road, Las Vegas, NV 89108
MLS# 2745585Listed by: HUNTINGTON & ELLIS, A REAL EST $315,000Pending3 beds 2 baths1,289 sq. ft.
3605 Spanish Butterfly Street #101, Las Vegas, NV 89108
MLS# 2745439Listed by: COSTELLO REALTY & MGMT $389,999Pending4 beds 2 baths1,012 sq. ft.
6216 Molino Street, Las Vegas, NV 89108
MLS# 2745417Listed by: CITY NATIONAL PROPERTIES $800,000Active5 beds 4 baths2,769 sq. ft.
3813 Maverick Street, Las Vegas, NV 89108
MLS# 2744139Listed by: REALTY ONE GROUP, INC $260,000Active3 beds 2 baths1,156 sq. ft.
3428 Winterhaven Street #101, Las Vegas, NV 89108
MLS# 2744336Listed by: HUNTINGTON & ELLIS, A REAL EST $615,000Active-- beds -- baths3,196 sq. ft.
5100 Pebble Beach Boulevard, Las Vegas, NV 89108
MLS# 2744174Listed by: INTERNATIONAL REALTY LV $330,000Active2 beds 2 baths1,033 sq. ft.
6382 Canyon Dawn Avenue, Las Vegas, NV 89108
MLS# 2738396Listed by: BHHS NEVADA PROPERTIES $540,000Active5 beds 4 baths2,481 sq. ft.
1624 Crisp Pear Court, Las Vegas, NV 89108
MLS# 2743566Listed by: TOP TIER REALTY $229,999Active2 beds 1 baths844 sq. ft.
5705 Smoke Ranch Road #B, Las Vegas, NV 89108
MLS# 2743416Listed by: UNITED REALTY GROUP $550,000Active3 beds 4 baths2,587 sq. ft.
1312 Oak Tree Lane, Las Vegas, NV 89108
MLS# 2742280Listed by: PLATINUM REAL ESTATE PROF $310,000Active3 beds 2 baths1,182 sq. ft.
6457 Blue Blossom Avenue, Las Vegas, NV 89108
MLS# 2740788Listed by: KELLER WILLIAMS MARKETPLACE $425,000Active3 beds 3 baths1,643 sq. ft.
6633 Wheelbarrow Peak Drive, Las Vegas, NV 89108
MLS# 2732113Listed by: BHHS NEVADA PROPERTIES $475,000Active3 beds 2 baths1,605 sq. ft.
1700 Breezewood Drive, Las Vegas, NV 89108
MLS# 2741917Listed by: REALTY ONE GROUP, INC $154,000Active1 beds 1 baths695 sq. ft.
2801 N Rainbow Boulevard #207, Las Vegas, NV 89108
MLS# 2741644Listed by: COLDWELL BANKER PREMIER $240,000Pending2 beds 2 baths1,074 sq. ft.
2132 Bavington Drive #B, Las Vegas, NV 89108
MLS# 2741129Listed by: BHGRE UNIVERSAL $195,000Active2 beds 2 baths1,032 sq. ft.
2373 Cardiff Lane #B, Las Vegas, NV 89108
MLS# 2741161Listed by: ROCK REALTY GROUP $190,000Active2 beds 2 baths1,032 sq. ft.
2341 Canfield Drive #B, Las Vegas, NV 89108
MLS# 2740515Listed by: UNITED REALTY GROUP $290,000Active3 beds 3 baths1,534 sq. ft.
5041 Sublight Avenue, Las Vegas, NV 89108
MLS# 2740241Listed by: REALTY ONE GROUP, INC $177,700Active2 beds 1 baths844 sq. ft.
5701 Smoke Ranch Road #D, Las Vegas, NV 89108
MLS# 2738890Listed by: REALTY OF AMERICA LLC $189,000Active2 beds 1 baths844 sq. ft.
5817 Smoke Ranch Road #B, Las Vegas, NV 89108
MLS# 2740002Listed by: GALINDO GROUP REAL ESTATE $600,000Active4 beds 3 baths2,137 sq. ft.
3816 Old Orchard Court, Las Vegas, NV 89108
MLS# 2736398Listed by: LAS VEGAS SOTHEBY'S INT'L $399,000Active3 beds 3 baths1,836 sq. ft.
2616 Island Brook Drive, Las Vegas, NV 89108
MLS# 2738594Listed by: SIMPLY VEGAS $285,000Active2 beds 2 baths1,041 sq. ft.
5401 Bugle Way #103, Las Vegas, NV 89108
MLS# 2736732Listed by: AWARD REALTY $378,000Active3 beds 3 baths1,297 sq. ft.
6656 Joe Michael Way, Las Vegas, NV 89108
MLS# 2734687Listed by: LOVE LAS VEGAS REALTY $260,000Active2 beds 2 baths1,074 sq. ft.
2128 Bavington Drive #A, Las Vegas, NV 89108
MLS# 2735506Listed by: PARADIGM REALTY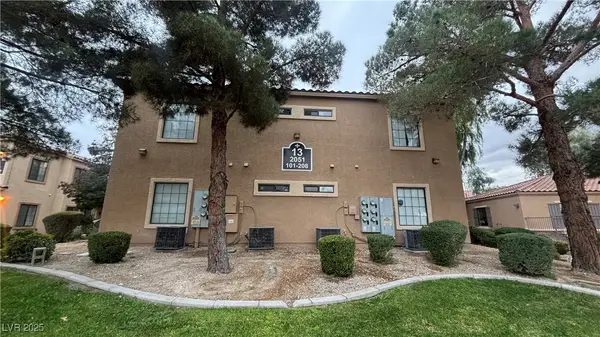 $191,888Active2 beds 2 baths935 sq. ft.
2051 Hussium Hills Street #101, Las Vegas, NV 89108
MLS# 2735923Listed by: LIGHTHOUSE HOMES AND PROPERTY $255,000Active2 beds 2 baths1,074 sq. ft.
2132 Bavington Drive #D, Las Vegas, NV 89108
MLS# 2734694Listed by: EASY STREET REALTY LAS VEGAS $235,000Active2 beds 2 baths728 sq. ft.
2141 Twickenham Place #D, Las Vegas, NV 89108
MLS# 2734276Listed by: SIGNATURE REAL ESTATE GROUP $325,000Pending3 beds 2 baths1,238 sq. ft.
2709 Camphor Tree Street, Las Vegas, NV 89108
MLS# 2732277Listed by: HASTINGS BROKERAGE LTD $1,249,888Active6 beds 6 baths4,260 sq. ft.
2334 N Michael Way, Las Vegas, NV 89108
MLS# 2733655Listed by: SIMPLY VEGAS- Open Wed, 1am to 11:59pm
 $210,000Active2 beds 2 baths1,128 sq. ft.
2451 N Rainbow Boulevard #1129, Las Vegas, NV 89108
MLS# 2733495Listed by: CENTURY 21 CONSOLIDATED  $429,999Active4 beds 2 baths1,233 sq. ft.
5921 San Fernando Drive, Las Vegas, NV 89108
MLS# 2733034Listed by: REALTY ONE GROUP, INC $157,500Active1 beds 1 baths720 sq. ft.
2451 N Rainbow Boulevard #1020, Las Vegas, NV 89108
MLS# 2729919Listed by: WEICHERT REALTORS-MILLENNIUM $390,000Active4 beds 3 baths1,612 sq. ft.
6612 Belcamp Circle, Las Vegas, NV 89108
MLS# 2732123Listed by: REALTY ONE GROUP, INC $211,000Active2 beds 2 baths1,128 sq. ft.
2451 N Rainbow Boulevard #2026, Las Vegas, NV 89108
MLS# 2730592Listed by: EXP REALTY $449,500Active4 beds 3 baths2,037 sq. ft.
1325 Maplegrove Circle, Las Vegas, NV 89108
MLS# 2731178Listed by: EXECUTIVE REALTY SERVICES $262,999Active2 beds 2 baths1,056 sq. ft.
3609 Pintadas Street #202, Las Vegas, NV 89108
MLS# 2726855Listed by: SIGNATURE REAL ESTATE GROUP $229,995Active2 beds 2 baths900 sq. ft.
2140 Willowbury Drive #A, Las Vegas, NV 89108
MLS# 2730700Listed by: PULSE REALTY GROUP LLC $210,000Pending3 beds 2 baths1,220 sq. ft.
5140 Santo Avenue, Las Vegas, NV 89108
MLS# 2730603Listed by: MIKE DONLON R.E & INVESTMENTS $350,000Active0.42 Acres
3816 Vegas Drive, Las Vegas, NV 89108
MLS# 2729414Listed by: BHHS NEVADA PROPERTIES $459,999Active4 beds 3 baths2,028 sq. ft.
6673 Silver Penny Avenue, Las Vegas, NV 89108
MLS# 2727236Listed by: LPT REALTY, LLC $179,000Active2 beds 2 baths997 sq. ft.
2700 N Rainbow Boulevard #1105, Las Vegas, NV 89108
MLS# 2728229Listed by: REALTY ONE GROUP, INC $292,500Active2 beds 3 baths1,091 sq. ft.
4052 Cape Sand Drive, Las Vegas, NV 89108
MLS# 2726886Listed by: SILVER STATE REALTY & INVES $175,000Active2 beds 2 baths945 sq. ft.
1844 N Decatur Boulevard #103, Las Vegas, NV 89108
MLS# 2727596Listed by: EASY STREET REALTY LAS VEGAS $359,900Active3 beds 3 baths1,336 sq. ft.
2528 Cherrywood Street, Las Vegas, NV 89108
MLS# 2726546Listed by: EASY STREET REALTY LAS VEGAS $324,900Pending3 beds 2 baths1,838 sq. ft.
5712 Pinecone Place, Las Vegas, NV 89108
MLS# 2724597Listed by: HASTINGS BROKERAGE LTD $335,000Active3 beds 1 baths1,242 sq. ft.
1112 Hazard Avenue, Las Vegas, NV 89108
MLS# 2725098Listed by: BLACK & CHERRY REAL ESTATE $225,000Active3 beds 2 baths1,180 sq. ft.
2801 N Rainbow Boulevard #252, Las Vegas, NV 89108
MLS# 2724042Listed by: JMG REAL ESTATE $4,000,000Active2.58 Acres
6802 W Craig Road, Las Vegas, NV 89108
MLS# 2722133Listed by: LAS VEGAS INVESTMENTS & REALTY $798,000Active3 beds 3 baths2,786 sq. ft.
5710 Madre Mesa Drive, Las Vegas, NV 89108
MLS# 2720246Listed by: REAL BROKER LLC $225,000Active2 beds 2 baths728 sq. ft.
2132 Chertsey Drive #D, Las Vegas, NV 89108
MLS# 2721347Listed by: SIGNATURE REAL ESTATE GROUP $219,000Active2 beds 2 baths1,259 sq. ft.
1401 N Michael Way #118, Las Vegas, NV 89108
MLS# 2719123Listed by: EXP REALTY $219,999Active2 beds 2 baths1,137 sq. ft.
6800 Elm Creek Drive #103, Las Vegas, NV 89108
MLS# 2719721Listed by: LPT REALTY, LLC $589,000Active-- beds -- baths3,634 sq. ft.
3217 Joann Way, Las Vegas, NV 89108
MLS# 2720486Listed by: NATIONAL REAL ESTATE $825,000Active4 beds 4 baths2,107 sq. ft.
4945 Stacey Avenue, Las Vegas, NV 89108
MLS# 2717974Listed by: ERA BROKERS CONSOLIDATED $769,000Active-- beds -- baths3,952 sq. ft.
6217 Yerba Lane, Las Vegas, NV 89108
MLS# 2718870Listed by: LANTANA $1,511,000Active3 beds 5 baths3,376 sq. ft.
4015 Heron Fairway Drive, Las Vegas, NV 89141
MLS# 2718997Listed by: BRADY LUXURY HOMES $335,000Pending3 beds 2 baths1,069 sq. ft.
6637 Lund Drive, Las Vegas, NV 89108
MLS# 2710668Listed by: SIGNATURE REAL ESTATE GROUP $450,000Pending5 beds 4 baths2,182 sq. ft.
1325 Pyramid Drive, Las Vegas, NV 89108
MLS# 2718746Listed by: MIRA BAI REALTY $639,900Active5 beds 3 baths2,727 sq. ft.
5807 Madre Mesa Drive, Las Vegas, NV 89108
MLS# 2717662Listed by: BLUEPRINT REAL ESTATE SERVICES $255,000Active2 beds 2 baths1,020 sq. ft.
2801 N Rainbow Boulevard #103, Las Vegas, NV 89108
MLS# 2763406Listed by: LIMESTONE INVESTMENTS LLC $285,000Active2 beds 2 baths1,049 sq. ft.
5401 Geneive Lane #101, Las Vegas, NV 89108
MLS# 2716386Listed by: EVOLVE REALTY $405,000Active3 beds 2 baths1,468 sq. ft.
6520 Lombard Drive, Las Vegas, NV 89108
MLS# 2716410Listed by: BHHS NEVADA PROPERTIES $395,000Active3 beds 2 baths1,213 sq. ft.
1508 Lilac Breeze Circle, Las Vegas, NV 89108
MLS# 2763296Listed by: HUNTINGTON & ELLIS, A REAL EST $827,500Active-- beds -- baths3,976 sq. ft.
2201 James Bilbray Drive, Las Vegas, NV 89108
MLS# 2713304Listed by: SIMPLY VEGAS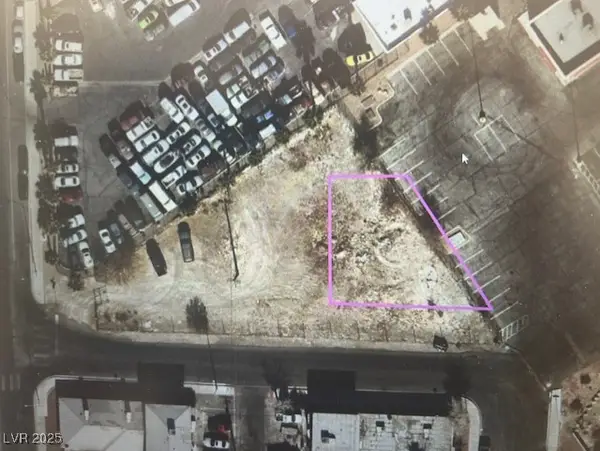 $280,000Active0.47 Acres
3300 N Michael Way, Las Vegas, NV 89108
MLS# 2713017Listed by: CENTURY 21 AMERICANA $550,000Active4 beds 2 baths2,139 sq. ft.
3757 N Torrey Pines Drive, Las Vegas, NV 89108
MLS# 2748621Listed by: VIRTUE REAL ESTATE GROUP $440,000Pending5 beds 3 baths1,642 sq. ft.
6205 Carmen Boulevard, Las Vegas, NV 89108
MLS# 2710118Listed by: UNITED REALTY GROUP $165,000Active1 beds 1 baths720 sq. ft.
2451 N Rainbow Boulevard #2048, Las Vegas, NV 89108
MLS# 2740593Listed by: FIRST MUTUAL REALTY GROUP $165,000Active1 beds 1 baths720 sq. ft.
2451 N Rainbow Boulevard #1047, Las Vegas, NV 89108
MLS# 2740630Listed by: FIRST MUTUAL REALTY GROUP $411,900Active4 beds 2 baths1,379 sq. ft.
5521 Auborn Avenue, Las Vegas, NV 89108
MLS# 2708352Listed by: PALACIOS REALTY $329,000Active3 beds 2 baths1,162 sq. ft.
2129 Havelina Street, Las Vegas, NV 89108
MLS# 2707540Listed by: FIRST UNITED MANAGEMENT GROUP $184,900Active2 beds 2 baths945 sq. ft.
1802 N Decatur Boulevard #203, Las Vegas, NV 89108
MLS# 2705294Listed by: RE/MAX LEGACY $350,000Active3 beds 2 baths1,306 sq. ft.
2031 San Simeon Street, Las Vegas, NV 89108
MLS# 2704830Listed by: DESERT VISION REALTY $310,000Active2 beds 2 baths1,066 sq. ft.
5424 Geneive Lane #105, Las Vegas, NV 89108
MLS# 2694267Listed by: KELLER WILLIAMS MARKETPLACE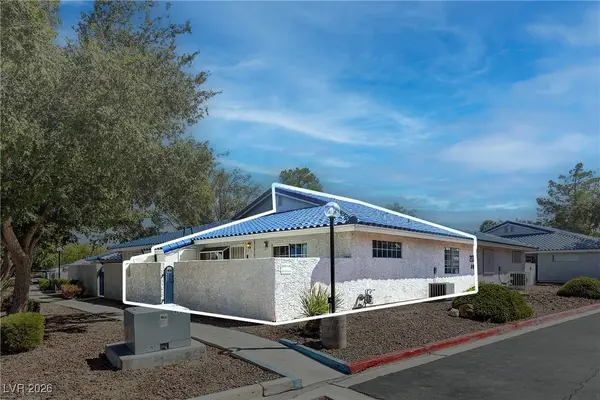 $244,999Active2 beds 2 baths900 sq. ft.
2136 Bavington Drive #A, Las Vegas, NV 89108
MLS# 2744695Listed by: RE/MAX CENTRAL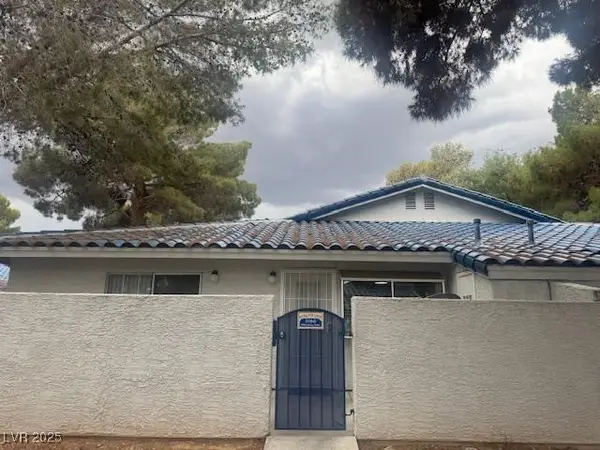 $244,900Active2 beds 2 baths900 sq. ft.
2108 Willowbury Drive #B, Las Vegas, NV 89108
MLS# 2689313Listed by: TRI-STAR REALTY LLC $215,000Pending2 beds 2 baths1,128 sq. ft.
2451 N Rainbow Boulevard #1066, Las Vegas, NV 89108
MLS# 2681827Listed by: REAL BROKER LLC $337,000Active3 beds 3 baths1,534 sq. ft.
5024 Starfinder Avenue, Las Vegas, NV 89108
MLS# 2756951Listed by: KELLER WILLIAMS VIP $375,000Active4 beds 2 baths1,302 sq. ft.
6215 Don Zarembo Avenue, Las Vegas, NV 89108
MLS# 2679657Listed by: STONEGATE REAL ESTATE SERVICES $539,900Active5 beds 3 baths2,466 sq. ft.
6631 Frosted Harvest Avenue, Las Vegas, NV 89108
MLS# 2732262Listed by: ROOTED REALTY GROUP $275,000Active2 beds 2 baths1,369 sq. ft.
3924 Quiet Pine Street #201, Las Vegas, NV 89108
MLS# 2676324Listed by: KELLER WILLIAMS REALTY LAS VEG $475,000Active4 beds 2 baths1,807 sq. ft.
6440 Marrow Road, Las Vegas, NV 89108
MLS# 2732107Listed by: BHHS NEVADA PROPERTIES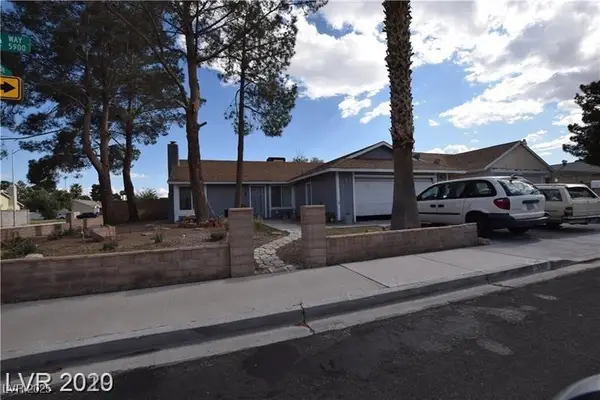 $429,000Active3 beds 2 baths1,208 sq. ft.
5901 Oceanside Way, Las Vegas, NV 89108
MLS# 2732100Listed by: BHHS NEVADA PROPERTIES $450,000Active0.54 Acres
4940 Vegas Drive, Las Vegas, NV 89108
MLS# 2672475Listed by: XYZ GROUP REAL ESTATE LLC $415,000Active3 beds 2 baths1,328 sq. ft.
6732 Accent Court, Las Vegas, NV 89108
MLS# 2732114Listed by: BHHS NEVADA PROPERTIES $439,000Active3 beds 2 baths1,437 sq. ft.
6632 Coastal Breeze Court, Las Vegas, NV 89108
MLS# 2668180Listed by: BHHS NEVADA PROPERTIES $799,900Active0.46 Acres
1859 N Decatur Boulevard, Las Vegas, NV 89108
MLS# 2632632Listed by: EXECUTIVE REALTY SERVICES $269,900Active2 beds 2 baths900 sq. ft.
2121 Chertsey Drive #D, Las Vegas, NV 89108
MLS# 2731987Listed by: REALTY ONE GROUP, INC $180,000Active2 beds 2 baths997 sq. ft.
2700 N Rainbow Boulevard #2097, Las Vegas, NV 89108
MLS# 2751974Listed by: DOLLY REALTY $275,000Active0.5 Acres
1655 Fairhaven Street, Las Vegas, NV 89108
MLS# 2619852Listed by: ERA BROKERS CONSOLIDATED $4,000,000Active5.28 Acres
3941 N Rancho Drive, Las Vegas, NV 89130
MLS# 2614704Listed by: ERA BROKERS CONSOLIDATED $399,000Active3 beds 3 baths1,700 sq. ft.
4200 Coran Lane, Las Vegas, NV 89108
MLS# 2756862Listed by: BHGRE UNIVERSAL- $760,000Active2 Acres
Jone, Las Vegas, NV 89108
MLS# 2603085Listed by: SANDRA L FINK & ASSOCITES INC  $624,900Active5 beds 3 baths2,479 sq. ft.
1630 Harvest Pecan Court, Las Vegas, NV 89108
MLS# 2706916Listed by: REALTY ONE GROUP, INC $364,900Active3 beds 2 baths1,574 sq. ft.
4609 W Lake Mead Boulevard, Las Vegas, NV 89108
MLS# 2747447Listed by: LPT REALTY, LLC $249,900Active2 beds 2 baths890 sq. ft.
1608 N Torrey Pines Drive #103, Las Vegas, NV 89108
MLS# 2747072Listed by: LINDA BOTHOF $469,900Active3 beds 3 baths1,601 sq. ft.
2764 Trotwood Lane, Las Vegas, NV 89108
MLS# 2671850Listed by: REALTY ONE GROUP, INC $399,900Active2 beds 2 baths1,098 sq. ft.
6227 Don Gaspar Avenue, Las Vegas, NV 89108
MLS# 2671831Listed by: REALTY ONE GROUP, INC $454,900Active4 beds 3 baths1,974 sq. ft.
6561 Avon Court, Las Vegas, NV 89108
MLS# 2676457Listed by: REALTY ONE GROUP, INC $679,900Active4 beds 4 baths3,045 sq. ft.
1710 Shadow Mountain Place, Las Vegas, NV 89108
MLS# 2707745Listed by: RAINTREE REAL ESTATE $499,900Active3 beds 2 baths2,270 sq. ft.
5128 Forrest Hills Lane, Las Vegas, NV 89108
MLS# 2660294Listed by: REALTY ONE GROUP, INC $399,900Active2 beds 2 baths1,098 sq. ft.
2021 San Simeon Street, Las Vegas, NV 89108
MLS# 2755297Listed by: LOVE LAS VEGAS REALTY $399,900Active2 beds 2 baths1,132 sq. ft.
3805 Twig Lane, Las Vegas, NV 89108
MLS# 2715019Listed by: REALTY ONE GROUP, INC $529,900Active4 beds 3 baths1,726 sq. ft.
6444 Deadwood Road, Las Vegas, NV 89108
MLS# 2715049Listed by: REALTY ONE GROUP, INC $659,900Active5 beds 3 baths2,737 sq. ft.
4228 Gaye Lane, Las Vegas, NV 89108
MLS# 2671849Listed by: REALTY ONE GROUP, INC $429,900Active3 beds 2 baths1,214 sq. ft.
3948 Applecrest Street, Las Vegas, NV 89108
MLS# 2676454Listed by: REALTY ONE GROUP, INC $269,900Active3 beds 2 baths986 sq. ft.
1336 N Jones Boulevard, Las Vegas, NV 89108
MLS# 2747481Listed by: LINDA BOTHOF $1,850,000Active1.95 Acres
Cheyenne, Las Vegas, NV 89108
MLS# 2477708Listed by: LAS VEGAS INVESTMENTS & REALTY $419,900Active4 beds 2 baths1,241 sq. ft.
1617 Joshua Tree Court, Las Vegas, NV 89108
MLS# 2669724Listed by: INNOVATIVE REAL ESTATE STRATEG $429,900Active2 beds 2 baths1,267 sq. ft.
6645 Telegraph Road, Las Vegas, NV 89108
MLS# 2731995Listed by: REALTY ONE GROUP, INC $449,000Active4 beds 3 baths1,753 sq. ft.
6532 Moon Roses Court, Las Vegas, NV 89108
MLS# 2669309Listed by: BHHS NEVADA PROPERTIES $411,000Active2 beds 2 baths1,236 sq. ft.
6632 Light Breeze Drive, Las Vegas, NV 89108
MLS# 2721930Listed by: BHHS NEVADA PROPERTIES
Local realty services provided by:CENTURY 21 1st Priority Realty
Popular searches near 89108
Popular neighborhoods near 89108
- Angel Park Lindell, Las Vegas homes for sale
- Central Las Vegas, Las Vegas homes for sale
- Charleston Heights, Las Vegas homes for sale
- Cimarron Gowan, Las Vegas homes for sale
- Desert Shores, Las Vegas homes for sale
- Hyde Park, Las Vegas homes for sale
- Las Vegas Technology Center, Las Vegas homes for sale
- Los Prados, Las Vegas homes for sale
- Meadows, Las Vegas homes for sale
- Michael Way, Las Vegas homes for sale
- Mira Vista, Las Vegas homes for sale
- North Cheyenne, Las Vegas homes for sale
- Painted Desert, Las Vegas homes for sale
- Pioneer Park, Las Vegas homes for sale
- South Shores, Las Vegas homes for sale
- Sunhampton, Las Vegas homes for sale
- The Hills, Las Vegas homes for sale
- The Pueblo, Las Vegas homes for sale
- Twin Lakes, Las Vegas homes for sale
- West Las Vegas, Las Vegas homes for sale
Counties near Las Vegas, 89108
Protect your home and budget from life's surprises with an Assurant Home Warranty, backed by a partner that supports you through every step of homeownership. Explore Plans.
©2026 Century 21 Real Estate LLC. All rights reserved. CENTURY 21®, the CENTURY 21 Logo and C21® are service marks owned by Century 21 Real Estate LLC. Century 21 Real Estate LLC fully supports the principles of the Fair Housing Act and the Equal Opportunity Act. Each office is independently owned and operated. Listing information is deemed reliable but not guaranteed accurate.