- Albright, Buffalo homes for sale
- Delaware Park, Buffalo homes for sale
- Emerson, Buffalo homes for sale
- Genesee Moselle, Buffalo homes for sale
- Grider, Buffalo homes for sale
- Hamlin Park, Buffalo homes for sale
- Kenfield, Buffalo homes for sale
- Kenilworth, Buffalo homes for sale
- Kensington, Buffalo homes for sale
- Kingsley, Buffalo homes for sale
- Leroy, Buffalo homes for sale
- Lincoln Park, Buffalo homes for sale
- Martin Luther King Park, Buffalo homes for sale
- North Delaware, Buffalo homes for sale
- North Park, Buffalo homes for sale
- Park Meadow, Buffalo homes for sale
- Schiller Park, Buffalo homes for sale
- Starin Central, Buffalo homes for sale
- University, Buffalo homes for sale
- Wilton Argonne, Buffalo homes for sale
LaSalle, Buffalo, NY - homes for sale
36 of 36 results displayed
- New
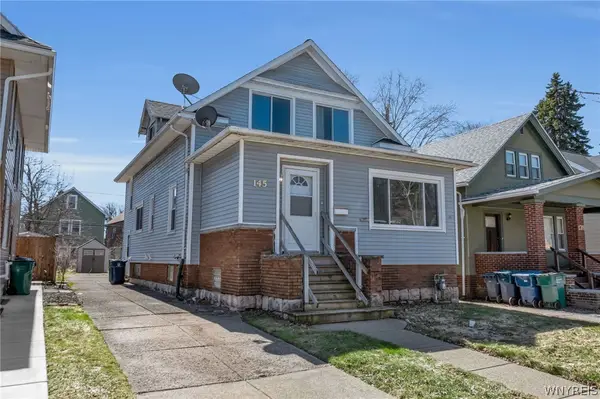 $199,900Active4 beds 2 baths1,771 sq. ft.
145 Highgate Avenue, Buffalo, NY 14214
MLS# B1670037Listed by: HUNT REAL ESTATE CORPORATION - New
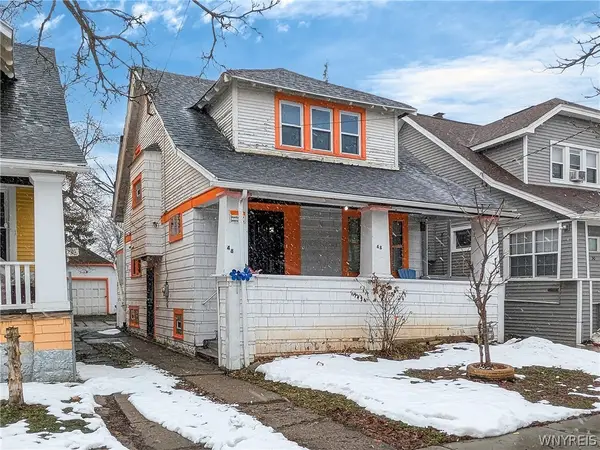 $149,900Active3 beds 1 baths1,160 sq. ft.
48 Elmer Avenue, Buffalo, NY 14215
MLS# B1669860Listed by: KELLER WILLIAMS REALTY WNY - New
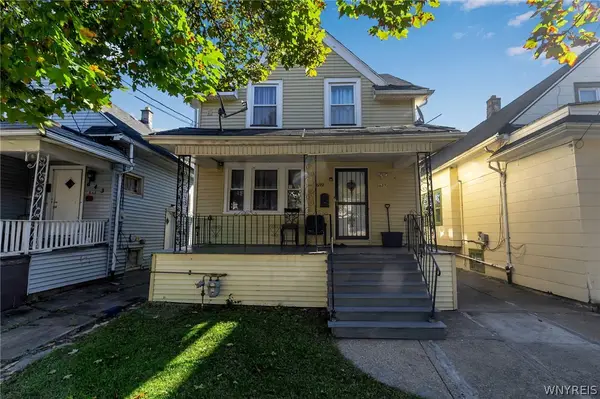
 $209,900Active4 beds 2 baths1,617 sq. ft.
243 Berkshire Avenue, Buffalo, NY 14215
MLS# B1669864Listed by: HUNT REAL ESTATE CORPORATION - New
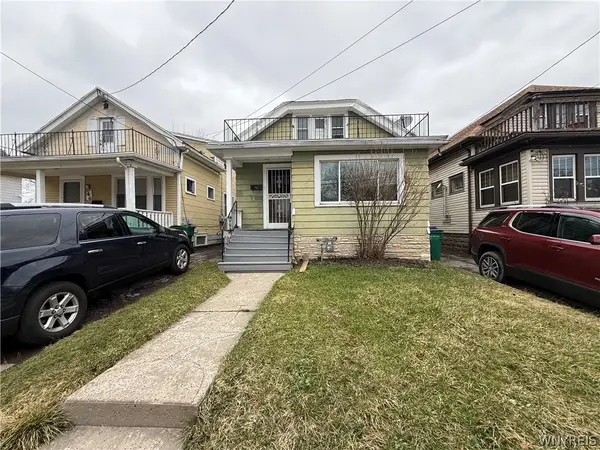
 $120,000Active3 beds 1 baths1,074 sq. ft.
639 Norfolk Avenue, Buffalo, NY 14215
MLS# B1669229Listed by: ICONIC REAL ESTATE - New
 $169,900Active4 beds 2 baths1,392 sq. ft.
50 Midway Avenue, Buffalo, NY 14215
MLS# B1666597Listed by: WNY METRO ROBERTS REALTY - New
 $169,900Active4 beds 2 baths1,760 sq. ft.
30 Poultney Avenue, Buffalo, NY 14215
MLS# B1669498Listed by: ARROWHEAD PROPERTY MANAGEMENT, LLC - New
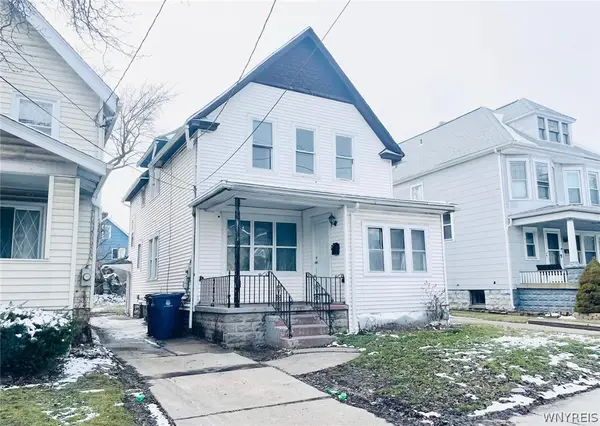
 $180,000Active4 beds 2 baths1,407 sq. ft.
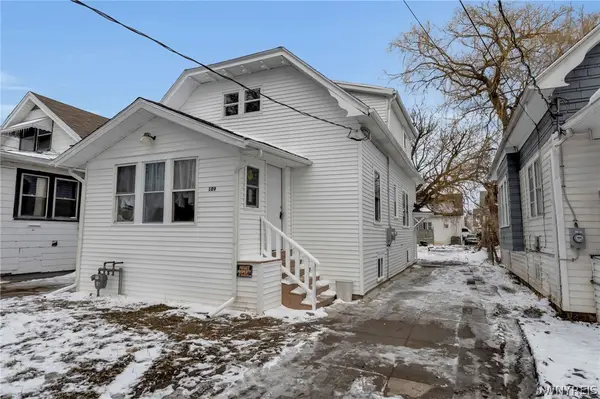
109 Poultney Avenue, Buffalo, NY 14215
MLS# B1667574Listed by: ICONIC REAL ESTATE 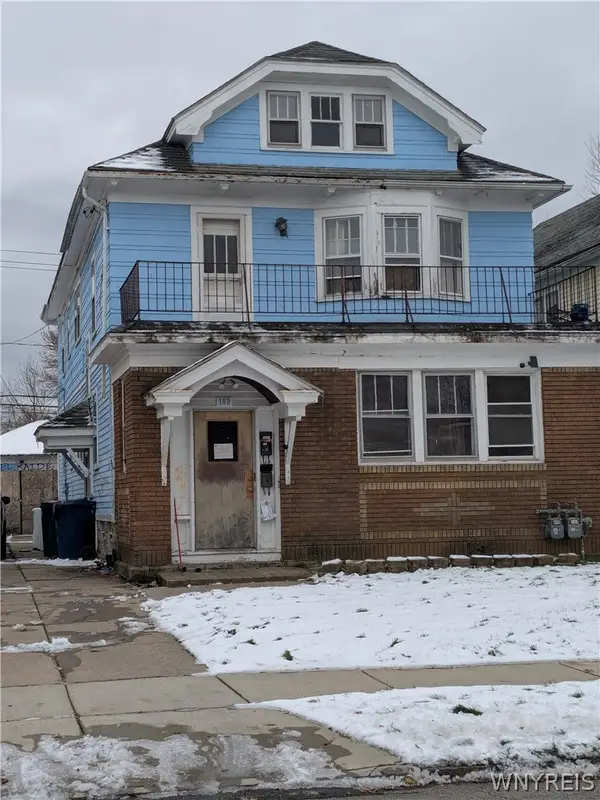 $225,000Active6 beds 2 baths2,536 sq. ft.
109 Shirley Avenue, Buffalo, NY 14215
MLS# B1657900Listed by: HOWARD HANNA WNY INC. $179,000Active3 beds 1 baths1,286 sq. ft.
35 Hewitt Avenue, Buffalo, NY 14215
MLS# B1666989Listed by: MOOTRY MURPHY & BURGIN REALTY GROUP LLC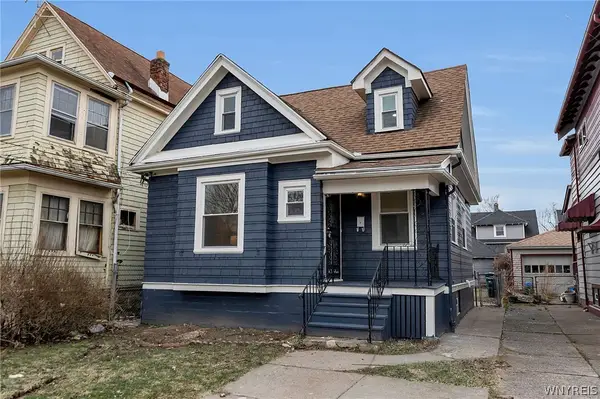 $169,999Pending3 beds 1 baths1,750 sq. ft.
22 Thatcher Avenue, Buffalo, NY 14215
MLS# B1667064Listed by: TOWNE HOUSING REAL ESTATE $269,900Active6 beds 2 baths2,532 sq. ft.
252 Dartmouth Avenue, Buffalo, NY 14215
MLS# B1666275Listed by: HUNT REAL ESTATE CORPORATION $199,900Active4 beds 1 baths1,251 sq. ft.
307 Berkshire Avenue, Buffalo, NY 14215
MLS# B1665447Listed by: TOWNE HOUSING REAL ESTATE $169,900Active3 beds 1 baths1,868 sq. ft.
496 E Amherst Street #N, Buffalo, NY 14215
MLS# B1665825Listed by: KELLER WILLIAMS REALTY WNY $89,777Pending3 beds 1 baths1,165 sq. ft.
120 Elmer Avenue, Buffalo, NY 14215
MLS# R1665063Listed by: REVOLUTION REAL ESTATE $275,000Active4 beds 2 baths2,087 sq. ft.
347 Highgate Avenue #2, Buffalo, NY 14215
MLS# B1660693Listed by: TOWNE HOUSING REAL ESTATE $165,000Active3 beds 2 baths1,384 sq. ft.
235 Comstock Avenue, Buffalo, NY 14215
MLS# B1663915Listed by: WNY METRO ROBERTS REALTY $119,000Pending2 beds 2 baths894 sq. ft.
165 Hewitt Avenue, Buffalo, NY 14215
MLS# B1663255Listed by: KELLER WILLIAMS REALTY WNY $169,000Pending3 beds 2 baths1,872 sq. ft.
8 Midvale Avenue, Buffalo, NY 14215
MLS# B1663015Listed by: MOOTRY MURPHY & BURGIN REALTY GROUP LLC $189,900Pending6 beds 2 baths1,695 sq. ft.
101 Custer Street, Buffalo, NY 14214
MLS# B1657260Listed by: GURNEY BECKER & BOURNE $169,900Pending3 beds 1 baths1,627 sq. ft.
538 E Amherst Street, Buffalo, NY 14215
MLS# B1656332Listed by: KELLER WILLIAMS REALTY WNY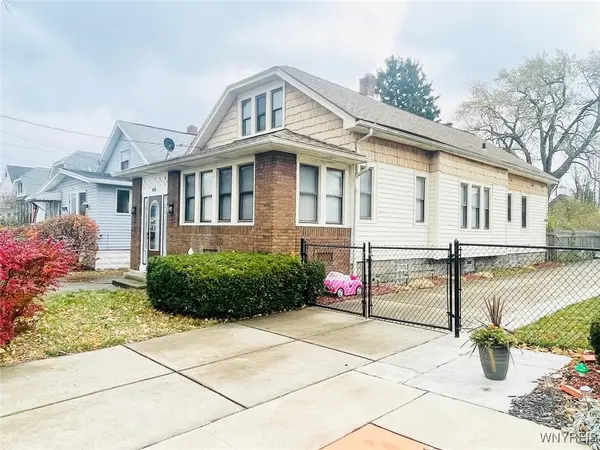 $159,900Pending3 beds 1 baths1,611 sq. ft.
353 Warwick Avenue, Buffalo, NY 14215
MLS# B1658067Listed by: ARROWHEAD PROPERTY MANAGEMENT, LLC $129,900Pending4 beds 2 baths2,402 sq. ft.
181 Clarence Avenue, Buffalo, NY 14215
MLS# B1657781Listed by: EXP REALTY $284,999Pending5 beds 2 baths1,887 sq. ft.
55 Winspear Avenue, Buffalo, NY 14214
MLS# B1656306Listed by: MERCER REAL ESTATE $224,900Pending5 beds 2 baths1,914 sq. ft.
25 Parkridge Avenue, Buffalo, NY 14215
MLS# B1655711Listed by: HUNT REAL ESTATE CORPORATION $170,000Active4 beds 1 baths1,270 sq. ft.
375 Olympic Avenue, Buffalo, NY 14215
MLS# B1655690Listed by: SCOTT REALTY GROUP LLC $149,900Active3 beds 1 baths1,336 sq. ft.
424 Lasalle Avenue, Buffalo, NY 14215
MLS# B1654003Listed by: HOWARD HANNA WNY INC. $166,000Pending3 beds 1 baths1,242 sq. ft.
126 Shirley Avenue, Buffalo, NY 14215
MLS# B1666727Listed by: HUNT REAL ESTATE CORPORATION $128,400Active4 beds 1 baths1,361 sq. ft.
191 Stockbridge Avenue, Buffalo, NY 14215
MLS# B1648388Listed by: WNY METRO ROBERTS REALTY $265,000Pending7 beds 4 baths3,023 sq. ft.
260 Lisbon Avenue, Buffalo, NY 14215
MLS# B1665621Listed by: HUNT REAL ESTATE CORPORATION $159,900Pending3 beds 2 baths1,514 sq. ft.
106 Berwyn Avenue, Buffalo, NY 14215
MLS# B1644616Listed by: HUNT REAL ESTATE CORPORATION $110,000Pending4 beds 1 baths1,437 sq. ft.
83 Collingwood Avenue, Buffalo, NY 14215
MLS# B1638367Listed by: HUNT REAL ESTATE CORPORATION $199,900Pending4 beds 2 baths1,617 sq. ft.
243 Berkshire Avenue, Buffalo, NY 14215
MLS# B1633880Listed by: HUNT REAL ESTATE CORPORATION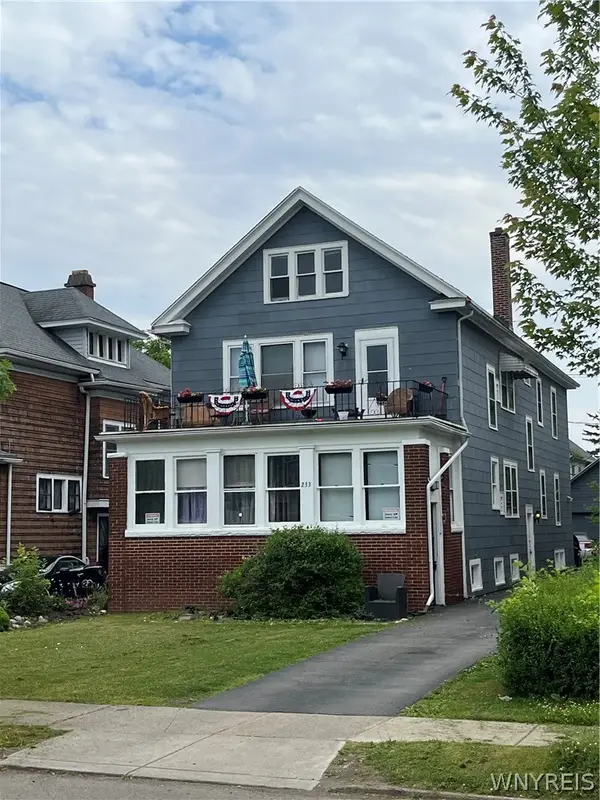 $299,000Active6 beds 2 baths2,784 sq. ft.
233 Minnesota Avenue, Buffalo, NY 14215
MLS# B1667104Listed by: CHUBB-AUBREY LEONARD REAL ESTATE $165,000Pending3 beds 1 baths1,050 sq. ft.
702 Norfolk Avenue, Buffalo, NY 14215
MLS# B1628928Listed by: SIMMONE REAL ESTATE LLC $139,084Pending3 beds 1 baths1,510 sq. ft.
84 Elmer Avenue, Buffalo, NY 14215
MLS# B1597040Listed by: HOWARD HANNA WNY INC. $199,999Pending4 beds 2 baths1,887 sq. ft.
55 Winspear Avenue, Buffalo, NY 14214
MLS# B1513053Listed by: MERCER REAL ESTATE
Local realty services provided by:CENTURY 21 Galloway Realty
Popular neighborhoods near LaSalle, Buffalo, NY
Zip codes near LaSalle, Buffalo, NY
- 14201 homes for sale
- 14202 homes for sale
- 14204 homes for sale
- 14206 homes for sale
- 14207 homes for sale
- 14208 homes for sale
- 14209 homes for sale
- 14210 homes for sale
- 14211 homes for sale
- 14212 homes for sale
- 14213 homes for sale
- 14214 homes for sale
- 14215 homes for sale
- 14216 homes for sale
- 14217 homes for sale
- 14222 homes for sale
- 14223 homes for sale
- 14225 homes for sale
- 14226 homes for sale
- 14227 homes for sale
Counties near LaSalle, Buffalo, NY
- Allegany County homes for sale
- Cattaraugus County homes for sale
- Chautauqua County homes for sale
- Erie County homes for sale
- Erie County homes for sale
- Genesee County homes for sale
- Livingston County homes for sale
- McKean County homes for sale
- Monroe County homes for sale
- Niagara County homes for sale
- Ontario County homes for sale
- Orleans County homes for sale
- Potter County homes for sale
- Steuben County homes for sale
- Warren County homes for sale
- Wayne County homes for sale
- Wyoming County homes for sale
- Yates County homes for sale
Protect your home and budget from life's surprises with an Assurant Home Warranty, backed by a partner that supports you through every step of homeownership. Explore Plans.
©2026 Century 21 Real Estate LLC. All rights reserved. CENTURY 21®, the CENTURY 21 Logo and C21® are service marks owned by Century 21 Real Estate LLC. Century 21 Real Estate LLC fully supports the principles of the Fair Housing Act and the Equal Opportunity Act. Each office is independently owned and operated. Listing information is deemed reliable but not guaranteed accurate.