- Briarcliff homes for sale
- Brushy Creek homes for sale
- Cedar Park homes for sale
- Cedar Park-Liberty Hill homes for sale
- Hudson Bend homes for sale
- Jonestown homes for sale
- Lago Vista homes for sale
- Lakeway homes for sale
- Leander homes for sale
- Leander homes for sale
- Liberty Hill homes for sale
- Northwest Travis homes for sale
- Point Venture homes for sale
- Round Rock homes for sale
- Round Rock-Georgetown homes for sale
- Santa Rita Ranch homes for sale
- Spicewood homes for sale
- Steiner Ranch homes for sale
- The Hills homes for sale
- Volente homes for sale
78641, TX - homes for sale
30 of 30 results displayed
- Open Sun, 2 to 4pmNew
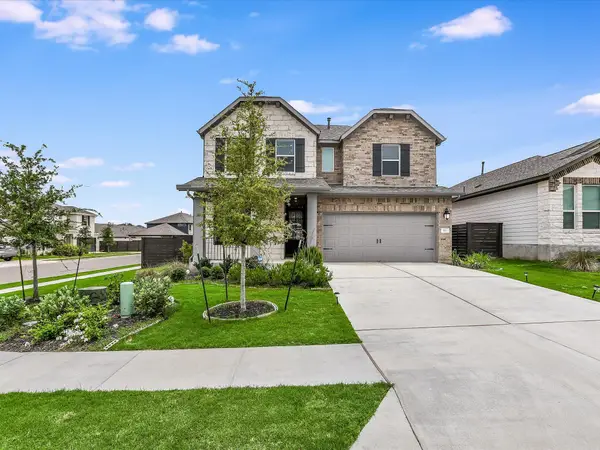
 $515,000Active5 beds 4 baths2,970 sq. ft.
1233 Sweetspire St, Leander, TX 78641
MLS# 4528642Listed by: IVY RESIDENTIAL GROUP, LLC. - New
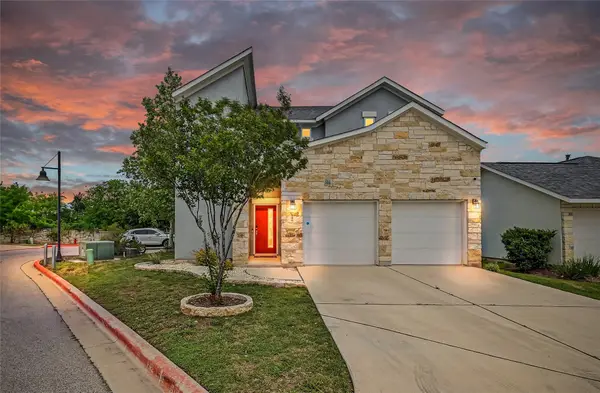
 $314,990Active3 beds 3 baths1,446 sq. ft.
1713 Fountain Bridge Dr, Leander, TX 78641
MLS# 5082735Listed by: MARTI REALTY GROUP - Open Sat, 12 to 2pmNew
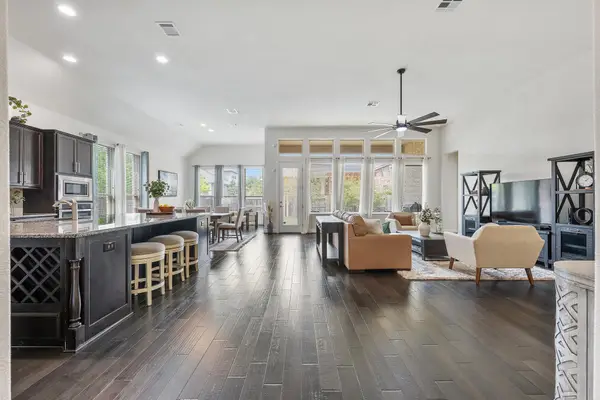
 $550,000Active5 beds 3 baths2,240 sq. ft.
918 Valley View Dr, Leander, TX 78641
MLS# 7199688Listed by: LIGHTHOUSE PREMIER REALTY - Open Sat, 11am to 2pmNew
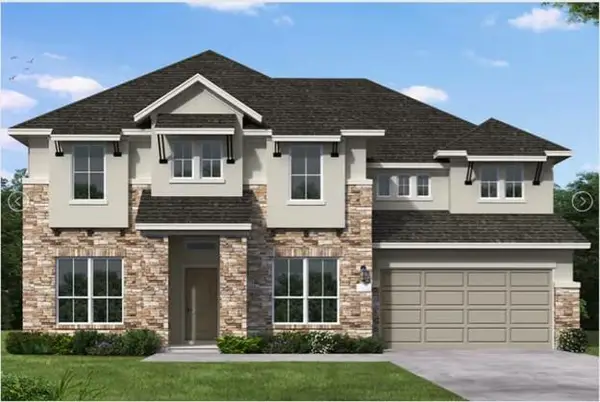
 $395,000Active4 beds 3 baths2,022 sq. ft.
1449 Weatherford Ln, Leander, TX 78641
MLS# 7801878Listed by: SPYGLASS REALTY - Open Sun, 2 to 4pmNew
 $550,000Active5 beds 4 baths2,832 sq. ft.
1921 Sir Nathaniel Ln, Leander, TX 78641
MLS# 1920786Listed by: REDFIN CORPORATION - Open Sat, 1 to 3pmNew
 $949,000Active4 beds 5 baths4,551 sq. ft.
4601 Apollonia Way, Leander, TX 78641
MLS# 615689Listed by: EXP REALTY - AUSTIN - Open Sat, 11am to 1pmNew
 $749,000Active4 beds 4 baths3,247 sq. ft.
3625 Garrano Bnd, Leander, TX 78641
MLS# 2335329Listed by: 4D REALTY, PLLC - Open Sat, 1 to 3pmNew
 $679,900Active4 beds 3 baths3,001 sq. ft.
1608 Carmine Dr, Leander, TX 78641
MLS# 3047911Listed by: COMPASS RE TEXAS, LLC - Open Sun, 1 to 3pm
 $615,000Active3 beds 4 baths2,919 sq. ft.
3932 Pine Cone Way, Leander, TX 78641
MLS# 2272657Listed by: WORTH CLARK REALTY - Open Sat, 1 to 3pm
 $949,000Active4 beds 5 baths4,551 sq. ft.
4601 Apollonia Way, Leander, TX 78641
MLS# 9155258Listed by: EXP REALTY LLC - Open Sat, 10am to 2pm
 $1,425,000Active5 beds 6 baths5,773 sq. ft.
2209 Bel Paese Bend, Leander, TX 78641
MLS# 21275987Listed by: UCRE HEART OF TEXAS LAND & HOME - Open Sun, 12 to 2pm
 $774,900Active5 beds 6 baths3,326 sq. ft.
1021 Mollie Mcbride Ln, Leander, TX 78641
MLS# 1769235Listed by: EPIQUE REALTY LLC - Open Sun, 2 to 4pm
 $420,000Active4 beds 4 baths2,294 sq. ft.
2049 Winston Way, Leander, TX 78641
MLS# 9348495Listed by: CRYSTAL FALLS REALTY - Open Sat, 10:30am to 12:30pm
 $549,900Active4 beds 3 baths2,307 sq. ft.
1812 David Ezra St, Leander, TX 78641
MLS# 4094658Listed by: PURE REALTY - Open Wed, 9am to 8pm
 $600,000Active4 beds 4 baths2,545 sq. ft.
1816 Ficuzza Way, Leander, TX 78641
MLS# 5922313Listed by: OLVERA BOLTON PROPERTIES - Open Sat, 11am to 1pm
 $970,000Active4 beds 5 baths3,700 sq. ft.
4513 Vieste Vw, Leander, TX 78641
MLS# 5914107Listed by: COMPASS RE TEXAS, LLC - Open Sun, 1 to 3pm
 $799,000Active4 beds 4 baths3,520 sq. ft.
1733 Siena Sunset Rd, Leander, TX 78641
MLS# 9951249Listed by: ALL CITY REAL ESTATE LTD. CO - Open Sat, 2 to 4pm
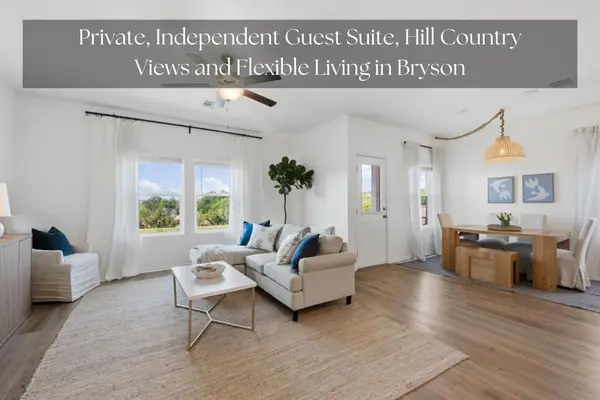
 $659,000Active5 beds 4 baths3,090 sq. ft.
1140 Bryson Ridge Trl, Leander, TX 78641
MLS# 5885977Listed by: COMPASS RE TEXAS, LLC - Open Sun, 1 to 4pm
 $564,900Active5 beds 4 baths2,858 sq. ft.
512 Voyage Trce, Leander, TX 78641
MLS# 2357229Listed by: COMPASS RE TEXAS, LLC - Open Sat, 12 to 3pm
 $425,000Active3 beds 3 baths2,181 sq. ft.
13701 Ronald W Reagan Blvd #68, Cedar Park, TX 78613
MLS# 3990712Listed by: VOLT REALTY - Open Sun, 2 to 4pm
 $484,000Active4 beds 3 baths2,756 sq. ft.
2009 Southcreek Dr, Leander, TX 78641
MLS# 1534204Listed by: KELLER WILLIAMS REALTY - Open Wed, 11am to 5pm
 $749,900Active4 beds 5 baths3,577 sq. ft.
1809 Sauterne Dr, Leander, TX 78641
MLS# 7082908Listed by: NEW HOME NOW  $449,888Active3 beds 2 baths2,336 sq. ft.
1001 Swan Flower St, Leander, TX 78641
MLS# 3350552Listed by: JBGOODWIN REALTORS NW- Open Sun, 2 to 4pm
 $399,900Active4 beds 3 baths2,016 sq. ft.
1609 Woolsey Way, Leander, TX 78641
MLS# 9464665Listed by: REAL BROKER, LLC - Open Wed, 11am to 5pm
 $674,900Active4 beds 4 baths2,879 sq. ft.
1805 Sauterne Dr, Leander, TX 78641
MLS# 5248521Listed by: NEW HOME NOW - Open Sun, 1 to 4pm
 $599,900Active5 beds 4 baths2,696 sq. ft.
737 Leeward Pass, Leander, TX 78641
MLS# 9125542Listed by: PURE REALTY - Open Sat, 1 to 4pm
 $899,990Active4 beds 3 baths2,887 sq. ft.
112 Red Mulberry Way, Leander, TX 78641
MLS# 2727185Listed by: MARTI REALTY GROUP - Open Sat, 1 to 4pm
 $1,175,000Active5 beds 4 baths4,388 sq. ft.
2801 Mossy Springs Dr, Leander, TX 78641
MLS# 6120851Listed by: BEYCOME BROKERAGE REALTY LLC - Open Wed, 11am to 5pm
 $699,900Active4 beds 3 baths3,478 sq. ft.
1812 Camay St, Leander, TX 78641
MLS# 4480345Listed by: NEW HOME NOW - Open Wed, 11am to 5pm
 $854,990Active4 beds 5 baths3,849 sq. ft.
1432 Jolie Rose Bnd, Leander, TX 78641
MLS# 6088060Listed by: NEW HOME NOW
Local realty services provided by:CENTURY 21 Judge Fite Company, CENTURY 21 North East, CENTURY 21 Gold Coat Realtors
Some properties that appear for sale on this web site may subsequently have been sold and may no longer be available. The data relating to real estate for sale on this web site comes in part from the FHAAR IDX INFO SHARE PROGRAM. Real estate listings held by brokerage firms other than CENTURY 21 North East include the name of the listing agent. Copyright 2026 FHAAR IDX INFO SHARE PROGRAM. Last Updated June 7, 2026 TX_FRAR Member Broker: Lisa Shaw
Information provided, in part, by North Texas Real Estate Information Systems, Inc. Last Updated June 9, 2026 Listings with the NTREIS logo are listed by brokerages other than CENTURY 21 Gold Coat Realtors. GDAR Member Broker: Katherine Hein
Popular searches near 78641
Popular neighborhoods near 78641
- Block House Creek, Leander homes for sale
- Buttercup Creek, Cedar Park homes for sale
- Carriage Hills, Cedar Park homes for sale
- Cedar Park Ranchettes, Cedar Park homes for sale
- Crystal Falls, Leander homes for sale
- Gann Ranch, Cedar Park homes for sale
- Gate Hollow Estates, Leander homes for sale
- Lakeline Ranch, Leander homes for sale
- Leander, Leander homes for sale
- Leander Heights, Leander homes for sale
- Leander Hills, Leander homes for sale
- Mason Creek, Leander homes for sale
- Mason Hills, Leander homes for sale
- Northshore, Leander homes for sale
- Round Mountain Oaks, Leander homes for sale
- Sandy Creek Ranches, Leander homes for sale
- The Bluffs, Leander homes for sale
- The Highlands at Crystal Falls, Leander homes for sale
- Trails End at Lake Travis, Leander homes for sale
- Vista Ridge, Leander homes for sale
Counties near Leander, 78641
- Bastrop County homes for sale
- Bell County homes for sale
- Blanco County homes for sale
- Burnet County homes for sale
- Caldwell County homes for sale
- Comal County homes for sale
- Coryell County homes for sale
- Falls County homes for sale
- Fayette County homes for sale
- Gillespie County homes for sale
- Guadalupe County homes for sale
- Hays County homes for sale
- Kendall County homes for sale
- Lampasas County homes for sale
- Lee County homes for sale
- Llano County homes for sale
- Milam County homes for sale
- San Saba County homes for sale
- Travis County homes for sale
- Williamson County homes for sale
Protect your home and budget from life's surprises with an Assurant Home Warranty, backed by a partner that supports you through every step of homeownership. Explore Plans.
©2026 Century 21 Real Estate LLC. All rights reserved. CENTURY 21®, the CENTURY 21 Logo and C21® are service marks owned by Century 21 Real Estate LLC. Century 21 Real Estate LLC fully supports the principles of the Fair Housing Act and the Equal Opportunity Act. Each office is independently owned and operated. Listing information is deemed reliable but not guaranteed accurate.