- Atoka properties for sale
- Caddo properties for sale
- Central Atoka properties for sale
- Coalgate properties for sale
- Coleman properties for sale
- East Coal properties for sale
- East Johnston properties for sale
- Kenefic properties for sale
- Kiowa properties for sale
- Kiowa-Pittsburg properties for sale
- Lane properties for sale
- Milburn properties for sale
- North Atoka properties for sale
- Pittsburg properties for sale
- Southeast Pontotoc properties for sale
- Stonewall properties for sale
- Stringtown properties for sale
- Tupelo properties for sale
- West Atoka properties for sale
- West Coal properties for sale
74556, OK - homes for sale
2 of 2 results displayed
 $1,799,000Active5 beds 3 baths4,050 sq. ft.
37968 County Road 1590, Coalgate, OK 74538
MLS# 2533167Listed by: MCGRAW, REALTORS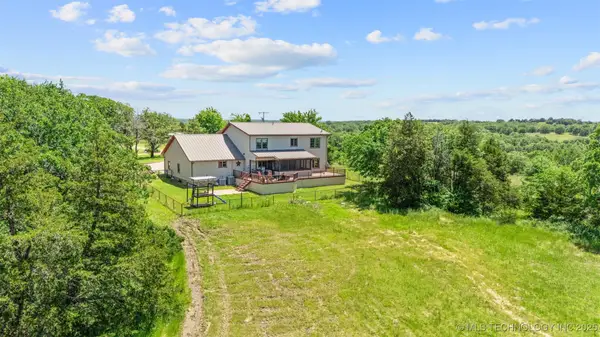 $2,250,000Active5 beds 3 baths4,050 sq. ft.
37969 County Road 1590, Coalgate, OK 74538
MLS# 2521594Listed by: MCGRAW, REALTORS
Local realty services provided by:CENTURY 21 First Choice Realty
Popular searches near 74556
Popular neighborhoods near 74556
- Andrews Park, Norman properties for sale
- Belmar Golf Club, North Cleveland properties for sale
- Bishop Creek, Norman properties for sale
- Colonial Estates, Norman properties for sale
- Downtown Norman, Norman properties for sale
- First Courthouse, Norman properties for sale
- Hall Park, Norman properties for sale
- Heatherwood, McKinney properties for sale
- High Pointe, McKinney properties for sale
- Larsh / Miller, Norman properties for sale
- Mustang Lakes, Celina properties for sale
- Old Silk Stocking, Norman properties for sale
- Original Townsite, Norman properties for sale
- Pebblebrook, Sherman properties for sale
- Pecan Creek, Newalla properties for sale
- Shadowlake, Norman properties for sale
- Southeast Oklahoma City, Oklahoma City properties for sale
- Summit View Lakes, McKinney properties for sale
- The Bridges at Preston Crossing, Gunter properties for sale
- Urbanton, McKinney properties for sale
Counties near Lehigh, 74556
- Atoka County properties for sale
- Bryan County properties for sale
- Carter County properties for sale
- Choctaw County properties for sale
- Coal County properties for sale
- Fannin County properties for sale
- Garvin County properties for sale
- Grayson County properties for sale
- Hughes County properties for sale
- Johnston County properties for sale
- Lamar County properties for sale
- Latimer County properties for sale
- Marshall County properties for sale
- McIntosh County properties for sale
- Murray County properties for sale
- Pittsburg County properties for sale
- Pontotoc County properties for sale
- Pottawatomie County properties for sale
- Pushmataha County properties for sale
- Seminole County properties for sale
©2025 Century 21 Real Estate LLC. All rights reserved. CENTURY 21®, the CENTURY 21 Logo and C21® are service marks owned by Century 21 Real Estate LLC. Century 21 Real Estate LLC fully supports the principles of the Fair Housing Act and the Equal Opportunity Act. Each office is independently owned and operated. Listing information is deemed reliable but not guaranteed accurate.
©2025 Century 21 Real Estate LLC. All rights reserved. CENTURY 21®, the CENTURY 21 Logo and C21® are service marks owned by Century 21 Real Estate LLC. Century 21 Real Estate LLC fully supports the principles of the Fair Housing Act and the Equal Opportunity Act. Each office is independently owned and operated. Listing information is deemed reliable but not guaranteed accurate.