- Adams homes for sale
- Bowling Green homes for sale
- Cedar Hill homes for sale
- Central City homes for sale
- Crofton homes for sale
- East Simpson homes for sale
- Elkton homes for sale
- Franklin homes for sale
- Greencastle homes for sale
- Greenville homes for sale
- Guthrie homes for sale
- Hopkinsville homes for sale
- Lewisburg homes for sale
- Oak Grove homes for sale
- Oak Grove-Pembroke homes for sale
- Orlinda homes for sale
- Pembroke homes for sale
- Penrod homes for sale
- Russellville homes for sale
- Trenton homes for sale
42256, KY - homes for sale
6 of 6 results displayed
- New
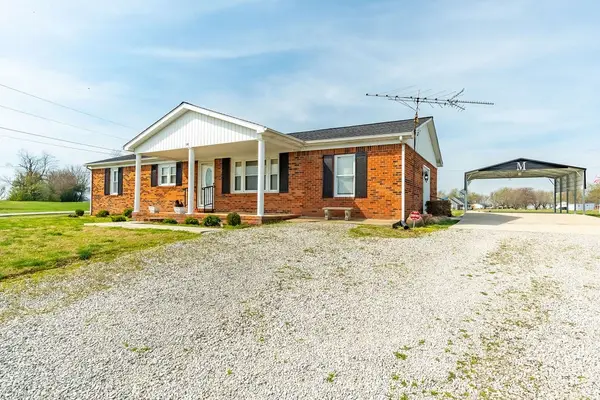 $229,900Active3 beds 1 baths2,000 sq. ft.
260 Heltsley St, Lewisburg, KY 42256
MLS# 3165691Listed by: BOLINGER REAL ESTATE & AUCTION, LLC  $290,000Pending2 beds 2 baths1,200 sq. ft.
94 Angela Way, Lewisburg, KY 42256
MLS# 3150301Listed by: RE/MAX PREFERRED & AUCTION $29,900Active2 beds -- baths576 sq. ft.
0 Clifty Creek Rd, Lewisburg, KY 42256
MLS# 3136911Listed by: COPE ASSOCIATES REALTY & AUCTION, LLC $339,500Active4 beds 2 baths1,463 sq. ft.
419 Jackie Dukes Dr, Lewisburg, KY 42256
MLS# 3117505Listed by: BENCHMARK REALTY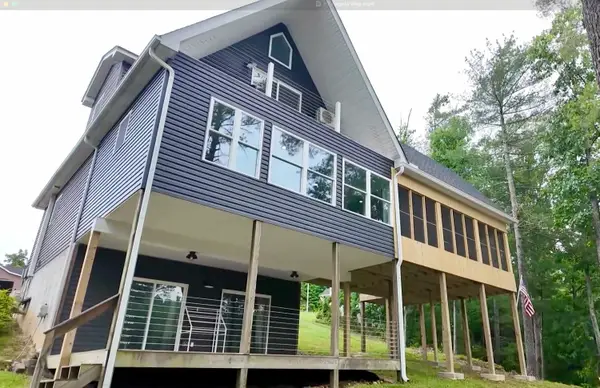 $539,900Active4 beds 3 baths1,886 sq. ft.
87 Angela Way, Lewisburg, KY 42256
MLS# 3116336Listed by: RE/MAX PREFERRED & AUCTION $380,000Active3 beds 3 baths2,096 sq. ft.
1433 Spa Rd, Lewisburg, KY 42256
MLS# 3003099Listed by: KEYSTONE REALTY AND MANAGEMENT
Local realty services provided by:CENTURY 21 Premier
Popular searches near 42256
Popular neighborhoods near 42256
- Anderson Place, Clarksville homes for sale
- Apple Hollow, Clarksville homes for sale
- Aspen Grove, Clarksville homes for sale
- Avalon, Clarksville homes for sale
- Bluegrass Downs, Clarksville homes for sale
- Centerstone Village, Clarksville homes for sale
- Creekview Village, Clarksville homes for sale
- Crosswinds, Clarksville homes for sale
- Ellington Chase, Clarksville homes for sale
- Farmington, Clarksville homes for sale
- Franklin Meadows, Clarksville homes for sale
- Glen Ellen Landing, Clarksville homes for sale
- Governors Crossing, Clarksville homes for sale
- Holly Point, Clarksville homes for sale
- Meriwether Farms, Clarksville homes for sale
- Plantation Estates, Clarksville homes for sale
- Somerset, Clarksville homes for sale
- Stones Manor, Clarksville homes for sale
- Tylertown, Clarksville homes for sale
- Virginia Hills, Clarksville homes for sale
Counties near Lewisburg, 42256
- Allen County homes for sale
- Barren County homes for sale
- Butler County homes for sale
- Caldwell County homes for sale
- Cheatham County homes for sale
- Christian County homes for sale
- Daviess County homes for sale
- Edmonson County homes for sale
- Grayson County homes for sale
- Hopkins County homes for sale
- Logan County homes for sale
- Montgomery County homes for sale
- Muhlenberg County homes for sale
- Ohio County homes for sale
- Robertson County homes for sale
- Simpson County homes for sale
- Sumner County homes for sale
- Todd County homes for sale
- Trigg County homes for sale
- Warren County homes for sale
Protect your home and budget from life's surprises with an Assurant Home Warranty, backed by a partner that supports you through every step of homeownership. Explore Plans.
©2026 Century 21 Real Estate LLC. All rights reserved. CENTURY 21®, the CENTURY 21 Logo and C21® are service marks owned by Century 21 Real Estate LLC. Century 21 Real Estate LLC fully supports the principles of the Fair Housing Act and the Equal Opportunity Act. Each office is independently owned and operated. Listing information is deemed reliable but not guaranteed accurate.