- Back Cove, Portland homes for sale
- Cumberland Mills, Westbrook homes for sale
- Deering Center, Portland homes for sale
- Downtown Lewiston, Lewiston homes for sale
- East Bayside, Portland homes for sale
- East Deering, Portland homes for sale
- East End, Portland homes for sale
- Edgecomb, Edgecomb homes for sale
- Long Island, Long Island homes for sale
- Nasons Corner, Portland homes for sale
- New Auburn, Auburn homes for sale
- North Deering, Portland homes for sale
- Oakdale, Portland homes for sale
- Peaks Island, Peaks Island homes for sale
- Pond Road, Lewiston homes for sale
- Riverton, Portland homes for sale
- Tree Streets, Lewiston homes for sale
- Webster Street, Lewiston homes for sale
- West Bayside, Portland homes for sale
- Wiscasset, Wiscasset homes for sale
Lewiston, ME - homes for sale
147 of 147 results displayed
- New
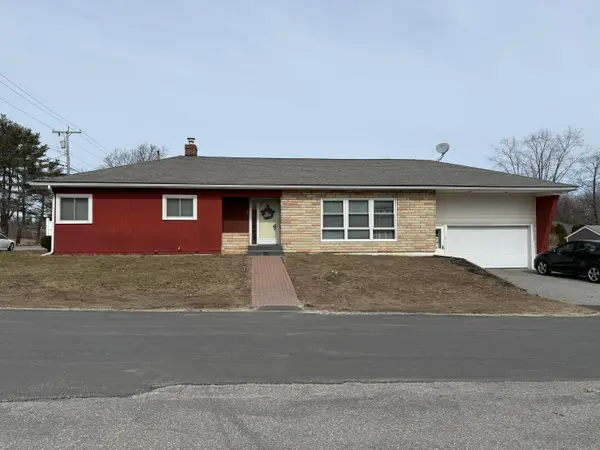
 $340,000Active3 beds 1 baths1,080 sq. ft.
10 Riley Street, Lewiston, ME 04240
MLS# 1661158Listed by: FONTAINE FAMILY-THE REAL ESTATE LEADER
- New
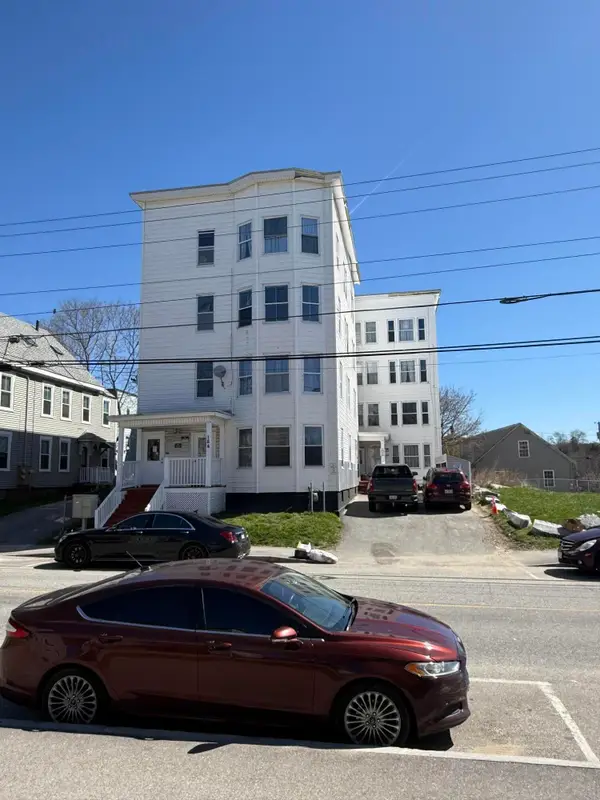
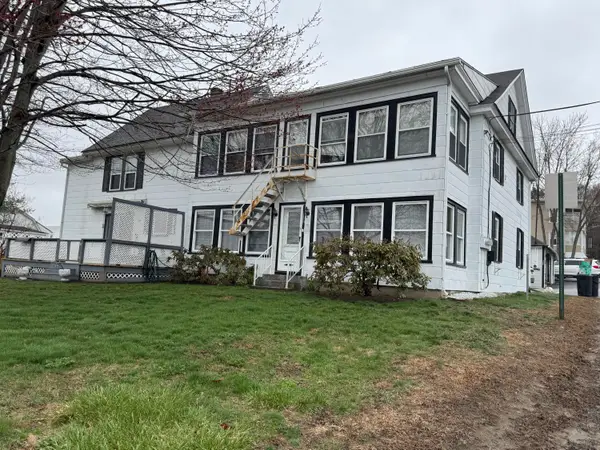
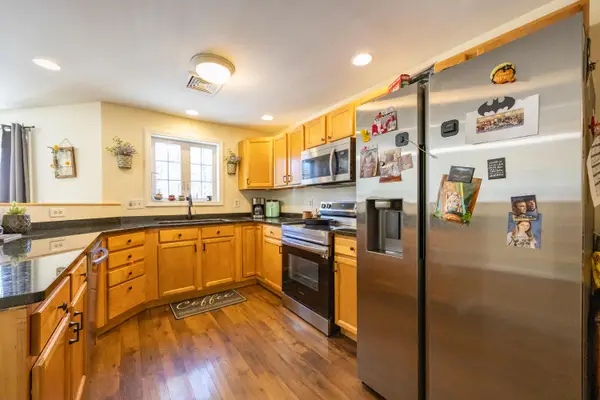
 $470,000Active-- beds 3 baths3,486 sq. ft.
174 Bartlett Street, Lewiston, ME 04240
MLS# 1661151Listed by: REAL BROKER - New
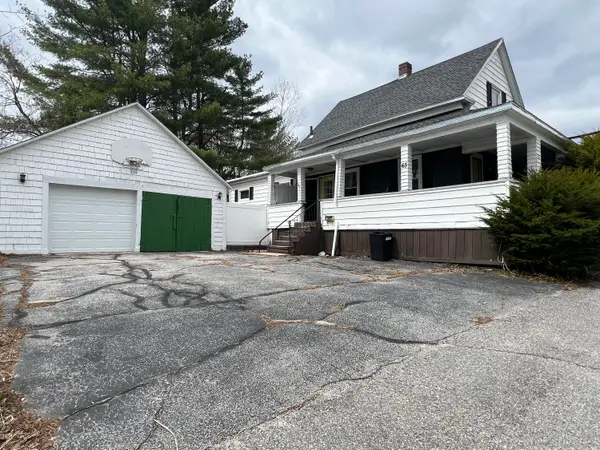
 $399,000Active4 beds 3 baths1,892 sq. ft.
50 Jean Street, Lewiston, ME 04240
MLS# 1661093Listed by: KELLER WILLIAMS REALTY - Open Sat, 10:30am to 2pmNew
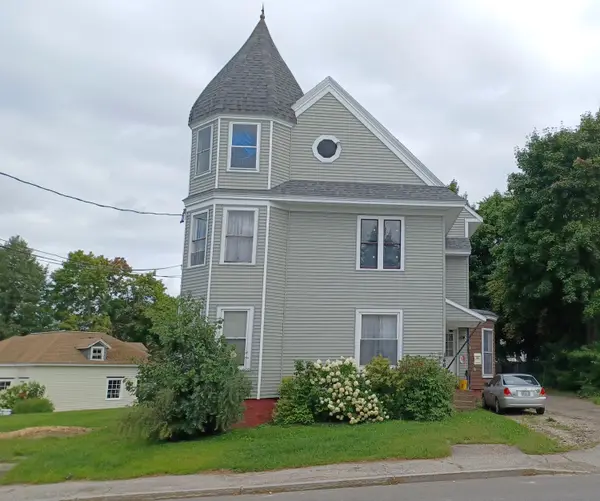
 $364,900Active3 beds 2 baths1,816 sq. ft.
78 Franklin Street, Lewiston, ME 04240
MLS# 1660972Listed by: KELLER WILLIAMS REALTY - Open Sat, 10 to 11:30amNew
 $305,000Active3 beds 1 baths1,040 sq. ft.
48 Dumont Avenue, Lewiston, ME 04240
MLS# 1660910Listed by: GALLANT REAL ESTATE - New
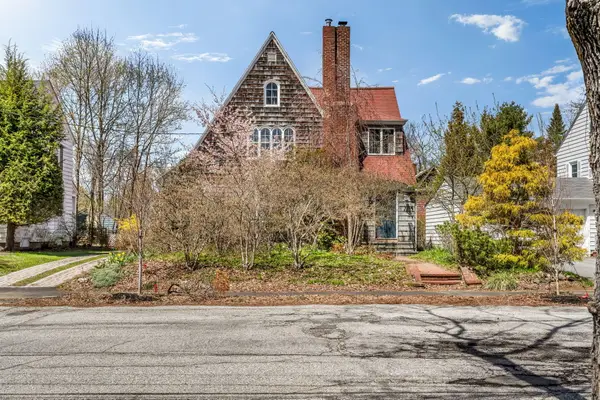
 $775,000Active-- beds 5 baths5,596 sq. ft.
127 Howe Street, Lewiston, ME 04240
MLS# 1660921Listed by: THE DUNHAM GROUP - New
 $44,900Active0.47 Acres
153 Cottage Street, Lewiston, ME 04240
MLS# 1660514Listed by: MESERVIER & ASSOCIATES - New
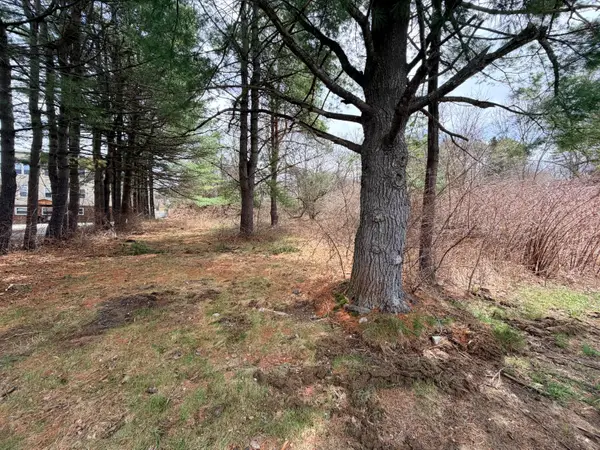
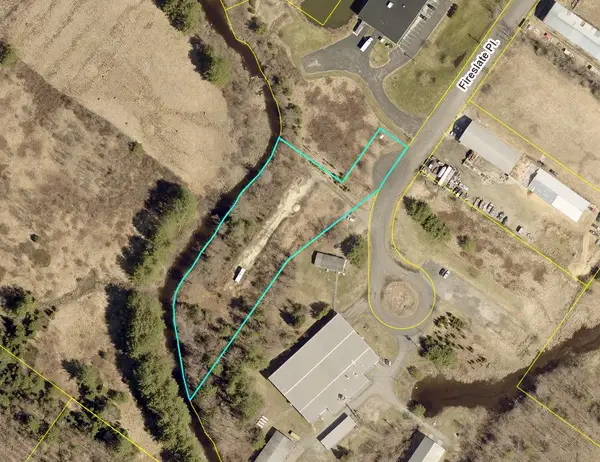 $120,000Active2.28 Acres
17 Fireslate Place, Lewiston, ME 04240
MLS# 1660524Listed by: KELLER WILLIAMS REALTY - New
 $899,000Active-- beds 8 baths7,920 sq. ft.
151 Horton Street, Lewiston, ME 04240
MLS# 1660474Listed by: KELLER WILLIAMS REALTY - New
 $499,000Active3 beds 2 baths3,009 sq. ft.
2 Nancy Street, Lewiston, ME 04240
MLS# 1660334Listed by: THE MAINE REAL ESTATE EXPERIENCE - New
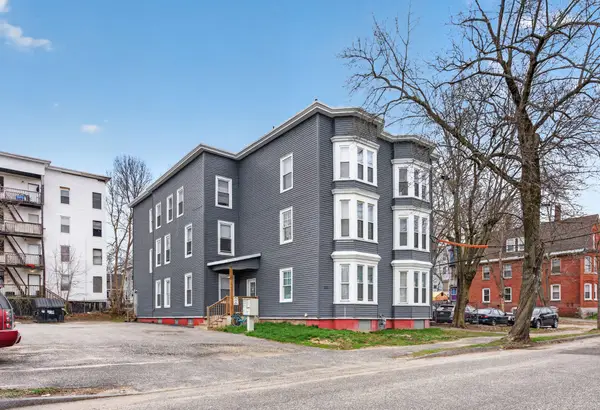
 $1,195,000Active-- beds 9 baths10,644 sq. ft.
184 Bartlett Street, Lewiston, ME 04240
MLS# 1660268Listed by: F.O. BAILEY REAL ESTATE - Coming Soon
 $349,000Coming Soon-- beds 2 baths
64 Old Greene Road, Lewiston, ME 04240
MLS# 1660265Listed by: BETTER HOMES & GARDENS REAL ESTATE/THE MASIELLO GROUP  $548,000Pending-- beds 4 baths5,940 sq. ft.
72 Jefferson Street, Lewiston, ME 04240
MLS# 1660251Listed by: BETTER HOMES & GARDENS REAL ESTATE/THE MASIELLO GROUP- New
 $479,900Active-- beds 4 baths6,224 sq. ft.
56 Wood Street, Lewiston, ME 04240
MLS# 1660206Listed by: ANDROVISE REALTY - Open Sat, 1 to 3pmNew
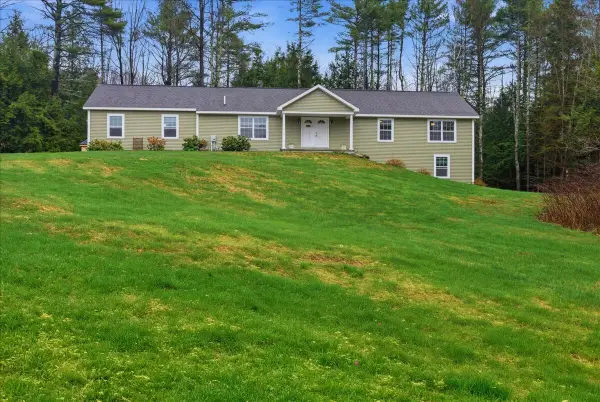 $599,000Active4 beds 3 baths3,292 sq. ft.
13 Bowdoin Drive, Lewiston, ME 04240
MLS# 1660239Listed by: HEARTH & KEY REALTY - New
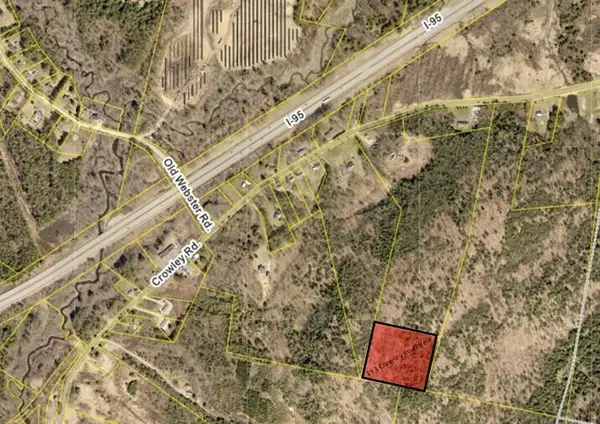 $20,000Active5.6 Acres
M-25 Lot 1 Crowley Road, Lewiston, ME 04240
MLS# 1660119Listed by: FONTAINE FAMILY-THE REAL ESTATE LEADER 
 $279,000Pending3 beds 1 baths1,050 sq. ft.
33 Garcelon Street, Lewiston, ME 04240
MLS# 1660122Listed by: CENTURY 21 ADVANTAGE- New
 $189,000Active3 beds 2 baths1,176 sq. ft.
22 Foch Street, Lewiston, ME 04240
MLS# 1660109Listed by: KELLER WILLIAMS COASTAL AND LAKES & MOUNTAINS REALTY - New
 $299,900Active3 beds 1 baths1,204 sq. ft.
40 Boston Avenue, Lewiston, ME 04240
MLS# 1660065Listed by: RE/MAX REALTY ONE 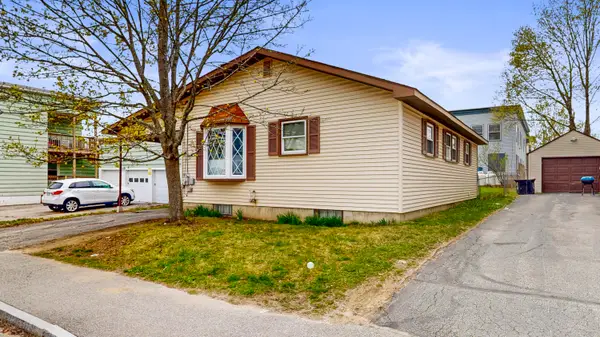 $250,000Pending3 beds 1 baths1,168 sq. ft.
67 Jefferson Street, Lewiston, ME 04240
MLS# 1659909Listed by: FONTAINE FAMILY-THE REAL ESTATE LEADER- New
 $549,900Active-- beds 4 baths3,118 sq. ft.
326 South Avenue, Lewiston, ME 04240
MLS# 1659803Listed by: BETTER HOMES & GARDENS REAL ESTATE/THE MASIELLO GROUP - New
 $189,900Active4 beds 2 baths1,040 sq. ft.
63 Rideout Avenue, Lewiston, ME 04240
MLS# 1659773Listed by: TREE STREET REALTY - New
 $397,000Active-- beds 4 baths2,468 sq. ft.
146 Sabattus Street, Lewiston, ME 04240
MLS# 1659535Listed by: MESERVIER & ASSOCIATES - New
 $399,000Active4 beds 3 baths2,204 sq. ft.
36 Pineland Street, Lewiston, ME 04240
MLS# 1659503Listed by: NEXTHOME EXPERIENCE  $325,000Pending3 beds 2 baths1,248 sq. ft.
173 Golder Road, Lewiston, ME 04240
MLS# 1659421Listed by: KELLER WILLIAMS REALTY $289,900Active-- beds 2 baths1,136 sq. ft.
5 Ralph Ave Avenue, Lewiston, ME 04240
MLS# 1659260Listed by: KELLER WILLIAMS REALTY $85,000Active2 beds 1 baths784 sq. ft.
5 Parkview Lane, Lewiston, ME 04240
MLS# 1659175Listed by: FONTAINE FAMILY-THE REAL ESTATE LEADER $125,000Active3 beds 2 baths1,456 sq. ft.
13 Evergreen Road, Lewiston, ME 04240
MLS# 1659130Listed by: FONTAINE FAMILY-THE REAL ESTATE LEADER $387,000Pending3 beds 2 baths1,344 sq. ft.
6 Lemay Avenue, Lewiston, ME 04240
MLS# 1659044Listed by: BEARFOOT REALTY $337,500Pending3 beds 1 baths988 sq. ft.
72 Alfred A Plourde Parkway, Lewiston, ME 04240
MLS# 1659001Listed by: FONTAINE FAMILY-THE REAL ESTATE LEADER $315,000Active3 beds 2 baths1,438 sq. ft.
5 Newman Street, Lewiston, ME 04240
MLS# 1659008Listed by: FIV REALTY CO MAINE, LLC $962,500Pending3 beds 2 baths995 sq. ft.
66 Alfred A Plourde Parkway, Lewiston, ME 04240
MLS# 1658967Listed by: FONTAINE FAMILY-THE REAL ESTATE LEADER $380,000Pending-- beds 3 baths2,112 sq. ft.
239 East Avenue, Lewiston, ME 04240
MLS# 1658960Listed by: DRAKES REAL ESTATE LLC $525,000Active5 beds 3 baths3,607 sq. ft.
7 Bayberry Lane, Lewiston, ME 04240
MLS# 1658805Listed by: KELLER WILLIAMS REALTY $289,900Active-- beds 2 baths1,961 sq. ft.
21 Bridge Street, Lewiston, ME 04240
MLS# 1658815Listed by: INTEGRITY HOMES REAL ESTATE GROUP, PC $399,000Pending-- beds 3 baths2,582 sq. ft.
153 Pine Street, Lewiston, ME 04240
MLS# 1658778Listed by: KELLER WILLIAMS REALTY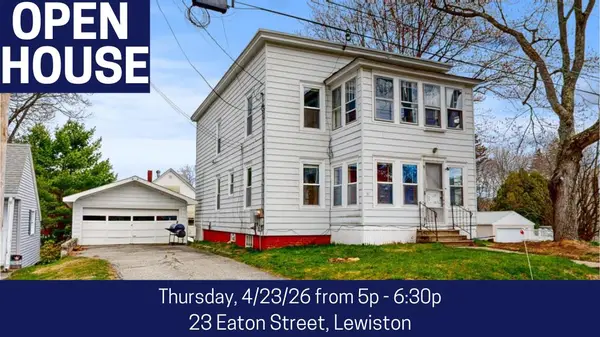 $335,000Active-- beds 2 baths1,680 sq. ft.
23 Eaton Street, Lewiston, ME 04240
MLS# 1658647Listed by: FONTAINE FAMILY-THE REAL ESTATE LEADER $95,000Active2 beds 2 baths924 sq. ft.
4 Sheldon Place, Lewiston, ME 04240
MLS# 1658593Listed by: FONTAINE FAMILY-THE REAL ESTATE LEADER $76,500Active2 beds 2 baths924 sq. ft.
3 Oxbow Drive, Lewiston, ME 04240
MLS# 1658461Listed by: HEARTH & KEY REALTY $429,000Pending3 beds 2 baths1,320 sq. ft.
35 Pinewoods Road, Lewiston, ME 04240
MLS# 1658450Listed by: FONTAINE FAMILY-THE REAL ESTATE LEADER $530,000Active4 beds 3 baths2,016 sq. ft.
Lot #6 Chase Lane, Lewiston, ME 04240
MLS# 1658432Listed by: HOME AT LAST REALTY $323,000Pending3 beds 2 baths1,412 sq. ft.
21 Mitchell Street, Lewiston, ME 04240
MLS# 1658309Listed by: THE MAINE REAL ESTATE EXPERIENCE $280,000Pending4 beds 1 baths2,288 sq. ft.
80 Stevens Street, Lewiston, ME 04240
MLS# 1658145Listed by: BREAKWATER REALTY GROUP, LLC $369,000Active-- beds 2 baths2,181 sq. ft.
38 Jefferson Street, Lewiston, ME 04240
MLS# 1658102Listed by: EXP REALTY- Open Fri, 4 to 5:30pm
 $274,000Pending5 beds 2 baths2,224 sq. ft.
26 Holland Street, Lewiston, ME 04240
MLS# 1658009Listed by: FONTAINE FAMILY-THE REAL ESTATE LEADER 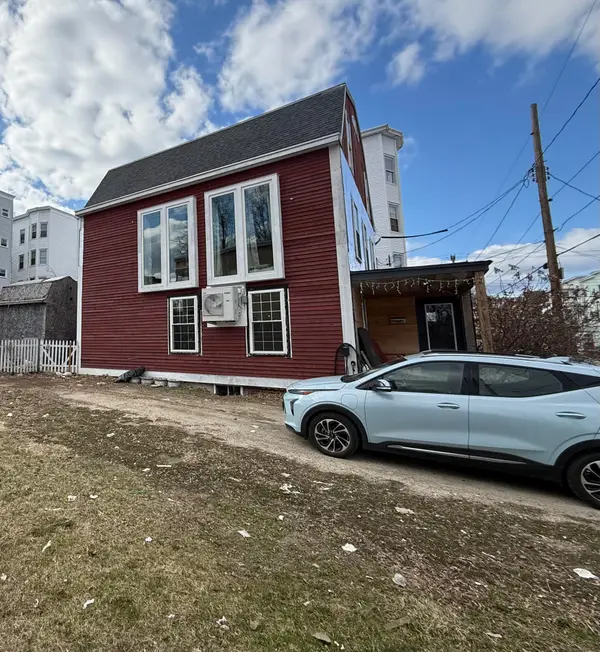 $350,000Active5 beds 2 baths2,550 sq. ft.
109 Shawmut Street, Lewiston, ME 04240
MLS# 1657936Listed by: KELLER WILLIAMS REALTY $375,000Active2 beds 2 baths1,157 sq. ft.
12 Fortin Way, Lewiston, ME 04240
MLS# 1657840Listed by: WWW.HOMEZU.COM $199,900Pending3 beds 2 baths1,092 sq. ft.
102 Mcnamara Street, Lewiston, ME 04240
MLS# 1657657Listed by: MAINE SOURCE REALTY $599,000Active3 beds 2 baths5,500 sq. ft.
49 Lisbon Street #2, Lewiston, ME 04240
MLS# 1657627Listed by: U&R REAL ESTATE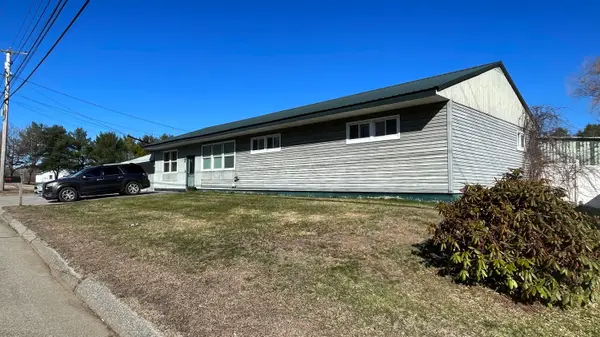 $699,000Active3 beds 2 baths1,960 sq. ft.
1294 Sabattus Street, Lewiston, ME 04240
MLS# 1657568Listed by: BERKSHIRE HATHAWAY HOMESERVICES NORTHEAST REAL ESTATE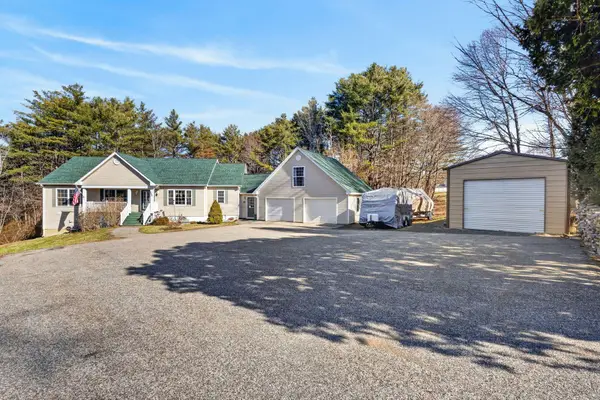 $445,000Pending3 beds 3 baths1,584 sq. ft.
384 Pond Road, Lewiston, ME 04240
MLS# 1657377Listed by: BENCHMARK REAL ESTATE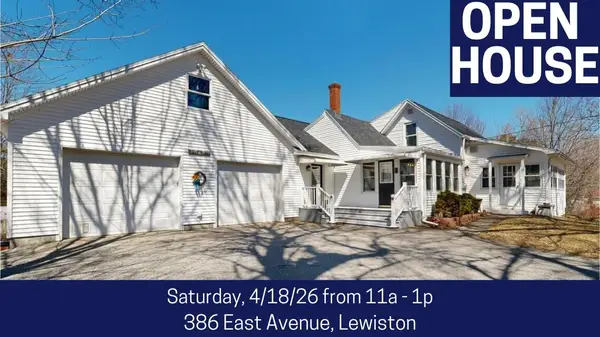 $400,000Pending3 beds 2 baths2,105 sq. ft.
386 East Avenue, Lewiston, ME 04240
MLS# 1657302Listed by: FONTAINE FAMILY-THE REAL ESTATE LEADER $394,000Active4 beds 3 baths2,760 sq. ft.
128 Pinewoods Road, Lewiston, ME 04240
MLS# 1657261Listed by: KELLER WILLIAMS REALTY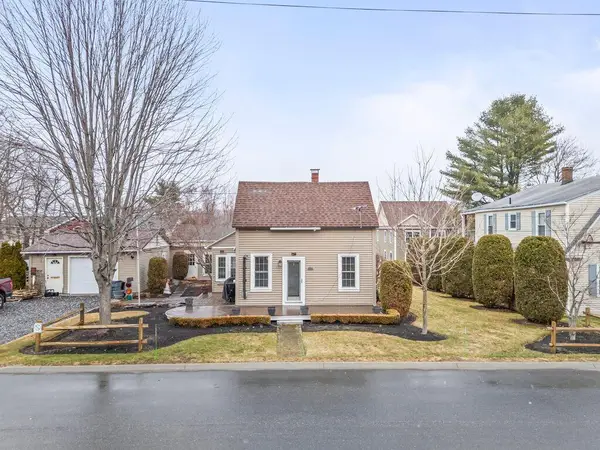 $275,000Pending3 beds 1 baths823 sq. ft.
166 Warren Avenue, Lewiston, ME 04240
MLS# 1657036Listed by: BETTER HOMES & GARDENS REAL ESTATE/THE MASIELLO GROUP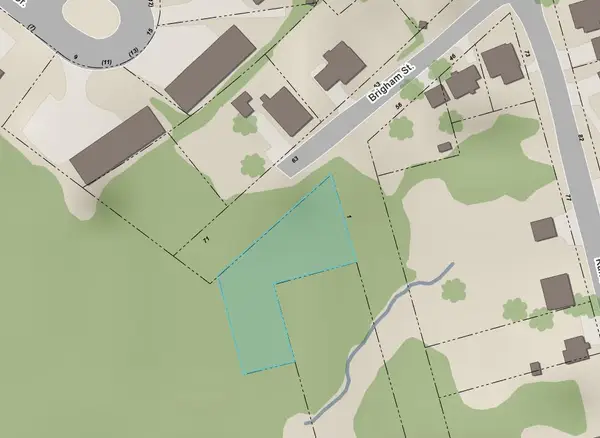 $2,500Active0.36 Acres
1 Carver Street, Lewiston, ME 04240
MLS# 1656985Listed by: KELLER WILLIAMS REALTY $5,900Active0.45 Acres
1 James Avenue, Lewiston, ME 04240
MLS# 1656986Listed by: KELLER WILLIAMS REALTY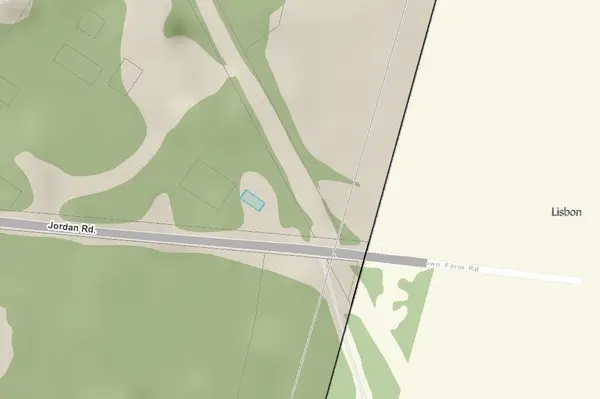 $500Active0.03 Acres
9 Ceres Avenue, Lewiston, ME 04210
MLS# 1656987Listed by: KELLER WILLIAMS REALTY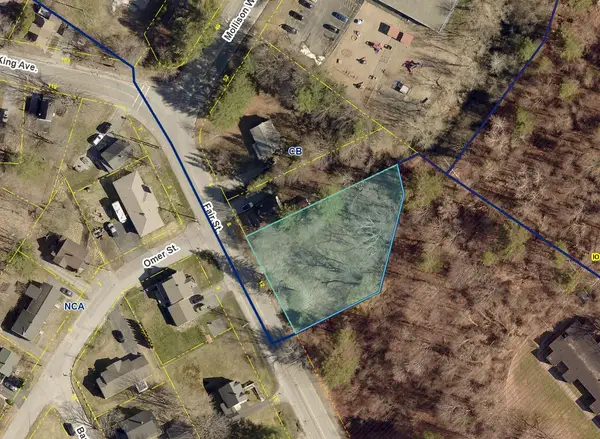 $49,900Active0.5 Acres
12 Fair Street, Lewiston, ME 04240
MLS# 1656988Listed by: KELLER WILLIAMS REALTY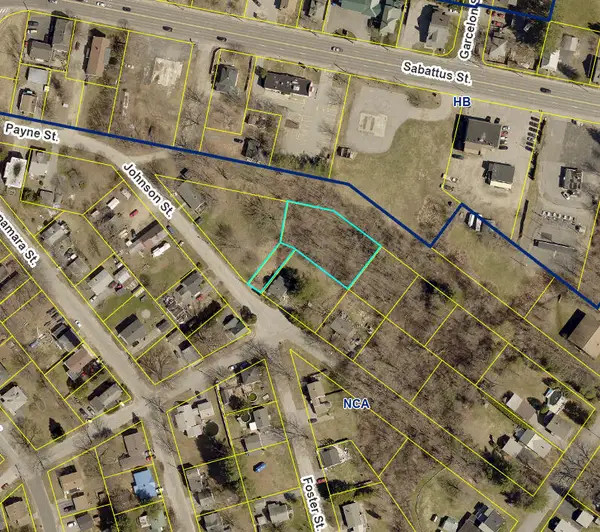 $24,900Active0.42 Acres
12 Johnson Street, Lewiston, ME 04240
MLS# 1656990Listed by: KELLER WILLIAMS REALTY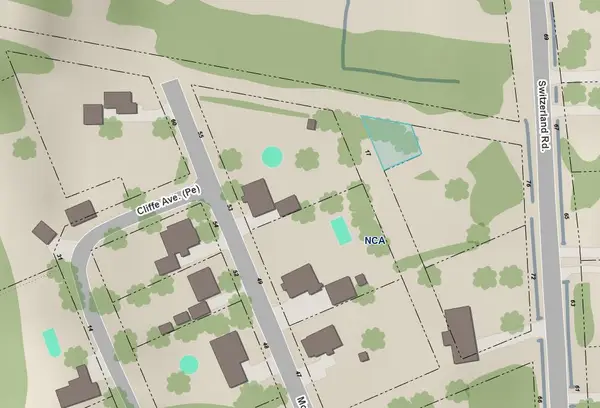 $700Active0.06 Acres
17 White Avenue, Lewiston, ME 04240
MLS# 1656992Listed by: KELLER WILLIAMS REALTY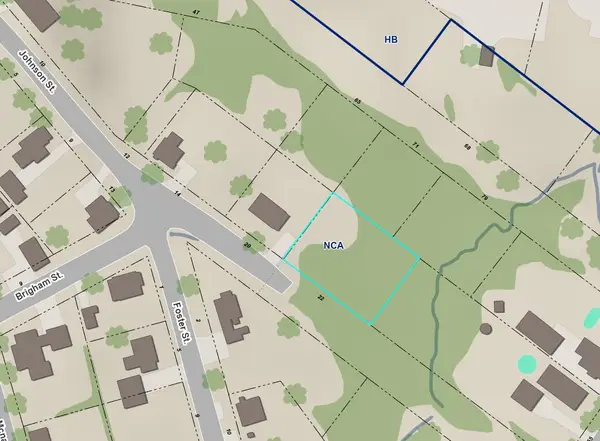 $2,499Active0.32 Acres
22 Johnson Street, Lewiston, ME 04240
MLS# 1656993Listed by: KELLER WILLIAMS REALTY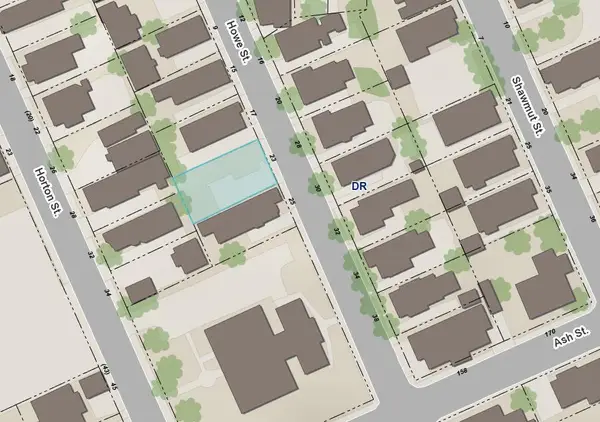 $29,900Active0.11 Acres
23 Howe Street, Lewiston, ME 04240
MLS# 1656994Listed by: KELLER WILLIAMS REALTY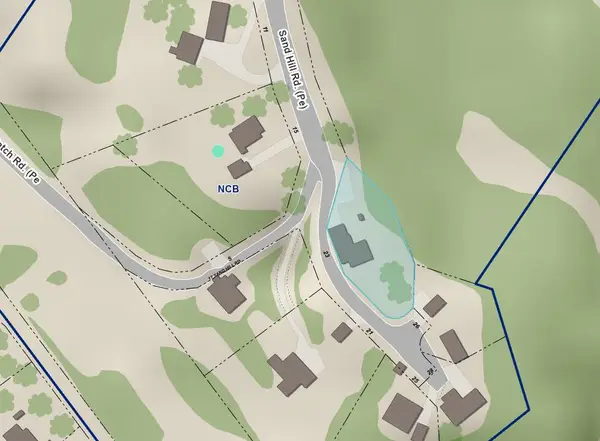 $16,800Active0.25 Acres
23 Sand Hill, Lewiston, ME 04240
MLS# 1656996Listed by: KELLER WILLIAMS REALTY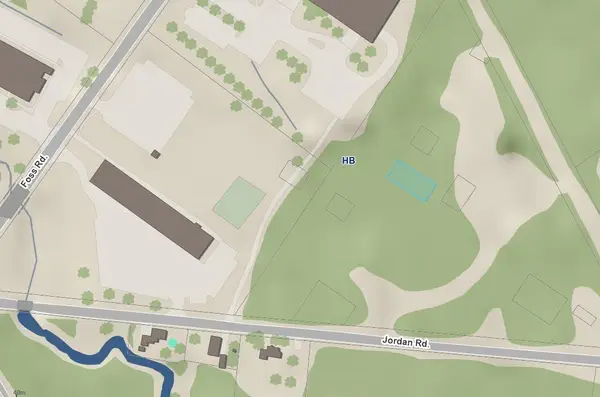 $1,000Active0.13 Acres
35 Beechwood Avenue, Lewiston, ME 04240
MLS# 1656997Listed by: KELLER WILLIAMS REALTY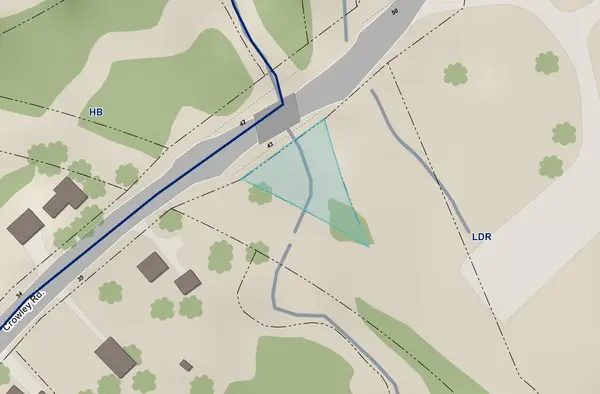 $1,600Active0.29 Acres
43 Crowley Road, Lewiston, ME 04240
MLS# 1656998Listed by: KELLER WILLIAMS REALTY $10,600Active0.06 Acres
67 Oak Street, Lewiston, ME 04240
MLS# 1656999Listed by: KELLER WILLIAMS REALTY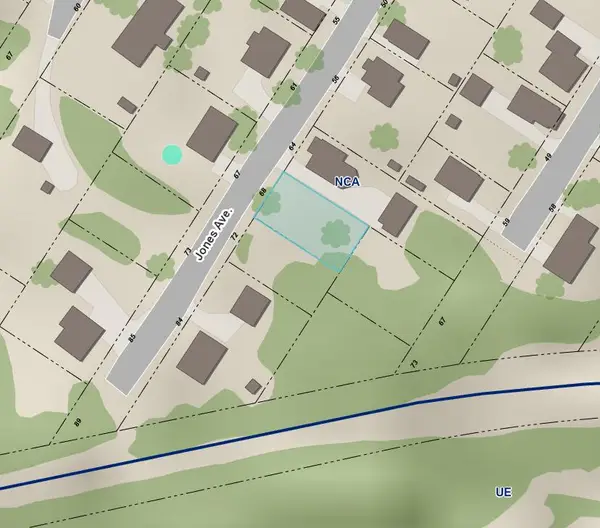 $24,900Active0.12 Acres
68 Jones Avenue, Lewiston, ME 04240
MLS# 1657000Listed by: KELLER WILLIAMS REALTY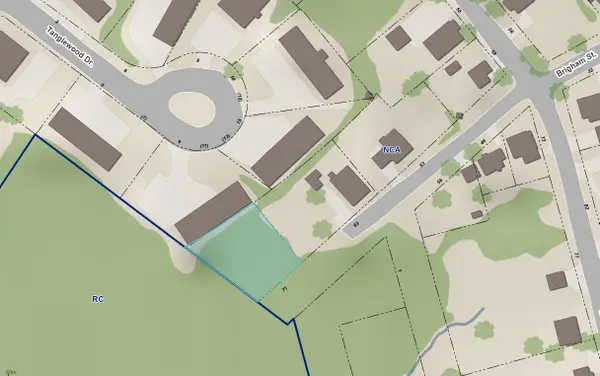 $1,900Active0.23 Acres
71 Brigham Street, Lewiston, ME 04240
MLS# 1657001Listed by: KELLER WILLIAMS REALTY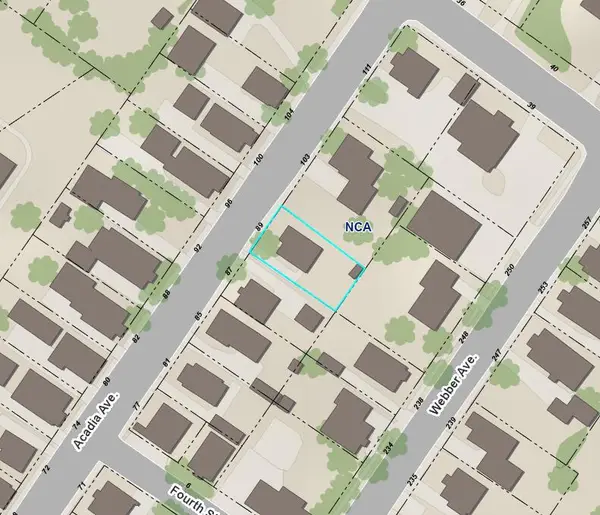 $39,900Active0.11 Acres
89 Acadia Avenue, Lewiston, ME 04240
MLS# 1657002Listed by: KELLER WILLIAMS REALTY $39,900Active0.13 Acres
97 Sabattus Street, Lewiston, ME 04240
MLS# 1657003Listed by: KELLER WILLIAMS REALTY $29,900Active0.11 Acres
159 Pine Street, Lewiston, ME 04240
MLS# 1657004Listed by: KELLER WILLIAMS REALTY $235,000Pending2 beds 2 baths1,008 sq. ft.
47 Stevens Street, Lewiston, ME 04240
MLS# 1656950Listed by: KELLER WILLIAMS REALTY $385,000Pending3 beds 2 baths1,764 sq. ft.
11 Kensington Terrace, Lewiston, ME 04240
MLS# 1656866Listed by: HOME AT LAST REALTY $429,000Active-- beds 3 baths2,487 sq. ft.
89 Walnut Street, Lewiston, ME 04240
MLS# 1656859Listed by: EXP REALTY $299,000Pending3 beds 1 baths1,453 sq. ft.
75 Summit Avenue, Lewiston, ME 04240
MLS# 1656846Listed by: PORTSIDE REAL ESTATE GROUP $455,000Pending5 beds 2 baths2,443 sq. ft.
23 Googin Street, Lewiston, ME 04240
MLS# 1656710Listed by: HOME AT LAST REALTY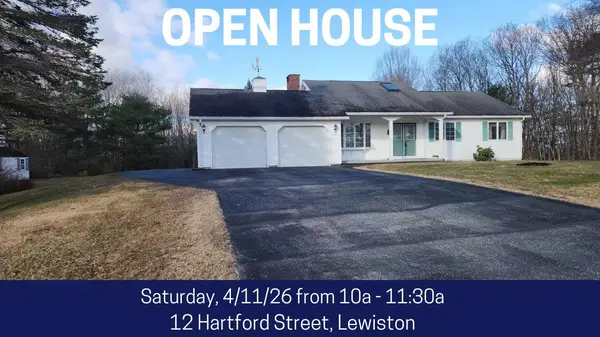 $399,900Pending2 beds 2 baths1,507 sq. ft.
12 Hartford Street, Lewiston, ME 04240
MLS# 1656623Listed by: FONTAINE FAMILY-THE REAL ESTATE LEADER $349,900Pending3 beds 2 baths1,944 sq. ft.
25 Lemay Avenue, Lewiston, ME 04240
MLS# 1656366Listed by: ANDROVISE REALTY $110,000Active2 beds 2 baths1,120 sq. ft.
25 Sarah Avenue, Lewiston, ME 04240
MLS# 1656263Listed by: FONTAINE FAMILY-THE REAL ESTATE LEADER $349,000Active3 beds 2 baths1,682 sq. ft.
24 Highland Avenue, Lewiston, ME 04240
MLS# 1656247Listed by: KELLER WILLIAMS REALTY $88,500Pending2 beds 2 baths822 sq. ft.
40 Oxbow Drive, Lewiston, ME 04240
MLS# 1656230Listed by: FONTAINE FAMILY-THE REAL ESTATE LEADER $175,000Pending27.61 Acres
51 Sleeper Road, Lewiston, ME 04240
MLS# 1656198Listed by: HEARTH & KEY REALTY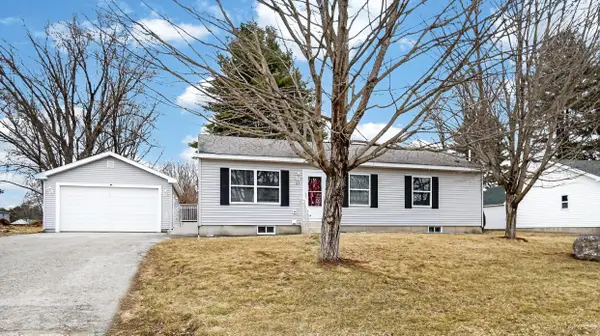 $345,000Pending3 beds 2 baths1,056 sq. ft.
63 Jean Street, Lewiston, ME 04240
MLS# 1656206Listed by: LANDING REAL ESTATE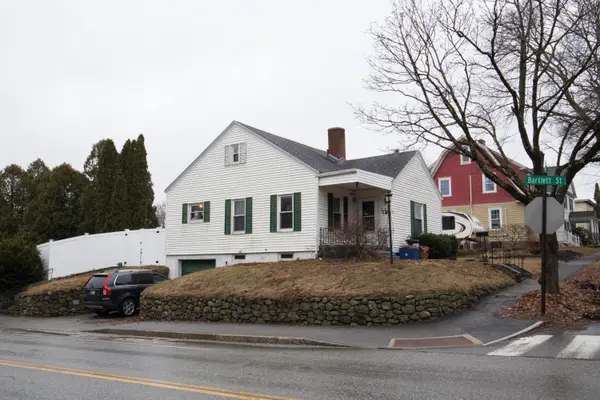 $269,900Pending2 beds 1 baths907 sq. ft.
97 Androscoggin Avenue, Lewiston, ME 04240
MLS# 1656166Listed by: PLOWMAN REALTY GROUP $550,000Pending-- beds 4 baths3,220 sq. ft.
53 Nichols Street, Lewiston, ME 04240
MLS# 1655806Listed by: PORTSIDE REAL ESTATE GROUP $334,900Pending2 beds 2 baths1,707 sq. ft.
11 Lucille Avenue, Lewiston, ME 04240
MLS# 1655549Listed by: BETTER HOMES & GARDENS REAL ESTATE/THE MASIELLO GROUP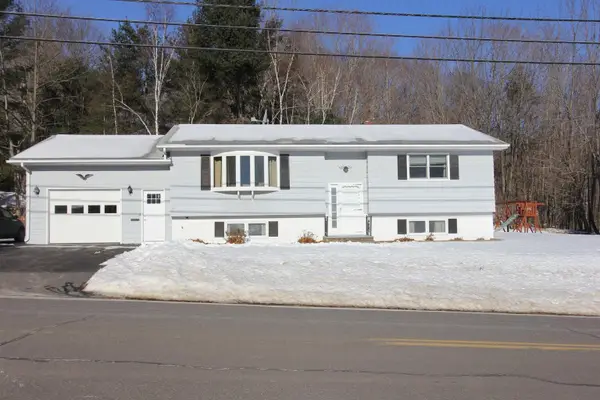 $299,900Pending3 beds 2 baths1,780 sq. ft.
184 Old Greene Road, Lewiston, ME 04240
MLS# 1655535Listed by: RE/MAX RIVERSIDE $350,000Pending3 beds 1 baths1,440 sq. ft.
15 Mitchell Street, Lewiston, ME 04240
MLS# 1655510Listed by: TIM DUNHAM REALTY $200,000Pending-- beds 2 baths1,564 sq. ft.
34 Pettingill Street, Lewiston, ME 04240
MLS# 1655443Listed by: FONTAINE FAMILY-THE REAL ESTATE LEADER $669,900Pending-- beds 6 baths6,240 sq. ft.
12-14 College Street, Lewiston, ME 04240
MLS# 1655365Listed by: EXP REALTY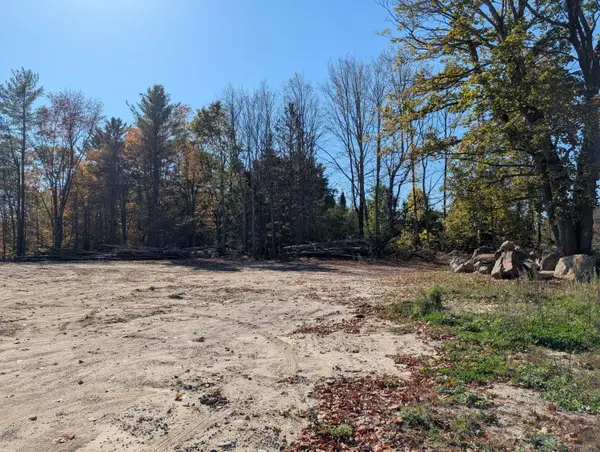 $130,000Active3.84 Acres
1639 Main Street, Lewiston, ME 04240
MLS# 1655221Listed by: KELLER WILLIAMS REALTY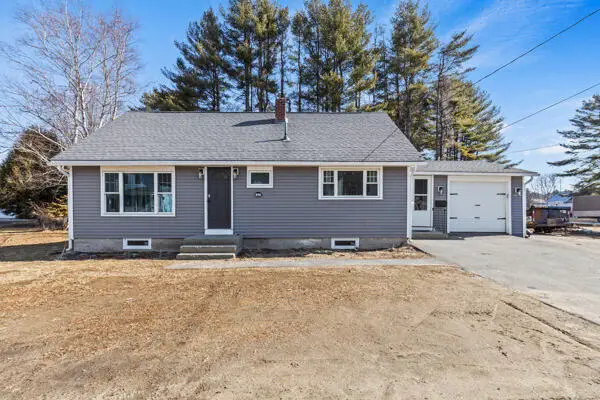 $310,000Pending3 beds 2 baths1,364 sq. ft.
32 Grove Street, Lewiston, ME 04240
MLS# 1655189Listed by: MESERVIER & ASSOCIATES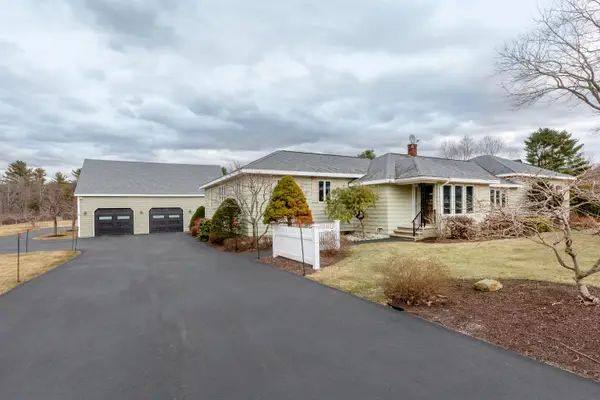 $699,900Active3 beds 2 baths3,585 sq. ft.
112 Old Lisbon Road, Lewiston, ME 04240
MLS# 1654334Listed by: BETTER HOMES & GARDENS REAL ESTATE/THE MASIELLO GROUP- Open Sat, 2 to 3:30pm
 $275,000Active3 beds 2 baths2,432 sq. ft.
14 Ledges Court #14, Lewiston, ME 04240
MLS# 1654324Listed by: REDFIN CORPORATION  $299,900Pending3 beds 1 baths960 sq. ft.
15 Roslin Avenue, Lewiston, ME 04240
MLS# 1654105Listed by: PORTSIDE REAL ESTATE GROUP $67,500Active2 beds 1 baths924 sq. ft.
10 Sarah Avenue, Lewiston, ME 04240
MLS# 1654059Listed by: FONTAINE FAMILY-THE REAL ESTATE LEADER $285,000Active-- beds 3 baths1,920 sq. ft.
291 Bates Street, Lewiston, ME 04240
MLS# 1654010Listed by: COTTAGE & CO REAL ESTATE $395,000Pending3 beds 2 baths1,840 sq. ft.
112 Gagne Street, Lewiston, ME 04240
MLS# 1653901Listed by: REDFIN CORPORATION $469,999Active-- beds 2 baths2,422 sq. ft.
675 Sabattus Street, Lewiston, ME 04240
MLS# 1653879Listed by: ELEVATE MAINE REALTY $224,995Active-- beds 1 baths4,037 sq. ft.
337 Lisbon Street, Lewiston, ME 04240
MLS# 1653628Listed by: ROCKSTAR REAL ESTATE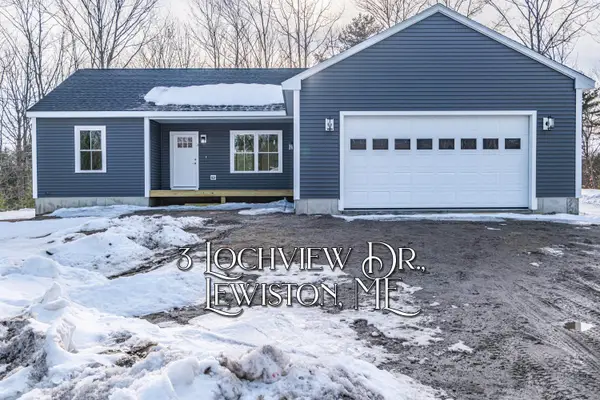 $539,999Active3 beds 2 baths1,400 sq. ft.
3 Lochview Drive, Lewiston, ME 04240
MLS# 1653510Listed by: CENTURY 21 ADVANTAGE $378,000Pending3 beds 1 baths2,200 sq. ft.
10 Butler Drive, Lewiston, ME 04240
MLS# 1653302Listed by: REALTY OF MAINE $365,000Pending3 beds 2 baths2,046 sq. ft.
400 Grove Street, Lewiston, ME 04240
MLS# 1652615Listed by: FONTAINE FAMILY-THE REAL ESTATE LEADER $299,999Pending4 beds 2 baths1,817 sq. ft.
58 Central Avenue, Lewiston, ME 04240
MLS# 1652492Listed by: DREAM HOME REALTY LLC $425,000Pending3 beds 3 baths1,936 sq. ft.
322 Webster Street, Lewiston, ME 04240
MLS# 1652433Listed by: LEGACY REALTY $299,000Active4 beds 1 baths1,381 sq. ft.
347 Sabattus Street, Lewiston, ME 04240
MLS# 1652338Listed by: REAL BROKER $399,900Active24.37 Acres
2 Melissa Drive, Lewiston, ME 04240
MLS# 1652066Listed by: CENTURY 21 ADVANTAGE $145,000Pending3 beds 2 baths1,232 sq. ft.
62 Village Drive, Lewiston, ME 04240
MLS# 1651996Listed by: HOME AT LAST REALTY $465,000Active-- beds 3 baths4,086 sq. ft.
61 Shawmut Street, Lewiston, ME 04240
MLS# 1651600Listed by: KELLER WILLIAMS REALTY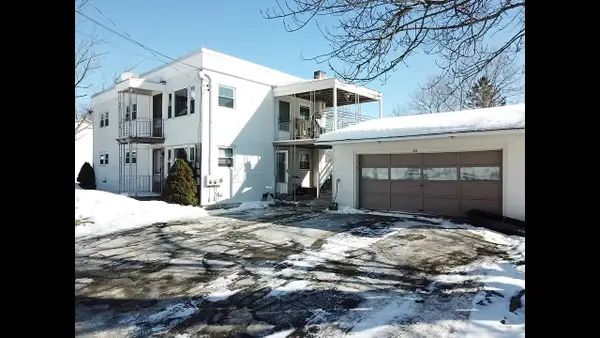 $425,000Pending-- beds 3 baths2,520 sq. ft.
43 Eustis Street, Lewiston, ME 04240
MLS# 1651572Listed by: HOMESMART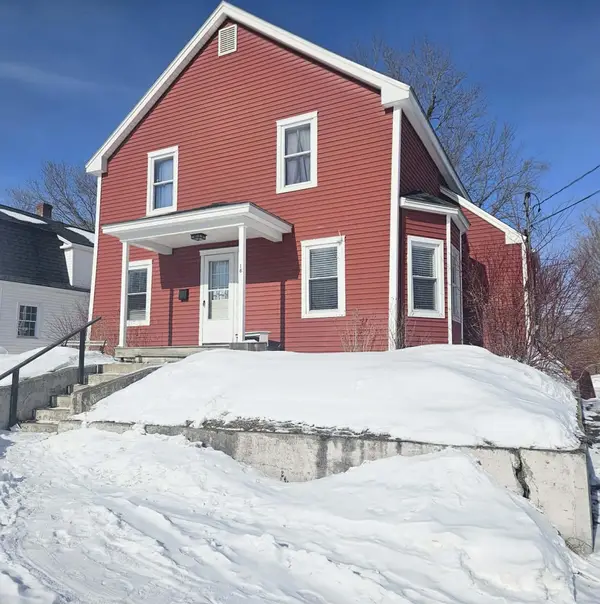 $275,000Pending3 beds 1 baths1,400 sq. ft.
18 King Avenue, Lewiston, ME 04240
MLS# 1651438Listed by: THE MAINE REAL ESTATE EXPERIENCE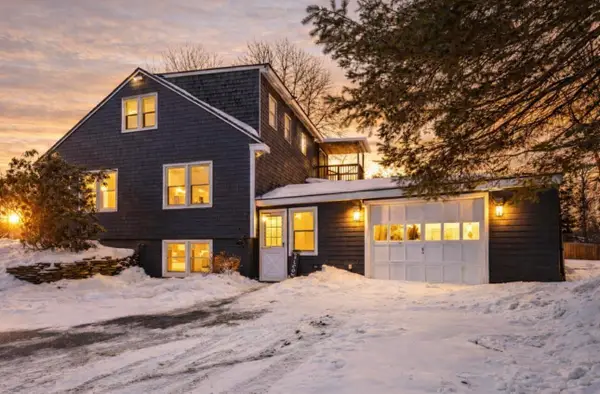 $379,000Pending4 beds 3 baths2,522 sq. ft.
212 Montello Street, Lewiston, ME 04240
MLS# 1651419Listed by: THE MAINE REAL ESTATE EXPERIENCE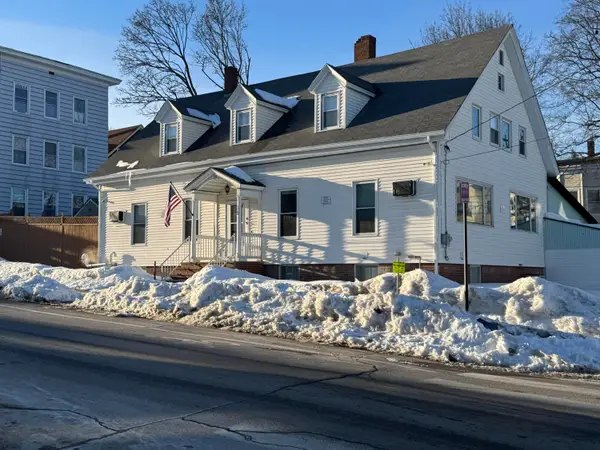 $349,900Pending5 beds 3 baths3,365 sq. ft.
170 Ash Street, Lewiston, ME 04240
MLS# 1651304Listed by: BETTER HOMES & GARDENS REAL ESTATE/THE MASIELLO GROUP $420,000Pending3 beds 3 baths2,016 sq. ft.
9 Jill Street, Lewiston, ME 04240
MLS# 1651136Listed by: OBERG INSURANCE & REAL ESTATE AGENCY, INC. $575,000Pending-- beds 6 baths7,560 sq. ft.
47-49 Pierce Street, Lewiston, ME 04240
MLS# 1652671Listed by: ELEVATE MAINE REALTY $209,900Pending3 beds 2 baths1,877 sq. ft.
170 Holland Street, Lewiston, ME 04240
MLS# 1650367Listed by: TOWNSEND REAL ESTATE $635,000Active5 beds 4 baths3,652 sq. ft.
141 Bradbury Road, Lewiston, ME 04240
MLS# 1649458Listed by: FONTAINE FAMILY-THE REAL ESTATE LEADER $149,000Active3 beds 2 baths1,456 sq. ft.
8 Sheldon Place, Lewiston, ME 04240
MLS# 1648752Listed by: FONTAINE FAMILY-THE REAL ESTATE LEADER $389,000Pending3 beds 2 baths1,232 sq. ft.
15 Car-ty Court, Lewiston, ME 04240
MLS# 1647378Listed by: THE DOT FERNALD TEAM, INC. $289,000Active-- beds 2 baths2,512 sq. ft.
15 Howe Street, Lewiston, ME 04240
MLS# 1646547Listed by: MAINE REAL ESTATE PROS $660,000Active-- beds 4 baths4,417 sq. ft.
279 Pine Street, Lewiston, ME 04240
MLS# 1645736Listed by: REAL BROKER $179,999Pending4 beds 2 baths1,307 sq. ft.
8 Howe Street, Lewiston, ME 04240
MLS# 1644300Listed by: FONTAINE FAMILY-THE REAL ESTATE LEADER $525,000Active-- beds 5 baths3,478 sq. ft.
227 Blake Street, Lewiston, ME 04240
MLS# 1643853Listed by: REAL BROKER $129,900Active3 beds 2 baths1,620 sq. ft.
65 Oxbow Drive, Lewiston, ME 04240
MLS# 1643737Listed by: BETTER HOMES & GARDENS REAL ESTATE/THE MASIELLO GROUP $565,000Pending4 beds 3 baths2,776 sq. ft.
13 Sheffield Avenue, Lewiston, ME 04240
MLS# 1653648Listed by: RED DOOR REALTY $389,900Pending2 beds 2 baths1,232 sq. ft.
12 Hartford Street, Lewiston, ME 04240
MLS# 1642163Listed by: FONTAINE FAMILY-THE REAL ESTATE LEADER $219,000Pending3 beds 1 baths960 sq. ft.
189 Grove Street, Lewiston, ME 04240
MLS# 1641921Listed by: KELLER WILLIAMS REALTY $360,000Pending2 beds 2 baths1,942 sq. ft.
49 Rachel Boulevard, Lewiston, ME 04240
MLS# 1641707Listed by: FONTAINE FAMILY-THE REAL ESTATE LEADER $475,000Active3 beds 2 baths1,400 sq. ft.
Lot #2 Chase Lane, Lewiston, ME 04240
MLS# 1640717Listed by: HOME AT LAST REALTY $475,000Active3 beds 2 baths1,400 sq. ft.
Lot #5 Chase Lane, Lewiston, ME 04240
MLS# 1640710Listed by: HOME AT LAST REALTY $475,000Active3 beds 2 baths1,400 sq. ft.
Lot #3 Chase Lane, Lewiston, ME 04240
MLS# 1640703Listed by: HOME AT LAST REALTY $475,000Active3 beds 2 baths1,400 sq. ft.
Lot #4 Chase Lane, Lewiston, ME 04240
MLS# 1640707Listed by: HOME AT LAST REALTY $475,000Pending-- beds 6 baths4,630 sq. ft.
92 Pine Street, Lewiston, ME 04240
MLS# 1640233Listed by: THE FLAHERTY GROUP $325,000Pending-- beds 3 baths2,593 sq. ft.
55 Howard Street, Lewiston, ME 04240
MLS# 1640180Listed by: THE FLAHERTY GROUP $470,000Active-- beds 3 baths3,486 sq. ft.
174 Bartlett Street, Lewiston, ME 04240
MLS# 1638454Listed by: KELLER WILLIAMS REALTY $215,000Active2 beds 1 baths1,152 sq. ft.
947 Sabattus Street, Lewiston, ME 04240
MLS# 1651444Listed by: FONTAINE FAMILY-THE REAL ESTATE LEADER $525,000Pending-- beds 6 baths6,936 sq. ft.
100 Blake Street, Lewiston, ME 04240
MLS# 1633697Listed by: EXP REALTY $460,000Active-- beds 2 baths3,726 sq. ft.
476 Main Street, Lewiston, ME 04240
MLS# 1633343Listed by: BREAKWATER REALTY GROUP, LLC $460,000Active5 beds 2 baths3,726 sq. ft.
476 Main Street, Lewiston, ME 04240
MLS# 1630932Listed by: BREAKWATER REALTY GROUP, LLC $65,000Active0.68 Acres
1944 Lisbon Road, Lewiston, ME 04240
MLS# 1630869Listed by: FONTAINE FAMILY-THE REAL ESTATE LEADER $659,000Pending4 beds 4 baths4,002 sq. ft.
25 Amos Court, Lewiston, ME 04240
MLS# 1630749Listed by: MAINE REAL ESTATE EXPERTS $519,999Pending3 beds 2 baths1,400 sq. ft.
4 Lochview Drive, Lewiston, ME 04240
MLS# 1624253Listed by: CENTURY 21 ADVANTAGE $289,000Active1 beds 2 baths1,926 sq. ft.
49 Lisbon Street #3B, Lewiston, ME 04240
MLS# 1622414Listed by: SIGNATURE HOMES REAL ESTATE GROUP, LLC $110,000Pending3 beds 2 baths1,404 sq. ft.
16 Sarah Avenue, Lewiston, ME 04240
MLS# 1619628Listed by: DRAKES REAL ESTATE LLC $2,700,000Active6.88 Acres
10, 35, 37 Avon Street, Lewiston, ME 04240
MLS# 4986915Listed by: KELLER WILLIAMS REALTY-METROPOLITAN $749,900Pending70 Acres
55 Old Lisbon Road, Lewiston, ME 04240
MLS# 1593862Listed by: KELLER WILLIAMS REALTY $200,000Active6.1 Acres
444 Pleasant Street, Lewiston, ME 04240
MLS# 1568137Listed by: MALONE COMMERCIAL BROKERS, INC.
Local realty services provided by:CENTURY 21 Barbara Patterson, CENTURY 21 Farm & Forest
MREIS Multiple Listing Service™ systemListing data is derived in whole or in part from the Maine IDX & is for consumers' personal, noncommercial use only. Dimensions are approximate and not guaranteed. All data should be independently verified. © 2026 Maine Real Estate Information System, Inc. All Rights Reserved
Copyright 2026 Prime MLS, Inc. All rights reserved. This information is deemed reliable, but not guaranteed. The data relating to real estate displayed on this Site comes in part from the IDX Program of Prime MLS. The information being provided is for consumers’ personal, noncommercial use and may not be used for any purpose other than to identify prospective properties consumers may be interested in purchasing. Data last updated May 8, 2026
Neighborhoods near Lewiston, ME
Zip codes near Lewiston, ME
- 04069 homes for sale
- 04086 homes for sale
- 04210 homes for sale
- 04222 homes for sale
- 04230 homes for sale
- 04236 homes for sale
- 04240 homes for sale
- 04250 homes for sale
- 04252 homes for sale
- 04256 homes for sale
- 04258 homes for sale
- 04259 homes for sale
- 04260 homes for sale
- 04263 homes for sale
- 04265 homes for sale
- 04274 homes for sale
- 04280 homes for sale
- 04282 homes for sale
- 04287 homes for sale
- 04350 homes for sale
Popular searches near Lewiston, ME
- Auburn homes for sale
- Bowdoin homes for sale
- Durham homes for sale
- Greene homes for sale
- Greene town homes for sale
- Lisbon homes for sale
- Lisbon town homes for sale
- Lisbon Falls homes for sale
- Litchfield homes for sale
- Mechanic Falls homes for sale
- Minot homes for sale
- Monmouth homes for sale
- New Gloucester homes for sale
- Poland homes for sale
- Pownal homes for sale
- Sabattus town homes for sale
- Sabattus homes for sale
- Topsham town homes for sale
- Turner town homes for sale
- Turner homes for sale
Protect your home and budget from life's surprises with an Assurant Home Warranty, backed by a partner that supports you through every step of homeownership. Explore Plans.
©2026 Century 21 Real Estate LLC. All rights reserved. CENTURY 21®, the CENTURY 21 Logo and C21® are service marks owned by Century 21 Real Estate LLC. Century 21 Real Estate LLC fully supports the principles of the Fair Housing Act and the Equal Opportunity Act. Each office is independently owned and operated. Listing information is deemed reliable but not guaranteed accurate.