- Adams Boulevard, Saginaw homes for sale
- Banks, Bay City homes for sale
- Butman, Saginaw homes for sale
- Cathedral District, Saginaw homes for sale
- Center Avenue, Bay City homes for sale
- Columbus Avenue, Bay City homes for sale
- Covenant, Saginaw homes for sale
- Fairground, Saginaw homes for sale
- Heritage Square, Saginaw homes for sale
- Houghton Jones, Saginaw homes for sale
- Johnson Street, Bay City homes for sale
- Midland Street, Bay City homes for sale
- Northeast Saginaw, Saginaw homes for sale
- Northmoor, Saginaw homes for sale
- Northwest, Saginaw homes for sale
- St. Stephen's Brockway - Carman, Saginaw homes for sale
- South East Side, Saginaw homes for sale
- South End, Bay City homes for sale
- Southwest, Bay City homes for sale
- Southwest, Saginaw homes for sale
Lincoln, MI - homes for sale
2 of 2 results displayed
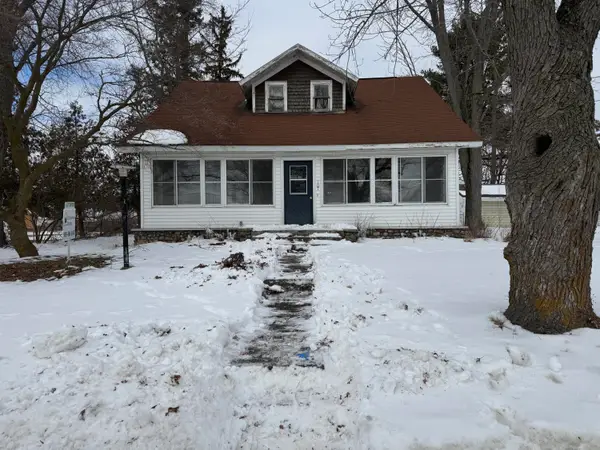 $86,000Active3 beds 1 baths1,723 sq. ft.
107 E Main Street, Lincoln, MI 48742
MLS# 201838750Listed by: FITZPATRICK REALTY LLC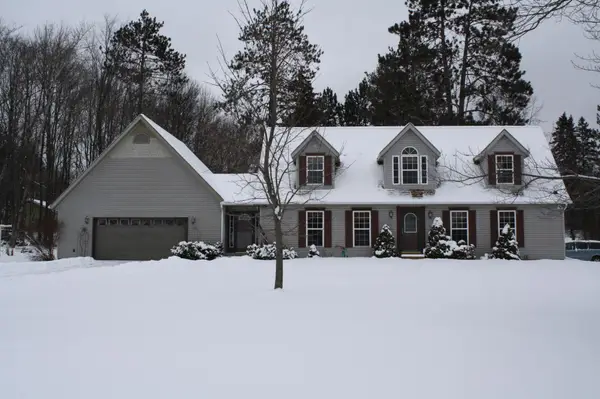 $329,900Active3 beds 2 baths3,504 sq. ft.
1288 N Sleeper Drive, Lincoln, MI 48742
MLS# 201838526Listed by: REAL ESTATE ONE OF ALPENA
Local realty services provided by:CENTURY 21 Northland
All information deemed reliable but not guaranteed and should be
independently verified. All properties are subject to prior sale, change
or withdrawal. Neither the listing broker(s) nor Water Wonderland Mls, Inc. shall be
responsible for any typographical errors, misinformation, misprints,
and shall be held totally harmless. Water Wonderland MLS, Inc © 2026 All
rights reserved
Neighborhoods near Lincoln, MI
Zip codes near Lincoln, MI
- 48621 homes for sale
- 48705 homes for sale
- 48721 homes for sale
- 48728 homes for sale
- 48730 homes for sale
- 48737 homes for sale
- 48738 homes for sale
- 48739 homes for sale
- 48740 homes for sale
- 48742 homes for sale
- 48745 homes for sale
- 48748 homes for sale
- 48750 homes for sale
- 48761 homes for sale
- 48762 homes for sale
- 49707 homes for sale
- 49744 homes for sale
- 49747 homes for sale
- 49753 homes for sale
- 49766 homes for sale
Popular searches near Lincoln, MI
- Alcona homes for sale
- Au Sable homes for sale
- Barton City homes for sale
- Caledonia homes for sale
- Curtis homes for sale
- Glennie homes for sale
- Greenbush homes for sale
- Harrisville Township homes for sale
- Harrisville homes for sale
- Hawes homes for sale
- Haynes homes for sale
- Hubbard Lake homes for sale
- Lost Lake Woods homes for sale
- Mikado Township homes for sale
- Mikado homes for sale
- Oscoda charter township homes for sale
- Oscoda homes for sale
- Ossineke homes for sale
- Ossineke Township homes for sale
- Spruce homes for sale
Protect your home and budget from life's surprises with an Assurant Home Warranty, backed by a partner that supports you through every step of homeownership. Explore Plans.
©2026 Century 21 Real Estate LLC. All rights reserved. CENTURY 21®, the CENTURY 21 Logo and C21® are service marks owned by Century 21 Real Estate LLC. Century 21 Real Estate LLC fully supports the principles of the Fair Housing Act and the Equal Opportunity Act. Each office is independently owned and operated. Listing information is deemed reliable but not guaranteed accurate.