- Bayhill, San Bruno homes for sale
- Crestmoor, San Bruno homes for sale
- Downtown San Bruno, San Bruno homes for sale
- Edgemar, Pacifica homes for sale
- Fairmont, Pacifica homes for sale
- Fairway Park, Pacifica homes for sale
- Glenview Highlands, Millbrae homes for sale
- Green Hills, Millbrae homes for sale
- Huntington Park, San Bruno homes for sale
- Lomita Hills, Millbrae homes for sale
- Lomita Park, San Bruno homes for sale
- Mills Park, San Bruno homes for sale
- Monte Verde, San Bruno homes for sale
- Pacific Heights, San Bruno homes for sale
- Park Pacifica, Pacifica homes for sale
- Pedro Valley, Pacifica homes for sale
- Rockaway Beach, Pacifica homes for sale
- Rollingwood, San Bruno homes for sale
- Sharp Park, Pacifica homes for sale
- Westborough, South San Francisco homes for sale
Linda Mar Valley, Pacifica, CA - homes for sale
15 of 15 results displayed
- New
 $1,488,000Active5 beds 3 baths1,490 sq. ft.
2 Celia Court, Pacifica, CA 94044
MLS# ML82039878Listed by: COMPASS - Open Sat, 1 to 4pmNew
 $1,175,000Active3 beds 3 baths1,649 sq. ft.
1135 Valencia Way, Pacifica, CA 94044
MLS# ML82039649Listed by: LUXURIANT REALTY  $1,399,000Pending3 beds 1 baths1,040 sq. ft.
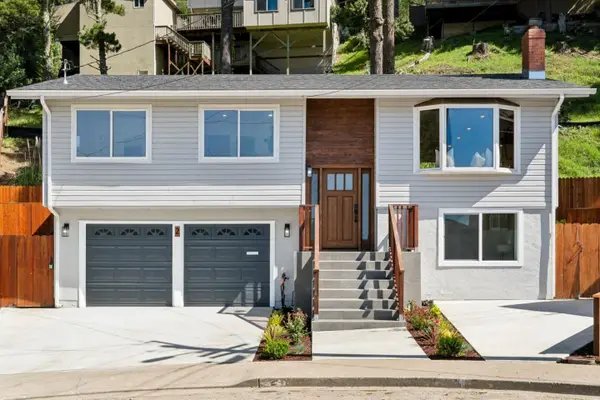
943 Anza Drive, Pacifica, CA 94044
MLS# 426110654Listed by: RE/MAX GOLD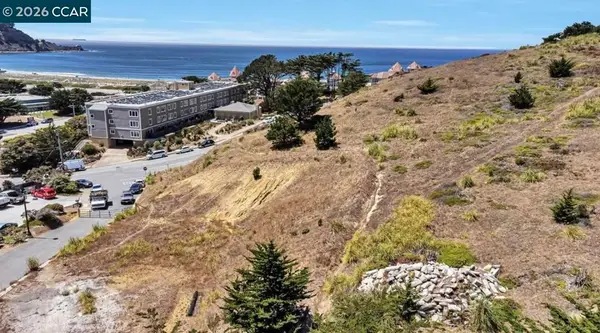 $2,500,000Active2.13 Acres
670 Roberts Rd, Pacifica, CA 94044
MLS# 41125928Listed by: CENTURY MEDALLION OF LOS GATOS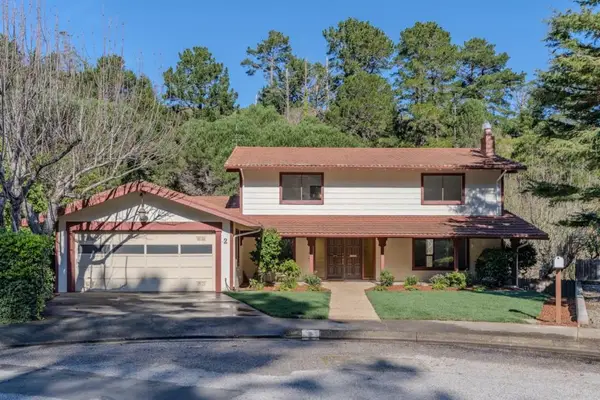 $2,195,000Pending4 beds 3 baths2,660 sq. ft.
2 Valleywood Court, Pacifica, CA 94044
MLS# ML82033615Listed by: ECCLESTON INCORPORATED $1,150,000Active3 beds 1 baths1,040 sq. ft.
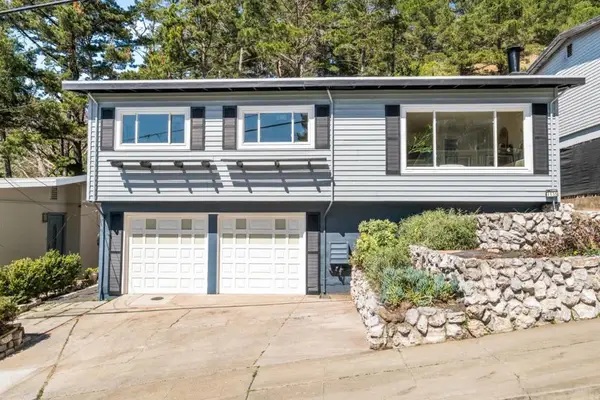
1184 Escalero Avenue, Pacifica, CA 94044
MLS# ML82035700Listed by: OMARSHALL, INC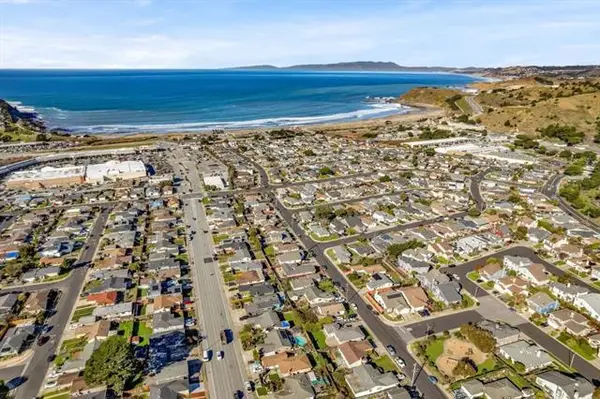 $1,099,888Active3 beds 1 baths1,040 sq. ft.
1559 Linda Mar Boulevard, Pacifica, CA 94044
MLS# ML82035618Listed by: COMPASS $1,749,000Pending4 beds 3 baths2,360 sq. ft.
229 Marvilla Circle, Pacifica, CA 94044
MLS# ML82028894Listed by: CHRISTIE'S INTERNATIONAL REAL ESTATE SERENO $1,399,900Pending4 beds 2 baths1,530 sq. ft.
1155 Crespi Drive, Pacifica, CA 94044
MLS# 425065425Listed by: HOMESMART PV & ASSOCIATES $2,898,000Active5 beds 5 baths4,234 sq. ft.
1016 Escalero Avenue, Pacifica, CA 94044
MLS# ML82027723Listed by: COASTSIDE ASSOCIATES REAL ESTATE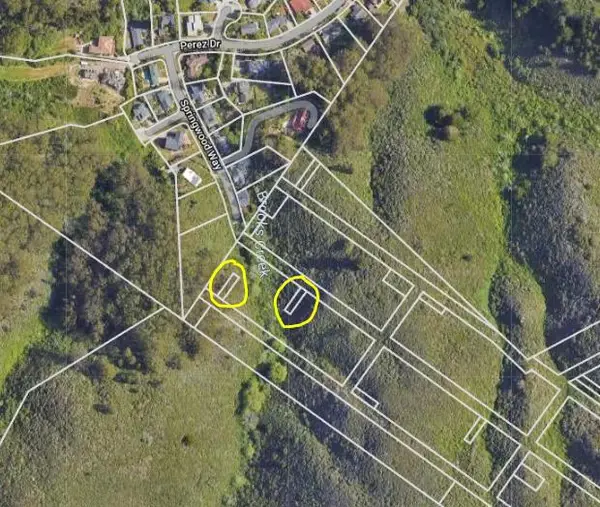 $19,999Active0.06 Acres
0 Balboa, Pacifica, CA 94044
MLS# ML82029532Listed by: RE/MAX GOLD REDWOOD SHORES.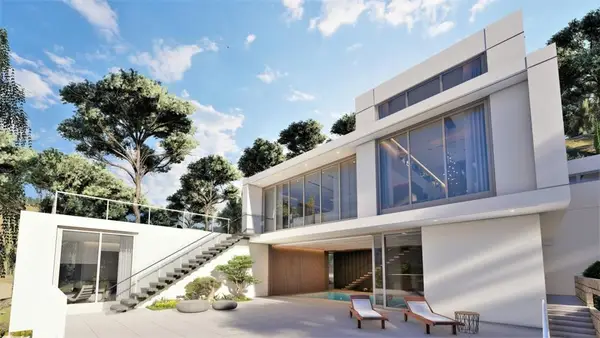 $6,995,000Active4 beds 6 baths4,098 sq. ft.
1695 Higgins Way, Pacifica, CA 94044
MLS# ML81966522Listed by: EXP REALTY OF NORTHERN CALIFORNIA, INC. $240,000Active0.35 Acres
0 000 Spruce Court, Pacifica, CA 94044
MLS# ML81963090Listed by: CHRISTIE'S INTERNATIONAL REAL ESTATE SERENO $1,398,000Active4 beds 2 baths1,680 sq. ft.
1452 Flores Drive, Pacifica, CA 94044
MLS# ML81924690Listed by: COLDWELL BANKER REALTY $2,000,000Active1.19 Acres
1 Ohlone Drive, Pacifica, CA 94044
MLS# 426105770Listed by: GOLDEN GATE SOTHEBY'S INTERNATIONAL REALTY
Local realty services provided by:CENTURY 21 Wildwood Properties, Inc., CENTURY 21 Discovery, CENTURY 21 Select Real Estate, Inc., CENTURY 21 Baldini Real Estate, Inc.
The information being provided by California Regional MLS (Southern California) is for the consumer's personal, non-commercial use and may not be used for any purpose other than to identify prospective properties consumer may be interested in purchasing. Any information relating to real estate for sale referenced on this web site comes from the Internet Data Exchange (IDX) program of the California Regional MLS (Southern California). CENTURY 21 Discovery is not a Multiple Listing Service (MLS), nor does it offer MLS access. This website is a service of CENTURY 21 Discovery, a broker participant of California Regional MLS (Southern California). This web site may reference real estate listing(s) held by a brokerage firm other than the broker and/or agent who owns this web site.
The accuracy of all information, regardless of source, including but not limited to open house information, square footages and lot sizes, is deemed reliable but not guaranteed and should be personally verified through personal inspection by and/or with the appropriate professionals. The data contained herein is copyrighted by California Regional MLS (Southern California) and is protected by all applicable copyright laws. Any unauthorized dissemination of this information is in violation of copyright laws and is strictly prohibited.
Copyright 2021 California Regional MLS (Southern California). All rights reserved.
MetroList MLS 2026. This information is being provided by MetroList MLS. All measurements and calculations of area are approximate. Information provided by Seller/Other sources, not verified by Broker. All interested persons should independently verify accuracy of information. Provided properties may or may not be listed by the office/agent presenting the information. Data Updated: March 26, 2026. Information being provided is for consumers' personal, non-commercial use and may not be used for any purpose other than to identify prospective properties consumers may be interested in purchasing. Information deemed reliable but not guaranteed. Any offer of compensation is made only to Participants of MLS where the subject listing is filed and in accordance with such MLS's regulations or rules.
The information being provided by San Francisco Association of REALTORS is for the consumer's personal, non-commercial use and may not be used for any purpose other than to identify prospective properties consumer may be interested in purchasing. Any information relating to real estate for sale referenced on this web site comes from the Internet Data Exchange (IDX) program of the San Francisco Association of REALTORS. This web site may reference real estate listing(s) held by a brokerage firm other than the broker and/or agent who owns this web site. The accuracy of all information, regardless of source, including but not limited to open house information, square footages and lot sizes, is deemed reliable but not guaranteed and should be personally verified through personal inspection by and/or with the appropriate professionals. The data contained herein is copyrighted by San Francisco Association of REALTORS and is protected by all applicable copyright laws. Any unauthorized dissemination of this information is in violation of copyright laws and is strictly prohibited.
Popular neighborhoods near Linda Mar Valley, Pacifica, CA
Zip codes near Linda Mar Valley, Pacifica, CA
- 94005 homes for sale
- 94010 homes for sale
- 94014 homes for sale
- 94015 homes for sale
- 94018 homes for sale
- 94019 homes for sale
- 94030 homes for sale
- 94037 homes for sale
- 94038 homes for sale
- 94044 homes for sale
- 94066 homes for sale
- 94080 homes for sale
- 94112 homes for sale
- 94116 homes for sale
- 94127 homes for sale
- 94132 homes for sale
- 94134 homes for sale
- 94401 homes for sale
- 94402 homes for sale
- 94403 homes for sale
Counties near Linda Mar Valley, Pacifica, CA
- Alameda County homes for sale
- Contra Costa County homes for sale
- Marin County homes for sale
- Napa County homes for sale
- Sacramento County homes for sale
- San Francisco County homes for sale
- San Joaquin County homes for sale
- San Mateo County homes for sale
- Santa Clara County homes for sale
- Santa Cruz County homes for sale
- Solano County homes for sale
- Sonoma County homes for sale
- Stanislaus County homes for sale
- Yolo County homes for sale
Protect your home and budget from life's surprises with an Assurant Home Warranty, backed by a partner that supports you through every step of homeownership. Explore Plans.
©2026 Century 21 Real Estate LLC. All rights reserved. CENTURY 21®, the CENTURY 21 Logo and C21® are service marks owned by Century 21 Real Estate LLC. Century 21 Real Estate LLC fully supports the principles of the Fair Housing Act and the Equal Opportunity Act. Each office is independently owned and operated. Listing information is deemed reliable but not guaranteed accurate.