- Alexander homes for sale
- Avilla homes for sale
- Banner homes for sale
- Bauxite homes for sale
- Big Rock homes for sale
- Bryant homes for sale
- Cammack Village homes for sale
- East End homes for sale
- Hill homes for sale
- Hurricane homes for sale
- Landmark homes for sale
- Little Rock homes for sale
- Mabelvale homes for sale
- Maumelle homes for sale
- McAlmont homes for sale
- Natural Steps homes for sale
- North Little Rock homes for sale
- Otter homes for sale
- Owen homes for sale
- Shannon Hills homes for sale
72204, AR - homes for sale
228 of 228 results displayed
- New
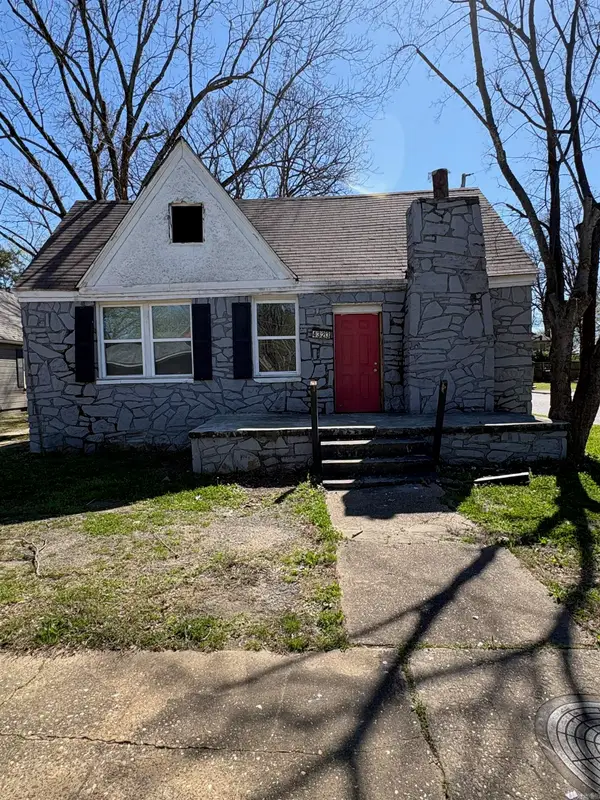
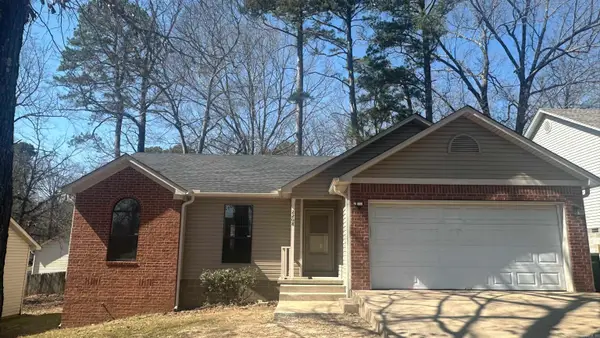
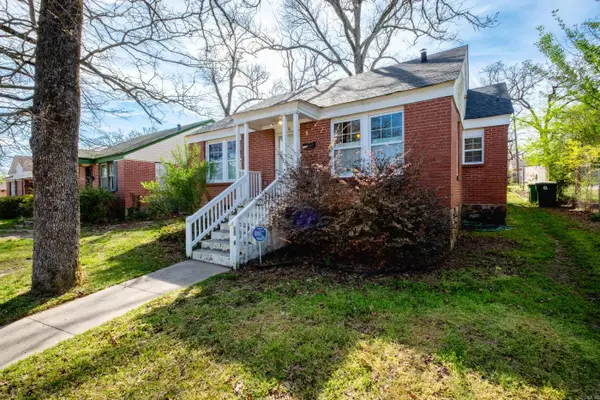 $160,000Active3 beds 2 baths1,212 sq. ft.
1516 S Harrison Street, Little Rock, AR 72204
MLS# 26011634Listed by: THE PROPERTY GROUP - New
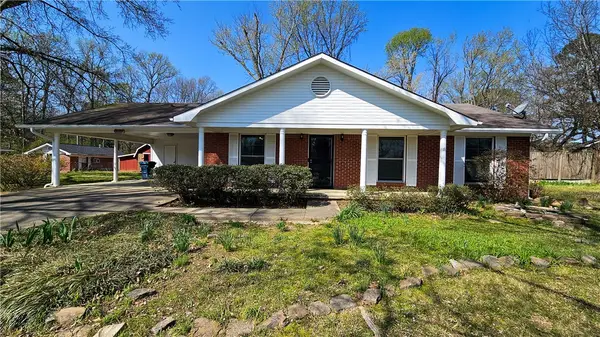 $172,000Active2 beds 2 baths1,228 sq. ft.
9727 Lanehart Road, Littlerock, AR 72204
MLS# 1340560Listed by: LIVE. LOVE. ARKANSAS - New
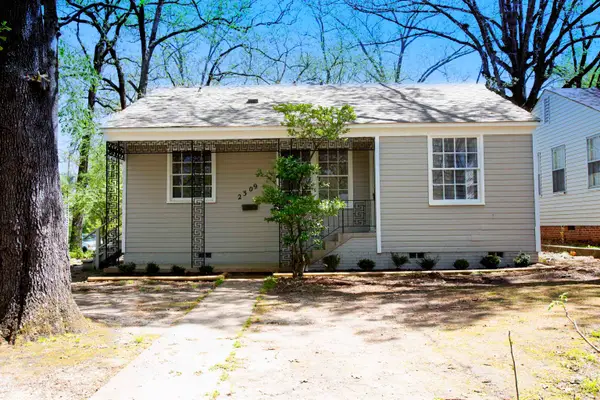 $119,000Active2 beds 1 baths1,005 sq. ft.
2309 S Tyler Street, Little Rock, AR 72204
MLS# 26011489Listed by: RIVER ROCK REALTY COMPANY - New
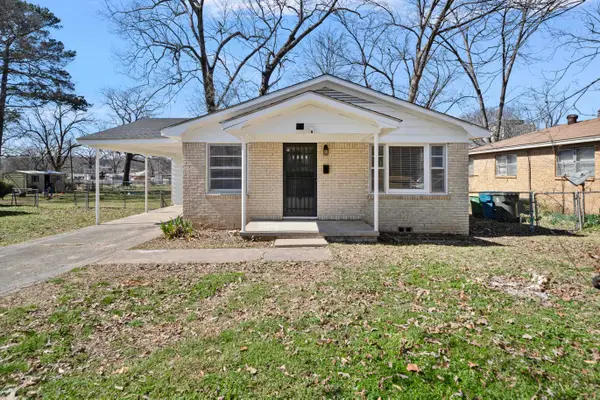
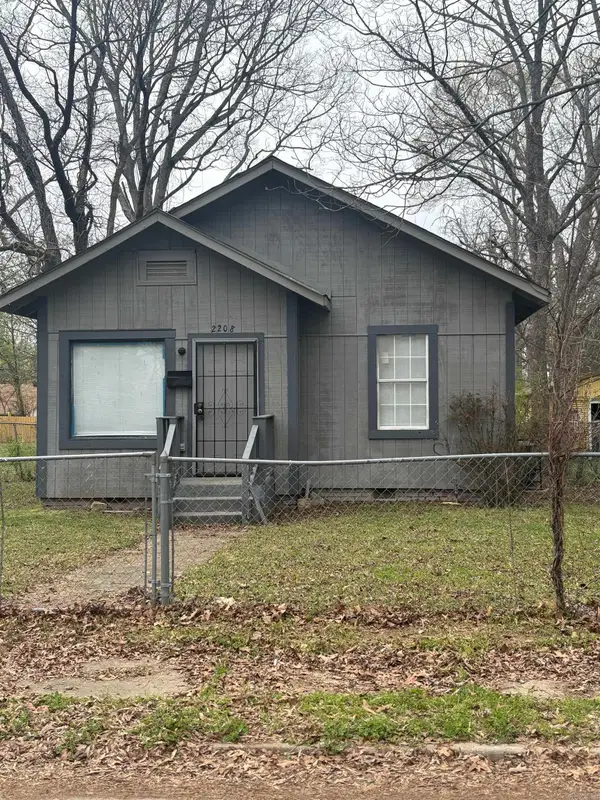 $60,000Active2 beds 1 baths940 sq. ft.
2208 S Valmar Street, Little Rock, AR 72204
MLS# 26011467Listed by: EDGE REALTY - New
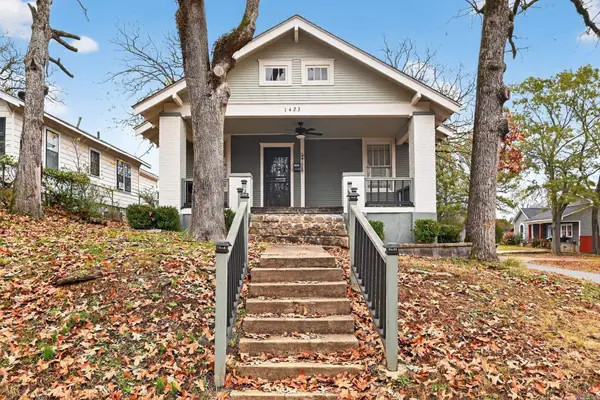 $123,000Active4 beds 1 baths1,372 sq. ft.
1423 Brown Street, Little Rock, AR 72204
MLS# 26011366Listed by: KELLER WILLIAMS REALTY - New
 $55,000Active3 beds 1 baths1,102 sq. ft.
Address Withheld By Seller, Little Rock, AR 72204
MLS# 26011233Listed by: HOME DESIGN AND REALTY L.L.C. - New
 $6,500Active0.15 Acres
3801 John Barrow Street, Little Rock, AR 72204
MLS# 26010904Listed by: RE/MAX AFFILIATES REALTY - New$6,500Active0.15 Acres
3805 John Barrow Road, Little Rock, AR 72204
MLS# 26010908Listed by: RE/MAX AFFILIATES REALTY - New
 $139,400Active3 beds 2 baths1,226 sq. ft.
57 Glenmere, Little Rock, AR 72204
MLS# 26010705Listed by: PRO REALTY, INC. - New
 $119,500Active2 beds 1 baths844 sq. ft.
Address Withheld By Seller, Little Rock, AR 72204
MLS# 26010360Listed by: TKP MANAGEMENT - New
 $144,900Active3 beds 2 baths1,172 sq. ft.
2619 Elkhart Dr, Little Rock, AR 72204
MLS# 26010343Listed by: LISTWITHFREEDOM.COM, INC.  $75,000Pending3 beds 2 baths1,415 sq. ft.
9711 Herndon, Little Rock, AR 72204
MLS# 26010054Listed by: LOTUS REALTY- New
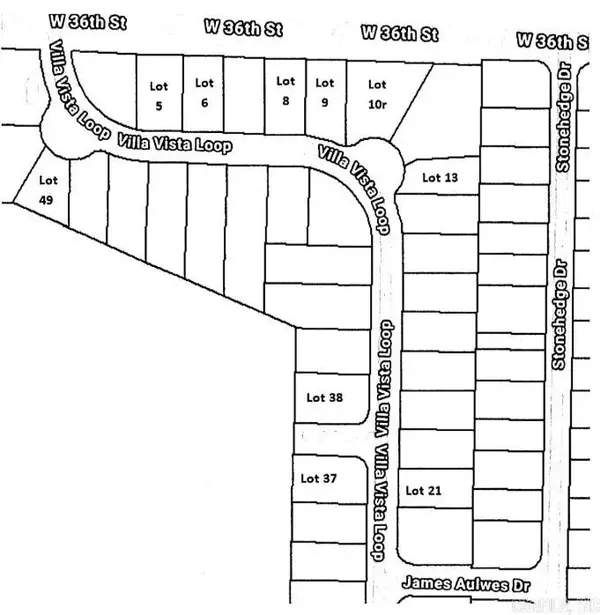 $150,000Active1.98 Acres
23 Villa Vista Loop, Little Rock, AR 72204
MLS# 26010037Listed by: REALTY BROKERS OF ARKANSAS - New
 $45,000Active3 beds 2 baths1,626 sq. ft.
4323 W 11th Street, Little Rock, AR 72204
MLS# 26010044Listed by: ULTRA PROPERTIES  $10,000Active0.3 Acres
Lots 3 and 4 Cobb St, Little Rock, AR 72204
MLS# 26009891Listed by: IREALTY ARKANSAS - SHERWOOD $132,500Active2 beds 1 baths980 sq. ft.
24 Bellemeade Dr, Little Rock, AR 72204
MLS# 26009781Listed by: MCGRAW REALTORS - BENTON $64,900Active2 beds 1 baths672 sq. ft.
Address Withheld By Seller, Little Rock, AR 72204
MLS# 26009710Listed by: TRELORA REALTY, INC.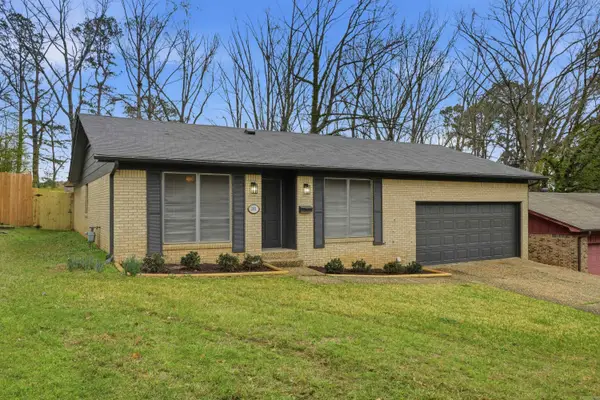 $215,000Active3 beds 2 baths1,662 sq. ft.
2301 Vancouver, Little Rock, AR 72204
MLS# 26009567Listed by: MCDANIEL & CO. REALTORS - HENSLEY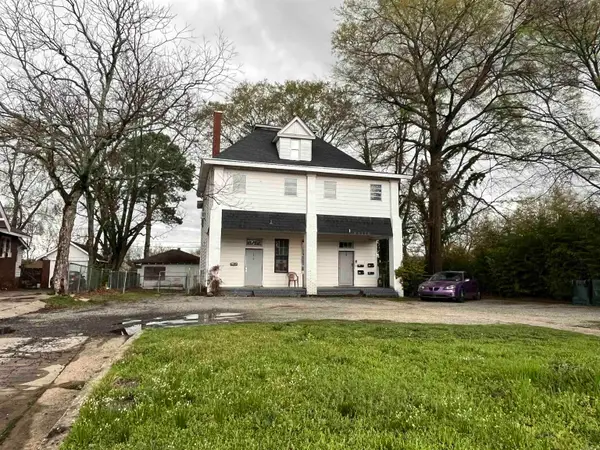 $319,000Active-- beds -- baths3,658 sq. ft.
3312 W 12th St Street, Little Rock, AR 72204
MLS# 26009522Listed by: BLUE INK REAL ESTATE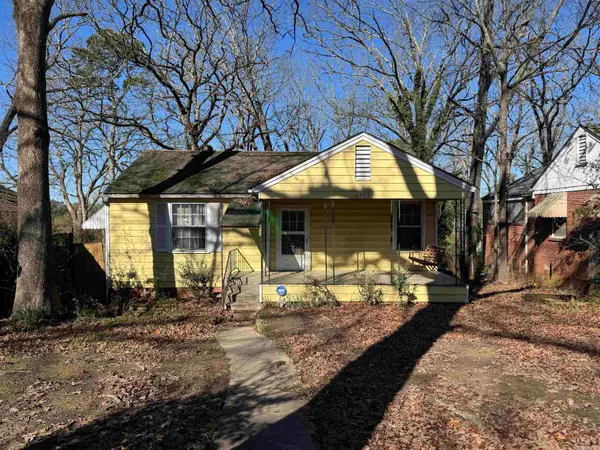 $85,000Active2 beds 1 baths816 sq. ft.
2506 S Taylor Street, Little Rock, AR 72204
MLS# 26009492Listed by: RIVER ROCK REALTY COMPANY $300,000Active4 beds 2 baths2,258 sq. ft.
19 Waters Edge Drive, Little Rock, AR 72204
MLS# 26009487Listed by: RACKLEY REALTY $73,000Active2 beds 1 baths1,086 sq. ft.
919 Lewis Street, Little Rock, AR 72204
MLS# 26009396Listed by: BROKERS GUILD REAL ESTATE $100,000Active2 beds 1 baths950 sq. ft.
27 Barbara Circle, Little Rock, AR 72204
MLS# 26009294Listed by: RIVER ROCK REALTY COMPANY $10,500Active0.14 Acres
3711 W 11th Street, Little Rock, AR 72204
MLS# 26009320Listed by: CAPITAL REAL ESTATE ADVISORS $159,000Active3 beds 2 baths1,106 sq. ft.
3215 Katherine Street, Little Rock, AR 72204
MLS# 26009243Listed by: KELLER WILLIAMS REALTY $154,000Active3 beds 2 baths1,290 sq. ft.
6217 Boyle Park Road, Little Rock, AR 72204
MLS# 26009154Listed by: CARMICHAEL & CO REALTY $105,000Active3 beds 1 baths1,036 sq. ft.
75 Purdue Circle, Little Rock, AR 72204
MLS# 26009108Listed by: MID SOUTH REALTY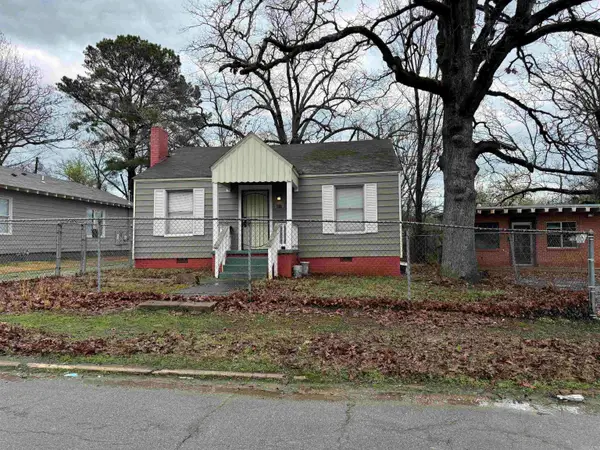 $52,000Active2 beds 1 baths840 sq. ft.
Address Withheld By Seller, Little Rock, AR 72204
MLS# 26009080Listed by: MID SOUTH REALTY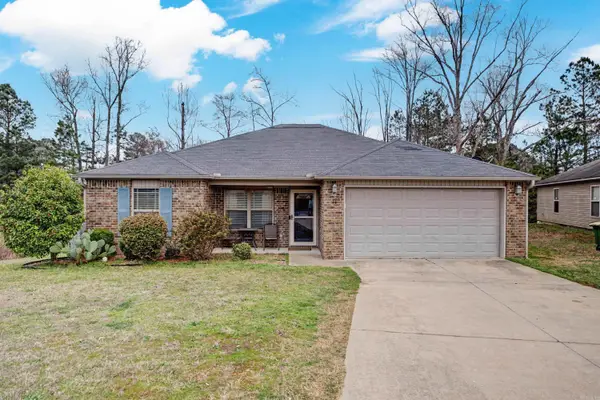 $199,900Active3 beds 2 baths1,275 sq. ft.
44 Bracey Circle, Little Rock, AR 72204
MLS# 26009086Listed by: KELLER WILLIAMS REALTY $115,000Active2.18 Acres
Lot 53 Block 5 Westwood Avenue, Little Rock, AR 72204
MLS# 26008997Listed by: CRYE-LEIKE REALTORS FINANCIAL CENTRE BRANCH $150,000Active3 beds 1 baths1,301 sq. ft.
8 Berkshire Drive, Little Rock, AR 72204
MLS# 26008989Listed by: RIVER ROCK REALTY COMPANY $315,000Active4 beds 3 baths3,460 sq. ft.
7615 Westwood Avenue, Little Rock, AR 72204
MLS# 26008953Listed by: CRYE-LEIKE REALTORS FINANCIAL CENTRE BRANCH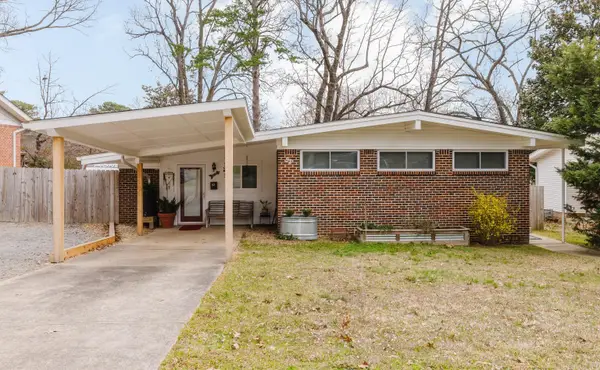
 $172,000Active3 beds 1 baths1,322 sq. ft.
52 Glenmere Drive, Little Rock, AR 72204
MLS# 26008909Listed by: CENTURY 21 PARKER & SCROGGINS REALTY - BRYANT $129,900Active3 beds 1 baths1,160 sq. ft.
1001 S Monroe Street, Little Rock, AR 72204
MLS# 26008804Listed by: CBRPM GROUP $230,000Active3 beds 2 baths1,560 sq. ft.
11 Forestview Place, Little Rock, AR 72204
MLS# 26008790Listed by: TRUMAN BALL REAL ESTATE $139,900Active3 beds 2 baths1,292 sq. ft.
32 Rosemont Drive, Little Rock, AR 72204
MLS# 26008669Listed by: LPT REALTY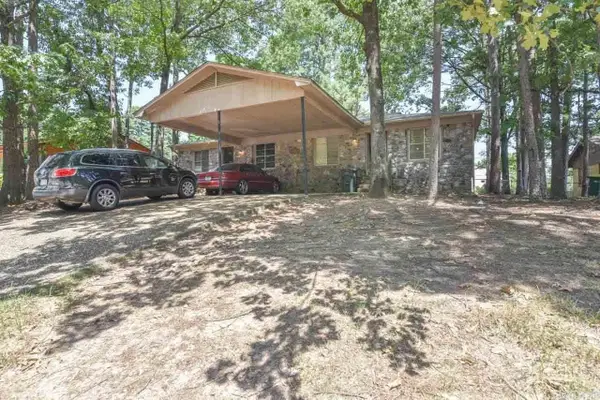 $154,900Active-- beds -- baths2,320 sq. ft.
9122 Tanya Drive, Little Rock, AR 72204
MLS# 26008575Listed by: KELLER WILLIAMS REALTY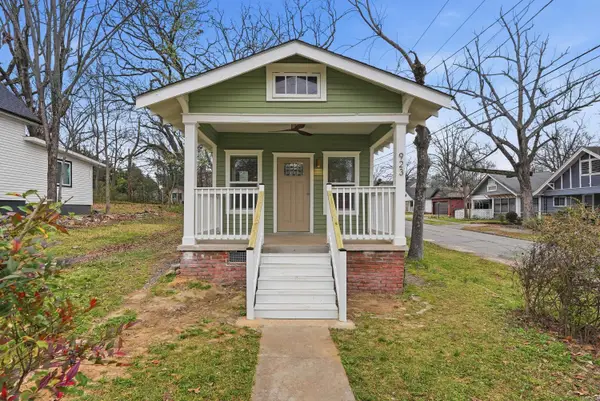 $165,000Active1 beds 1 baths719 sq. ft.
923 S Elm, Little Rock, AR 72204
MLS# 26008528Listed by: ESQ. REALTY GROUP $68,000Active2 beds 1 baths672 sq. ft.
3224 Potter Street, Little Rock, AR 72204
MLS# 26008529Listed by: MICHELE PHILLIPS & CO. REALTORS $1,200Active-- beds -- baths1,603 sq. ft.
4613 W. 23rd Street, Little Rock, AR 72018
MLS# 26004869Listed by: MCGRAW REALTORS - BENTON $135,000Active4 beds 2 baths1,620 sq. ft.
2005 Valmar Street, Little Rock, AR 72204
MLS# 26008330Listed by: KELLER WILLIAMS REALTY $99,999Active2 beds 1 baths700 sq. ft.
3317 W 27th Street, Little Rock, AR 72204
MLS# 26008352Listed by: REAL PROPERTY MANAGEMENT CENTRAL AR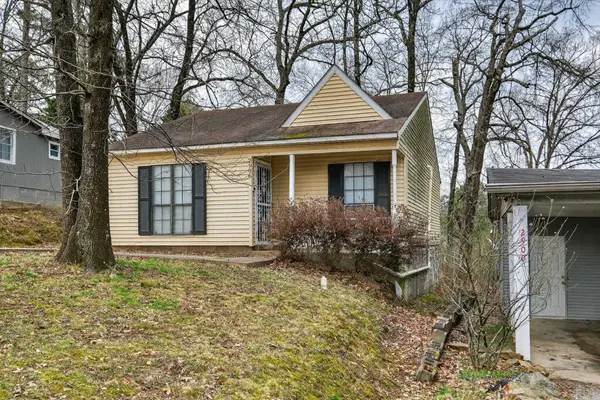 $84,900Active2 beds 1 baths892 sq. ft.
2906 Elam Street, Little Rock, AR 72204
MLS# 26008277Listed by: TRELORA REALTY, INC. $135,000Active3 beds 2 baths1,140 sq. ft.
8601 W 33rd Street, Little Rock, AR 72204
MLS# 26008236Listed by: KELLER WILLIAMS REALTY $105,000Active2 beds 1 baths1,056 sq. ft.
4423 W 26th Street, Little Rock, AR 72204
MLS# 26008197Listed by: FATHOM REALTY CENTRAL $95,000Active3 beds 3 baths1,620 sq. ft.
4724 W 26th Street, Little Rock, AR 72204
MLS# 26008090Listed by: EXP REALTY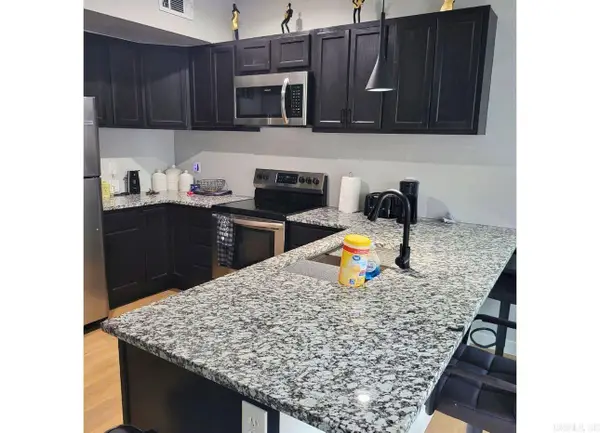 $385,000Active6 beds 4 baths2,600 sq. ft.
3315 W 15th, Little Rock, AR 72204
MLS# 26007854Listed by: SSD REALTY GROUP- Open Sun, 2 to 4pm
 $195,000Active3 beds 2 baths1,229 sq. ft.
2208 Singleton Cove, Little Rock, AR 72204
MLS# 26007857Listed by: SSD REALTY GROUP - Open Sun, 2 to 4pm
 $150,000Active3 beds 1 baths1,064 sq. ft.
1222 S Pierce Street, Little Rock, AR 72204
MLS# 26007805Listed by: REALTY ONE GROUP LOCK AND KEY 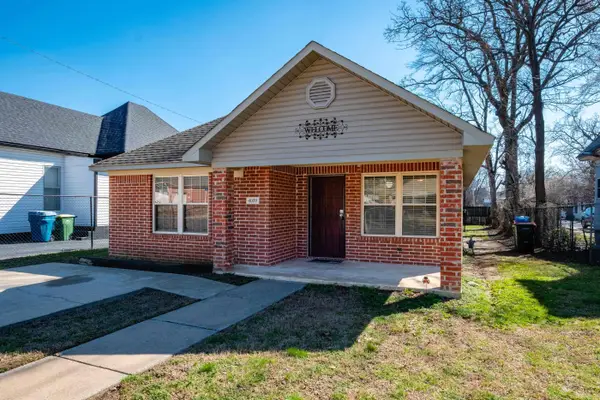 $167,900Active3 beds 2 baths1,305 sq. ft.
4009 W 11th Street, Little Rock, AR 72204
MLS# 26007756Listed by: ACCESS REALTY, INC.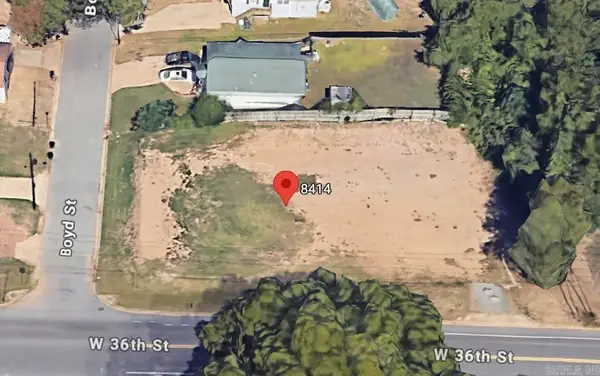 $48,000Active0.3 Acres
8414 W 36th Street, Little Rock, AR 72204
MLS# 26007626Listed by: EXP REALTY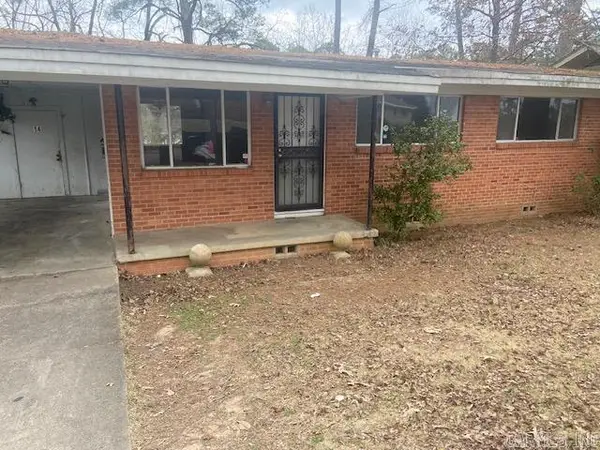 $79,900Active3 beds 1 baths950 sq. ft.
14 Rosemont Drive, Little Rock, AR 72204
MLS# 26007600Listed by: ADKINS & ASSOCIATES REAL ESTATE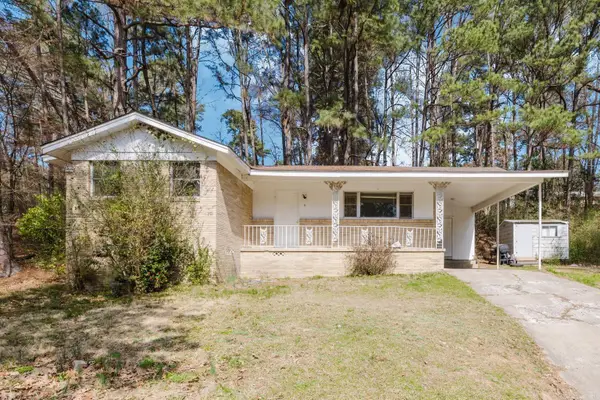 $107,500Active3 beds 2 baths1,254 sq. ft.
5 Roane Circle, Little Rock, AR 72204
MLS# 26007554Listed by: KELLER WILLIAMS REALTY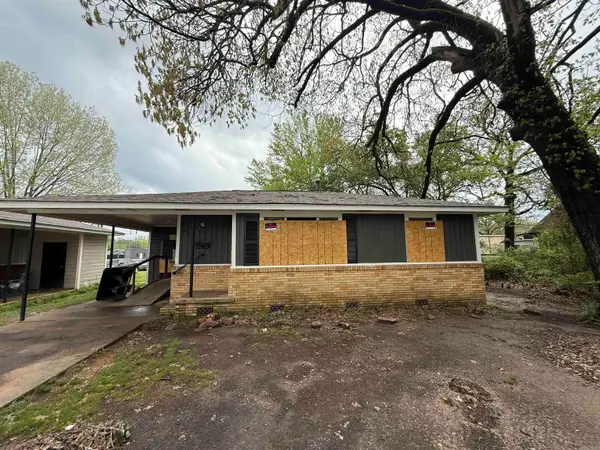 $39,000Active2 beds 1 baths756 sq. ft.
4503 W 29th Street, Little Rock, AR 72204
MLS# 26007557Listed by: KELLER WILLIAMS REALTY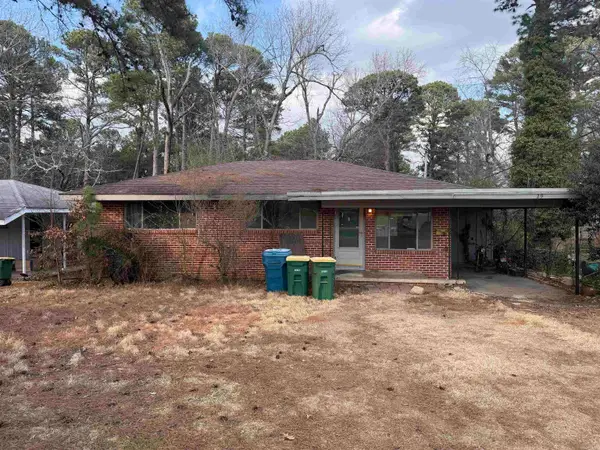 $79,900Active3 beds 1 baths962 sq. ft.
29 Barbara Circle, Little Rock, AR 72204
MLS# 26007522Listed by: CLARITY REAL ESTATE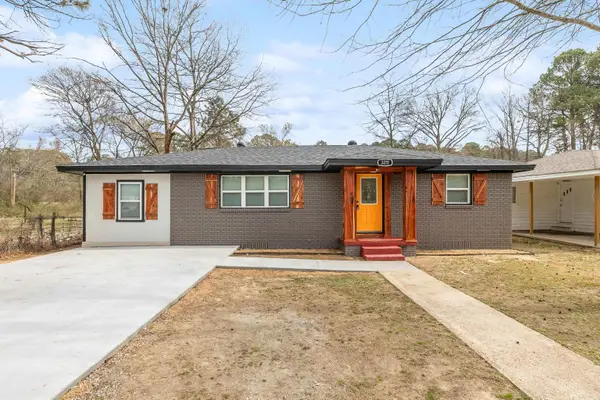 $165,000Active4 beds 2 baths1,423 sq. ft.
3211 Whitfield Street, Little Rock, AR 72204
MLS# 26007434Listed by: LPT REALTY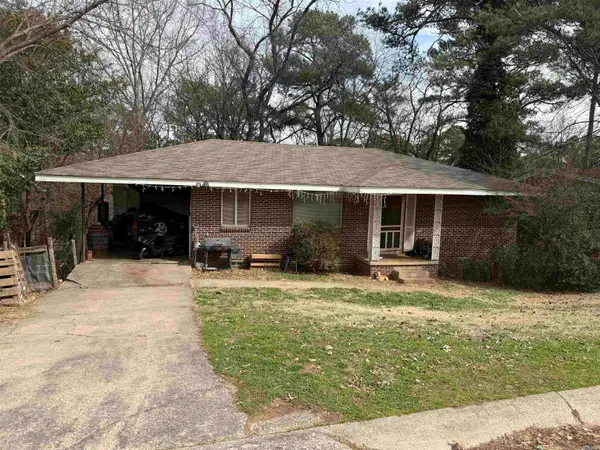 $95,000Active3 beds 1 baths1,080 sq. ft.
16 Rosemont Drive, Little Rock, AR 72204
MLS# 26007445Listed by: KELLER WILLIAMS REALTY $114,900Active3 beds 2 baths1,404 sq. ft.
1805 Buchanan Street, Little Rock, AR 72204
MLS# 26007348Listed by: KELLER WILLIAMS REALTY $140,000Active3 beds 2 baths1,297 sq. ft.
2024 Abigail Street, Little Rock, AR 72204
MLS# 26007218Listed by: CRYE-LEIKE REALTORS FINANCIAL CENTRE BRANCH $85,000Active2 beds 2 baths1,390 sq. ft.
1608 Green Meadow Drive, Little Rock, AR 72204
MLS# 26007142Listed by: HOME DESIGN AND REALTY L.L.C. $70,000Active3 beds 2 baths1,092 sq. ft.
1708 S Cedar Street, Little Rock, AR 72204
MLS# 26007135Listed by: HOME DESIGN AND REALTY L.L.C.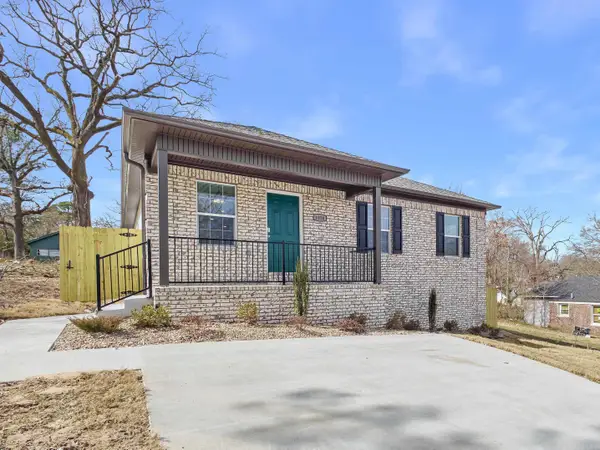 $209,900Active4 beds 2 baths1,275 sq. ft.
Address Withheld By Seller, Little Rock, AR 72204
MLS# 26007061Listed by: ACLIN REALTY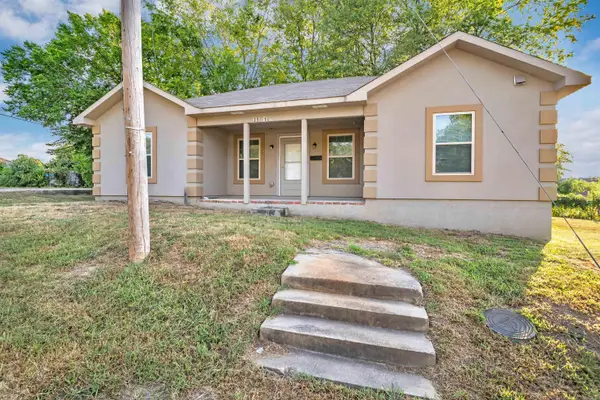 $150,000Active3 beds 2 baths1,338 sq. ft.
3501 W 25th St, Little Rock, AR 72204
MLS# 26006895Listed by: CENTURY 21 PARKER & SCROGGINS REALTY - CONWAY $150,000Active3 beds 2 baths1,400 sq. ft.
4311 W 24th Street, Little Rock, AR 72204
MLS# 26006906Listed by: COMPASS GROUP REAL ESTATE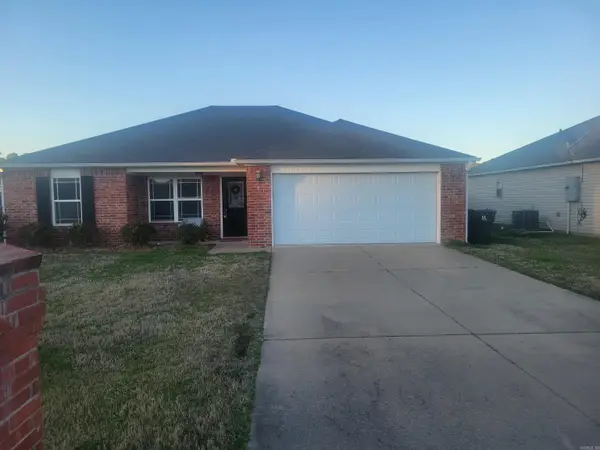 $170,000Active3 beds 2 baths1,215 sq. ft.
6 Java Ct, Little Rock, AR 72204
MLS# 26006821Listed by: LOTUS REALTY $195,000Active3 beds 2 baths1,766 sq. ft.
40 Lakeshore Drive, Little Rock, AR 72204
MLS# 26006782Listed by: CHARLOTTE JOHN COMPANY (LITTLE ROCK) $174,990Active3 beds 2 baths1,312 sq. ft.
4522 W 21st Street, Little Rock, AR 72204
MLS# 26006764Listed by: SOUTHERN DWELLINGS & DESIGNS INC.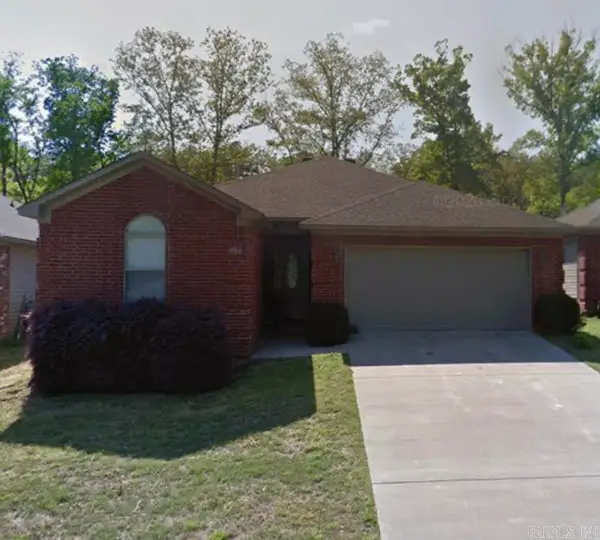 $215,000Active3 beds 2 baths1,483 sq. ft.
1906 Leander Drive, Little Rock, AR 72204
MLS# 26006715Listed by: RIVER TRAIL PROPERTIES $198,500Active3 beds 2 baths1,435 sq. ft.
2601 Longcoy Street, Little Rock, AR 72204
MLS# 26006717Listed by: RIVER TRAIL PROPERTIES $125,000Active3 beds 1 baths1,200 sq. ft.
4607 W 11th, Little Rock, AR 72204
MLS# 26006708Listed by: CRYE-LEIKE REALTORS NLR BRANCH $84,900Active3 beds 1 baths1,162 sq. ft.
2918 W 15th Street, Little Rock, AR 72202
MLS# 26006711Listed by: BERKSHIRE HATHAWAY HOMESERVICES ARKANSAS REALTY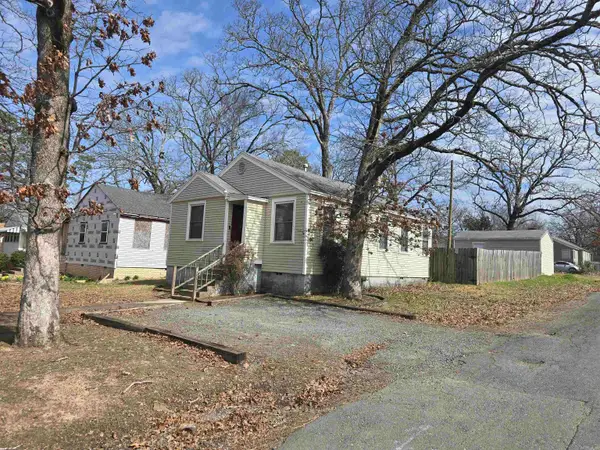 $120,000Active3 beds 1 baths910 sq. ft.
1909 S Pierce St, Little Rock, AR 72204
MLS# 26006642Listed by: RIVER ROCK REALTY COMPANY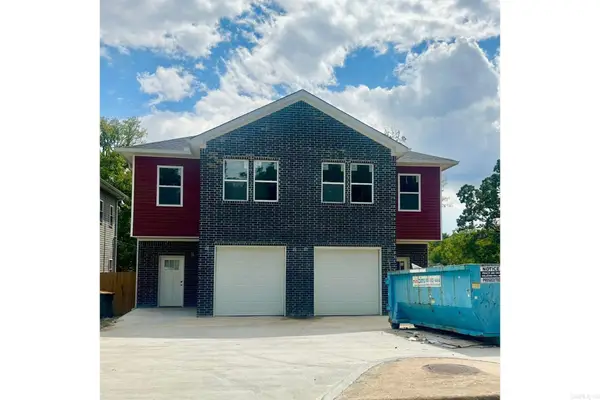 $405,000Active6 beds 6 baths2,600 sq. ft.
3309 W 15th Street, Little Rock, AR 72204
MLS# 26006352Listed by: SSD REALTY GROUP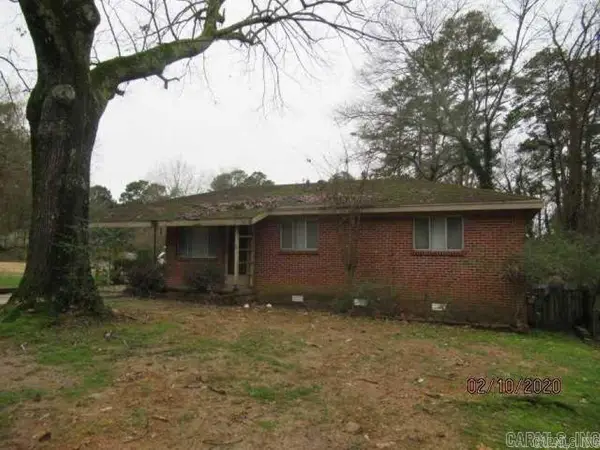 $105,000Active3 beds 1 baths950 sq. ft.
89 Broadmoor Dr, Little Rock, AR 72204
MLS# 26006253Listed by: RIVER ROCK REALTY COMPANY $130,000Active2 beds 1 baths1,008 sq. ft.
2501 S Tyler St, Little Rock, AR 72204
MLS# 26006217Listed by: RIVER ROCK REALTY COMPANY $120,000Active2 beds 1 baths848 sq. ft.
2602 S Tyler St, Little Rock, AR 72204
MLS# 26006218Listed by: RIVER ROCK REALTY COMPANY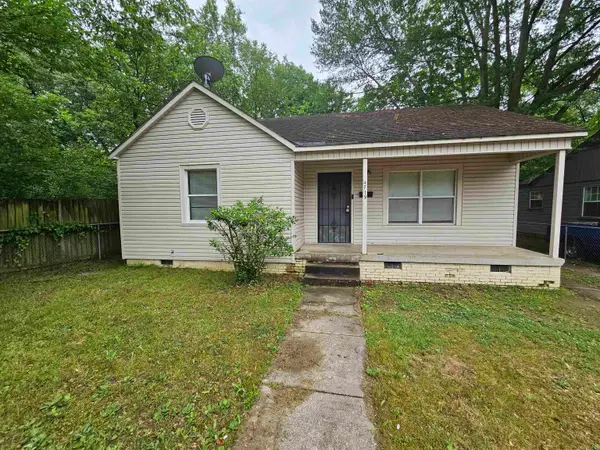 $120,000Active2 beds 1 baths989 sq. ft.
4719 W 29th St, Little Rock, AR 72204
MLS# 26006220Listed by: RIVER ROCK REALTY COMPANY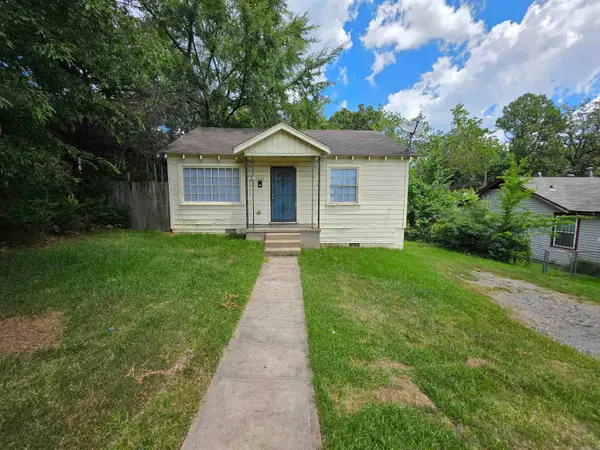 $60,000Active2 beds 1 baths780 sq. ft.
5102 W 11th St, Little Rock, AR 72204
MLS# 26006223Listed by: RIVER ROCK REALTY COMPANY $105,000Active3 beds 1 baths1,012 sq. ft.
111 Broadmoor Dr, Little Rock, AR 72204
MLS# 26006206Listed by: RIVER ROCK REALTY COMPANY $125,000Active3 beds 1 baths950 sq. ft.
23 Belmont Dr, Little Rock, AR 72204
MLS# 26006208Listed by: RIVER ROCK REALTY COMPANY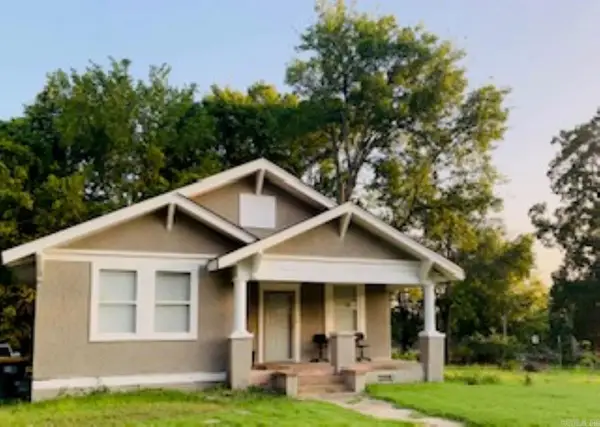 $135,000Active2 beds 1 baths991 sq. ft.
3817 W 10th St Street, Little Rock, AR 72204
MLS# 26006196Listed by: COMPASS GROUP REAL ESTATE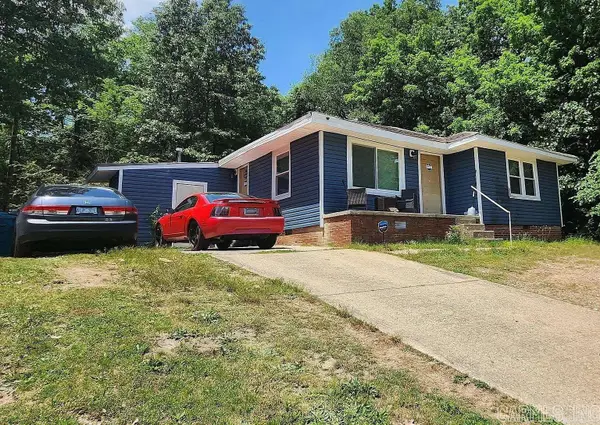 $125,000Active2 beds 1 baths839 sq. ft.
4408 John Barrow Rd Street, Little Rock, AR 72204
MLS# 26006197Listed by: COMPASS GROUP REAL ESTATE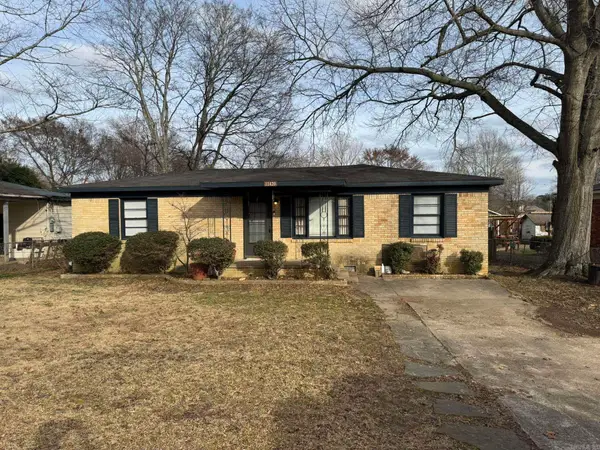 $140,000Active3 beds 2 baths1,125 sq. ft.
11420 David O Dodd, Little Rock, AR 72204
MLS# 26006160Listed by: VYLLA HOME $189,900Active3 beds 2 baths1,472 sq. ft.
5913 Timberview Road, Little Rock, AR 72204
MLS# 26006098Listed by: START TO FINISH REALTY $155,000Active4 beds 3 baths2,850 sq. ft.
1524 S Tyler St, Little Rock, AR 72204
MLS# 26006018Listed by: EXP REALTY $89,500Active4 beds 2 baths1,600 sq. ft.
2521 S Maple St, Little Rock, AR 72204
MLS# 26006025Listed by: EXP REALTY $89,999Active3 beds 2 baths1,085 sq. ft.
2301 Ridge Park Road, Little Rock, AR 72204
MLS# 26005992Listed by: KELLER WILLIAMS REALTY $38,000Active0.2 Acres
0 Ludwig Street, Little Rock, AR 72204
MLS# 26005985Listed by: GOLD STAR REALTY $94,900Active3 beds 1 baths1,215 sq. ft.
68 Broadmoor Drive, Little Rock, AR 72204
MLS# 26005786Listed by: ADKINS & ASSOCIATES REAL ESTATE $225,000Active4 beds 2 baths1,930 sq. ft.
3408 Katherine Street, Little Rock, AR 72204
MLS# 26005529Listed by: VYLLA HOME- $99,000Active3 beds 1 baths1,300 sq. ft.
1519 South Oak Street, Little Rock, AR 72204
MLS# 26005556Listed by: MOVE REALTY  $185,000Active5 beds 3 baths4,270 sq. ft.
4905 Westwood Avenue, Little Rock, AR 72204
MLS# 26005477Listed by: RE/MAX ENCORE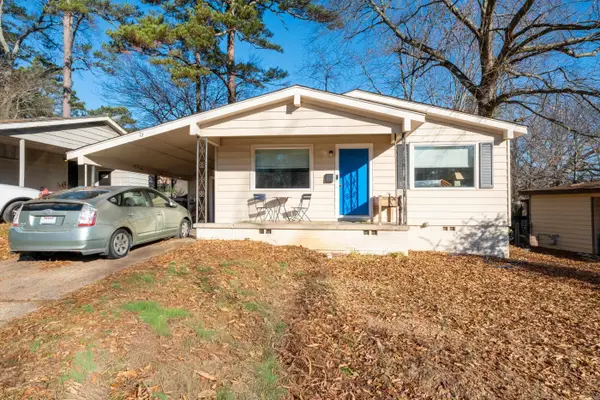 $95,000Active3 beds 1 baths1,073 sq. ft.
73 Purdue Circle, Little Rock, AR 72204
MLS# 26005275Listed by: KELLER WILLIAMS REALTY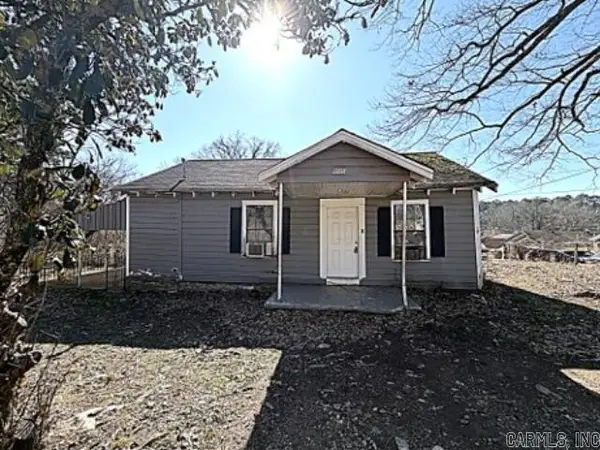 $55,500Active2 beds 1 baths875 sq. ft.
9023 W 33rd Road, Little Rock, AR 72204
MLS# 26005108Listed by: VYLLA HOME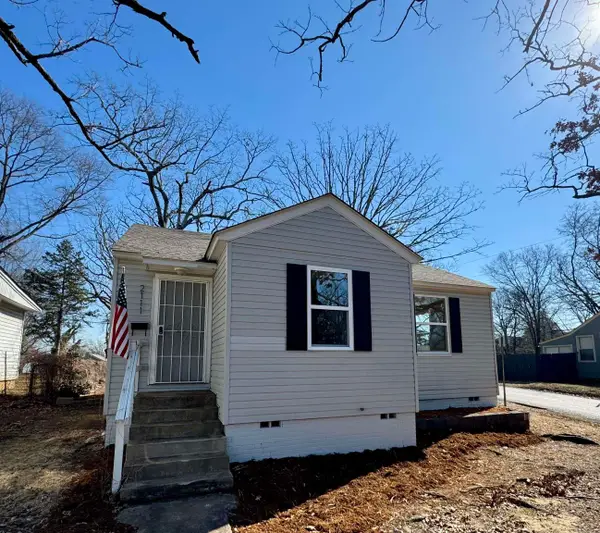 $123,500Active2 beds 1 baths968 sq. ft.
2111 S Tyler Street, Little Rock, AR 72204
MLS# 26005065Listed by: LPT REALTY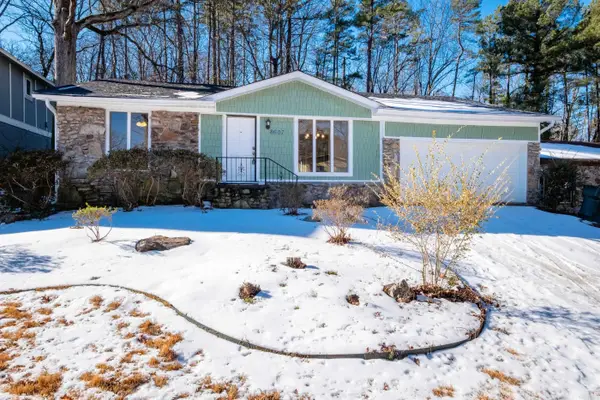 $185,000Active3 beds 2 baths1,620 sq. ft.
8607 Nancy Place, Little Rock, AR 72204
MLS# 26005000Listed by: OWNIT GLOBAL PROPERTY GROUP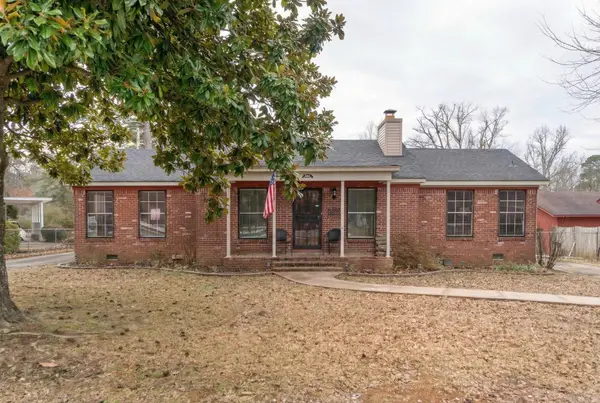 $650,000Active4 beds 4 baths3,262 sq. ft.
10221 Lanehart Road, Little Rock, AR 72204
MLS# 26004902Listed by: MCKIMMEY ASSOCIATES REALTORS NLR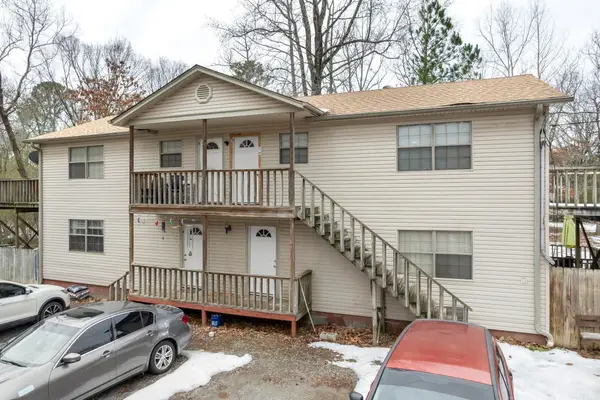 $650,000Active-- beds -- baths7,984 sq. ft.
10223 Lanehart Road, Little Rock, AR 72204
MLS# 26004905Listed by: MCKIMMEY ASSOCIATES REALTORS NLR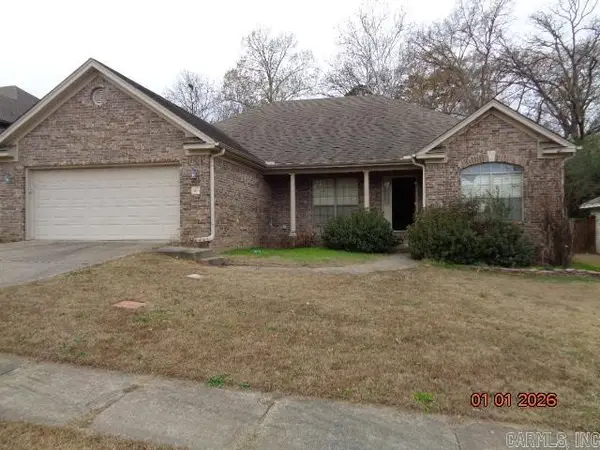 $202,000Active3 beds 2 baths1,721 sq. ft.
110 Woodridge Court, Little Rock, AR 72204
MLS# 26004525Listed by: RE/MAX AFFILIATES REALTY $680,000Active4 beds 4 baths5,128 sq. ft.
7921 Kanis Oaks Dr, Little Rock, AR 72204
MLS# 26004146Listed by: EDGE REALTY $175,000Active3 beds 1 baths1,498 sq. ft.
1409 Fair Park Blvd, Little Rock, AR 72204
MLS# 26004016Listed by: CBRPM GROUP $95,000Active2 beds 1 baths821 sq. ft.
7621 W 44th St, Little Rock, AR 72204
MLS# 26004022Listed by: RIVER ROCK REALTY COMPANY $95,000Active2 beds 1 baths860 sq. ft.
3613 Boyd St, Little Rock, AR 72204
MLS# 26004007Listed by: RIVER ROCK REALTY COMPANY $24,900Active2 beds 1 baths918 sq. ft.
4105 Zion Street, Little Rock, AR 72204
MLS# 26003946Listed by: RE/MAX AFFILIATES REALTY $75,000Active2 beds 1 baths921 sq. ft.
1401 S Harrison, Little Rock, AR 72204
MLS# 26003800Listed by: RGB APPRAISALS & REALTY $100,000Active3 beds 2 baths2,194 sq. ft.
1811 Peyton, Little Rock, AR 72204
MLS# 26003802Listed by: RGB APPRAISALS & REALTY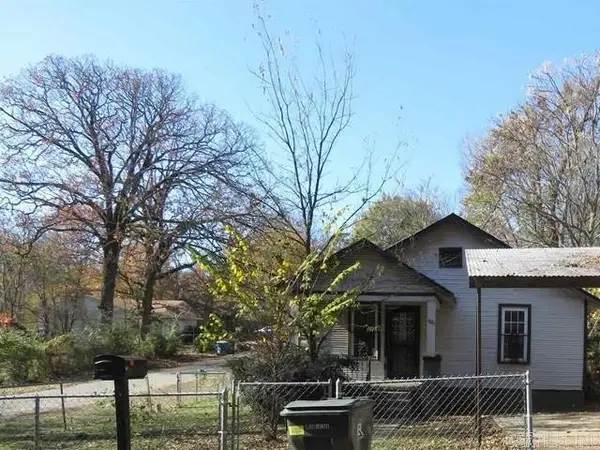 $115,000Active3 beds 2 baths1,248 sq. ft.
1824 Abigail Street, Little Rock, AR 72204
MLS# 26003803Listed by: RGB APPRAISALS & REALTY $160,000Pending-- beds -- baths2,320 sq. ft.
9122 Tanya Drive, Little Rock, AR 72204
MLS# 26003692Listed by: KELLER WILLIAMS REALTY $107,500Active2 beds 1 baths768 sq. ft.
4508 W 25th Street, Little Rock, AR 72204
MLS# 26003648Listed by: RIVER ROCK REALTY COMPANY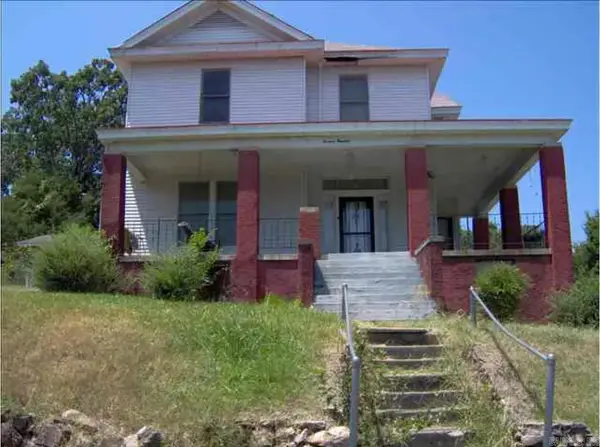 $109,900Active4 beds 2 baths2,818 sq. ft.
1400 Brown St, Little Rock, AR 72204
MLS# 26003609Listed by: IHP REAL ESTATE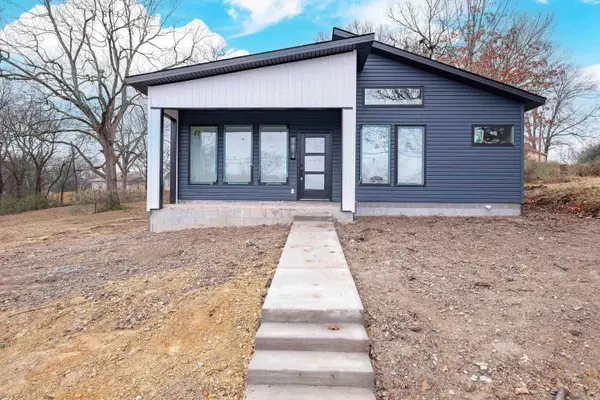 $199,900Active3 beds 2 baths1,158 sq. ft.
1614 S Woodrow Street, Little Rock, AR 72204
MLS# 26003606Listed by: KELLER WILLIAMS REALTY $199,000Active3 beds 2 baths2,300 sq. ft.
6401 Shirley Drive, Little Rock, AR 72204
MLS# 26003571Listed by: KELLER WILLIAMS REALTY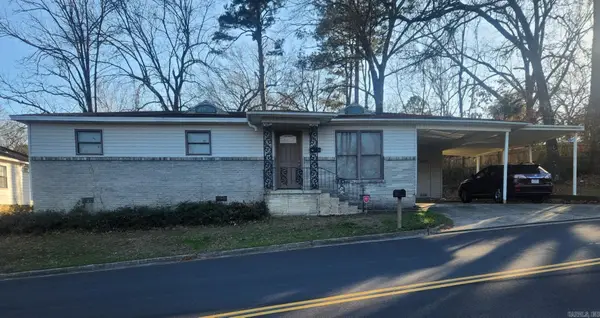 $139,900Active3 beds 2 baths1,144 sq. ft.
9105 W 36th Street, Little Rock, AR 72204
MLS# 26003508Listed by: TRUMAN BALL REAL ESTATE $65,000Active3 beds 1 baths876 sq. ft.
Address Withheld By Seller, Little Rock, AR 72204
MLS# 26003202Listed by: LUX REAL ESTATE GROUP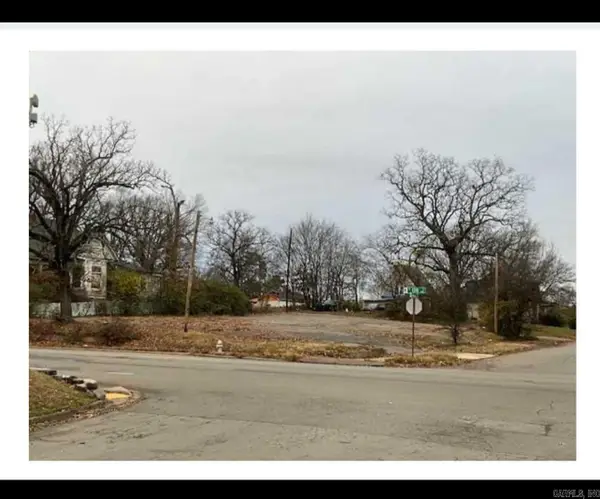 $130,000Active0.34 Acres
00 W 12th Street, Little Rock, AR 72204
MLS# 26002922Listed by: HAWKS REALTY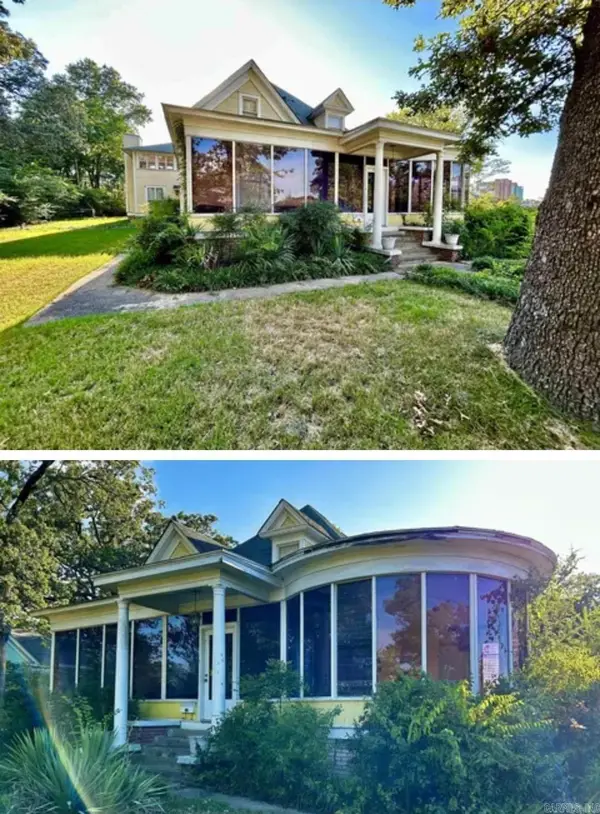 $179,900Active3 beds 3 baths3,667 sq. ft.
904 S Oak, Little Rock, AR 72204
MLS# 26002668Listed by: CAPITAL REAL ESTATE ADVISORS $88,900Active3 beds 1 baths972 sq. ft.
3220 Whitfield Street, Little Rock, AR 72204
MLS# 26002635Listed by: REALTY SOLUTION $240,000Active4 beds 2 baths1,653 sq. ft.
8324 W 29th Street, Little Rock, AR 72204
MLS# 26002157Listed by: MICHELE PHILLIPS & CO. REALTORS $205,000Active3 beds 2 baths1,460 sq. ft.
9314 Monique Drive, Little Rock, AR 72204
MLS# 26002005Listed by: KELLER WILLIAMS REALTY $15,000Active0.19 Acres
Address Withheld By Seller, Little Rock, AR 72204
MLS# 26001565Listed by: KELLER WILLIAMS REALTY $15,000Active0.27 Acres
Address Withheld By Seller, Little Rock, AR 72204
MLS# 26001567Listed by: KELLER WILLIAMS REALTY $15,000Active0.19 Acres
Address Withheld By Seller, Little Rock, AR 72204
MLS# 26001570Listed by: KELLER WILLIAMS REALTY $73,000Active2 beds 1 baths891 sq. ft.
2501 S Pine Street, Little Rock, AR 72204
MLS# 26001556Listed by: REAL BROKER $15,000Active0.28 Acres
Address Withheld By Seller, Little Rock, AR 72204
MLS# 26001557Listed by: KELLER WILLIAMS REALTY $15,000Active0.2 Acres
Address Withheld By Seller, Little Rock, AR 72204
MLS# 26001559Listed by: KELLER WILLIAMS REALTY- Open Sun, 2 to 4pm
 $155,000Active3 beds 1 baths1,287 sq. ft.
2923 Fair Park Boulevard, Little Rock, AR 72204
MLS# 26001563Listed by: OWNIT GLOBAL PROPERTY GROUP  $89,000Active2 beds 1 baths840 sq. ft.
1019 Adams Street, Little Rock, AR 72204
MLS# 26001551Listed by: REAL BROKER $15,000Active0.25 Acres
Address Withheld By Seller, Little Rock, AR 72204
MLS# 26001552Listed by: KELLER WILLIAMS REALTY $15,000Active0.21 Acres
Address Withheld By Seller, Little Rock, AR 72204
MLS# 26001512Listed by: KELLER WILLIAMS REALTY $15,000Active0.2 Acres
Address Withheld By Seller, Little Rock, AR 72204
MLS# 26001519Listed by: KELLER WILLIAMS REALTY $15,000Active0.2 Acres
Address Withheld By Seller, Little Rock, AR 72204
MLS# 26001523Listed by: KELLER WILLIAMS REALTY $15,000Active0.22 Acres
Lot 106 Dartmouth Drive, Little Rock, AR 72204
MLS# 26001504Listed by: KELLER WILLIAMS REALTY $155,000Active3 beds 1 baths1,089 sq. ft.
2911 Wynne Dr, Little Rock, AR 72204
MLS# 26001127Listed by: CBRPM MAUMELLE $649,900Active8.92 Acres
000 Sage Meadows, Little Rock, AR 72204
MLS# 26001079Listed by: KELLER WILLIAMS REALTY $95,000Active3 beds 2 baths1,942 sq. ft.
2500 Booker St, Little Rock, AR 72204
MLS# 26001034Listed by: CBRPM MAUMELLE $129,900Active4 beds 2 baths1,172 sq. ft.
8 Bay, Little Rock, AR 72204
MLS# 26000409Listed by: CENTURY 21 SANDSTONE REAL ESTATE GROUP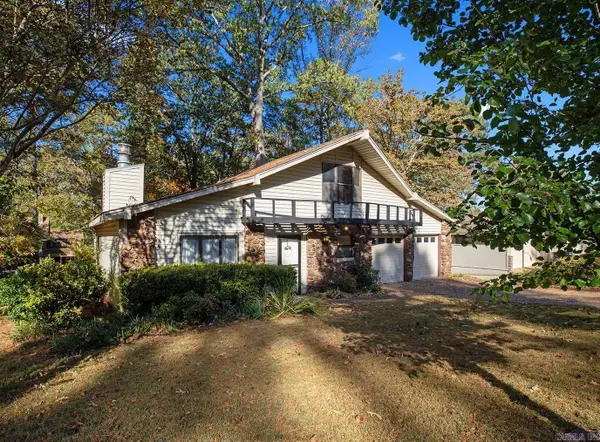 $208,000Active5 beds 3 baths2,490 sq. ft.
7714 Standish Road, Little Rock, AR 72204
MLS# 26000375Listed by: REALTY ONE GROUP LOCK AND KEY $625,000Active5 beds 3 baths2,918 sq. ft.
110 Shady Thicket Lane, Little Rock, AR 72204
MLS# 25050245Listed by: CLARITY REAL ESTATE $120,000Active3 beds 2 baths1,432 sq. ft.
1023 Booker Street, Little Rock, AR 72204
MLS# 25049927Listed by: KELLER WILLIAMS REALTY- $477,999Active4 beds 4 baths2,210 sq. ft.
8200 Kanis Pines Drive, Little Rock, AR 72204
MLS# 25049848Listed by: THE AGENCY REALTY COMPANY  $392,999Active4 beds 2 baths2,015 sq. ft.
1710 Village Lake Dr, Little Rock, AR 72204
MLS# 25049850Listed by: THE AGENCY REALTY COMPANY $430,495Active4 beds 3 baths2,327 sq. ft.
8116 Kanis Pines Drive, Little Rock, AR 72204
MLS# 25049646Listed by: THE AGENCY REALTY COMPANY $474,710Active4 beds 3 baths2,566 sq. ft.
8108 Kanis Pines Drive, Little Rock, AR 72204
MLS# 25049647Listed by: THE AGENCY REALTY COMPANY $35,000Active2 beds 1 baths1,211 sq. ft.
2104 S Pine Street, Little Rock, AR 72204
MLS# 25049271Listed by: RIVER ROCK REALTY COMPANY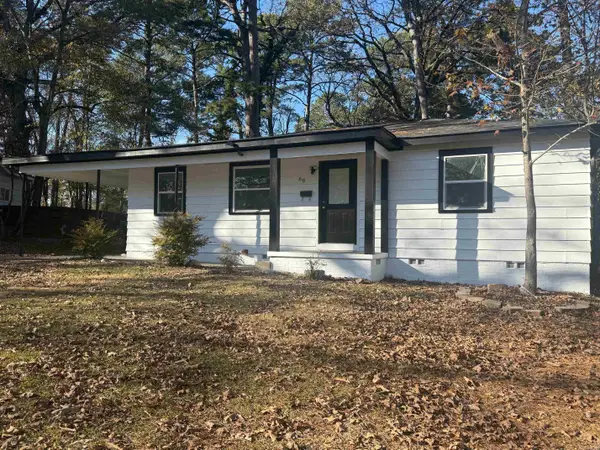 $139,900Active3 beds 1 baths1,014 sq. ft.
69 Purdue Circle, Little Rock, AR 72204
MLS# 25048937Listed by: NASH REALTY $99,000Active2 beds 1 baths1,060 sq. ft.
3501 Elam Street, Little Rock, AR 72204
MLS# 25048730Listed by: CENTURY 21 UNITED $59,500Active2 beds 1 baths862 sq. ft.
Address Withheld By Seller, Little Rock, AR 72204
MLS# 25047343Listed by: CRYE-LEIKE REALTORS KANIS BRANCH $56,500Active1 beds 1 baths1,107 sq. ft.
3211 Walker Street, Little Rock, AR 72204
MLS# 25046960Listed by: HOME DESIGN AND REALTY L.L.C. $53,850Active2 beds 1 baths988 sq. ft.
2000 S Valentine Street, Little Rock, AR 72204
MLS# 25046851Listed by: HOME DESIGN AND REALTY L.L.C. $625,000Active5 beds 3 baths2,918 sq. ft.
110 Shady Thicket Lane, Little Rock, AR 72204
MLS# 25046839Listed by: CLARITY REAL ESTATE $200,000Active3 beds 2 baths1,882 sq. ft.
1413 Fair Park Boulevard, Little Rock, AR 72204
MLS# 25046658Listed by: CRYE-LEIKE REALTORS KANIS BRANCH $119,000Active3 beds 1 baths1,014 sq. ft.
50 Purdue Circle, Little Rock, AR 72204
MLS# 25046466Listed by: JANET JONES COMPANY $47,000Active0.29 Acres
8127 Kanis Pines Drive, Little Rock, AR 72204
MLS# 25005205Listed by: ACCESS REALTY, INC. $102,500Active2 beds 1 baths768 sq. ft.
4903 W 28th Street, Little Rock, AR 72204
MLS# 25045453Listed by: RIVER ROCK REALTY COMPANY $109,000Active2 beds 1 baths822 sq. ft.
1908 S Buchanan Street, Little Rock, AR 72204
MLS# 25045348Listed by: KELLER WILLIAMS REALTY $55,000Active2 beds 1 baths836 sq. ft.
4400 W 29th Street, Little Rock, AR 72204
MLS# 25045091Listed by: KELLER WILLIAMS REALTY $171,999Active3 beds 2 baths1,360 sq. ft.
3908 Tudor Street, Little Rock, AR 72204
MLS# 25044899Listed by: MID SOUTH REALTY $189,900Active3 beds 2 baths1,243 sq. ft.
4418 Holt Street, Little Rock, AR 72204
MLS# 25044523Listed by: KELLER WILLIAMS REALTY $369,900Active4 beds 3 baths2,093 sq. ft.
8010 Kanis Oaks Drive, Little Rock, AR 72204
MLS# 25044486Listed by: MCKIMMEY ASSOCIATES REALTORS NLR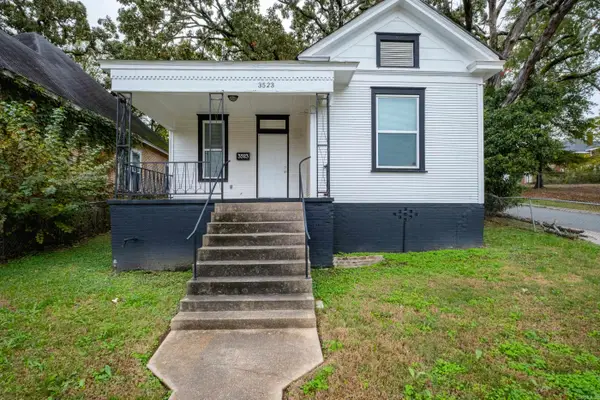 $140,000Active2 beds 1 baths910 sq. ft.
3523 W 10th Street, Little Rock, AR 72204
MLS# 26007945Listed by: CHARLOTTE JOHN COMPANY (LITTLE ROCK) $39,000Active2 beds 1 baths795 sq. ft.
3801 Whitfield, Little Rock, AR 72204
MLS# 25042899Listed by: LPT REALTY CONWAY- $399,000Active0.26 Acres
37 Miramont Circle, Little Rock, AR 72223
MLS# 25042896Listed by: KELLER WILLIAMS REALTY  $135,000Active3 beds 3 baths1,486 sq. ft.
2300 Cedar Street, Little Rock, AR 72204
MLS# 25042639Listed by: TRUMAN BALL REAL ESTATE $79,900Active2 beds 1 baths775 sq. ft.
3214 Zion Street, Little Rock, AR 72204
MLS# 25042409Listed by: REAL BROKER $89,900Active3 beds 1 baths936 sq. ft.
4705 Elmwood Drive, Little Rock, AR 72204
MLS# 25042396Listed by: REAL BROKER $259,000Active3 beds 2 baths2,081 sq. ft.
9014 Herndon Rd, Little Rock, AR 72204
MLS# 25041950Listed by: LEVEL UP REALTY $150,000Active3 beds 2 baths1,606 sq. ft.
9614 Labette Drive, Little Rock, AR 72204
MLS# 25041209Listed by: GOSS MANAGEMENT & REALTY $100,000Active8.32 Acres
000 W 36th Street, Little Rock, AR 72206
MLS# 25041216Listed by: UNITED REAL ESTATE - CENTRAL AR $75,000Active2.5 Acres
8300 W 23rd Street, Little Rock, AR 72204
MLS# 25041194Listed by: LPT REALTY SALINE $100,000Active2 beds 1 baths971 sq. ft.
4624 W 29th Street, Little Rock, AR 72204
MLS# 25041039Listed by: REAL BROKER $95,000Active3 beds 1 baths1,000 sq. ft.
8920 W 37th Street, Little Rock, AR 72204
MLS# 25040968Listed by: ACCESS REALTY, INC.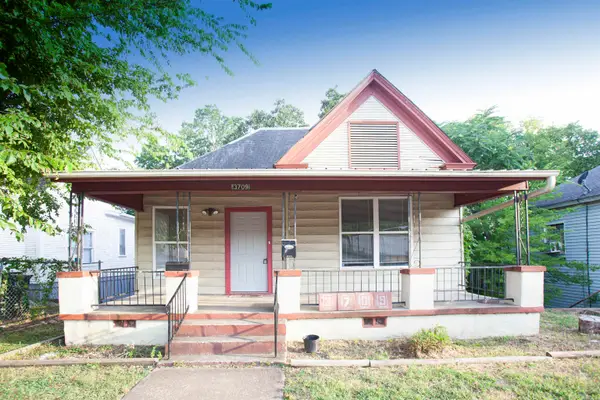 $155,000Active-- beds -- baths2,548 sq. ft.
3709 W 12 Street, Little Rock, AR 72204
MLS# 25040969Listed by: ACCESS REALTY, INC. $85,000Active3 beds 1 baths860 sq. ft.
4020 Malloy Street, Little Rock, AR 72204
MLS# 25040966Listed by: ACCESS REALTY, INC. $85,000Active2 beds 1 baths820 sq. ft.
2703 Madison Street, Little Rock, AR 72204
MLS# 25040957Listed by: ACCESS REALTY, INC. $95,000Active3 beds 1 baths1,110 sq. ft.
4512 W 16th Street, Little Rock, AR 72204
MLS# 25040960Listed by: ACCESS REALTY, INC. $80,000Active3 beds 2 baths1,120 sq. ft.
4101 W 13 Street, Little Rock, AR 72204
MLS# 25040948Listed by: ACCESS REALTY, INC. $129,900Active3 beds 1 baths1,240 sq. ft.
2600 S Van Buren Street, Little Rock, AR 72204
MLS# 25040523Listed by: LPT REALTY $110,000Active3 beds 1 baths1,156 sq. ft.
5212 W 31st Street, Little Rock, AR 72204
MLS# 25040527Listed by: CAPITAL REAL ESTATE ADVISORS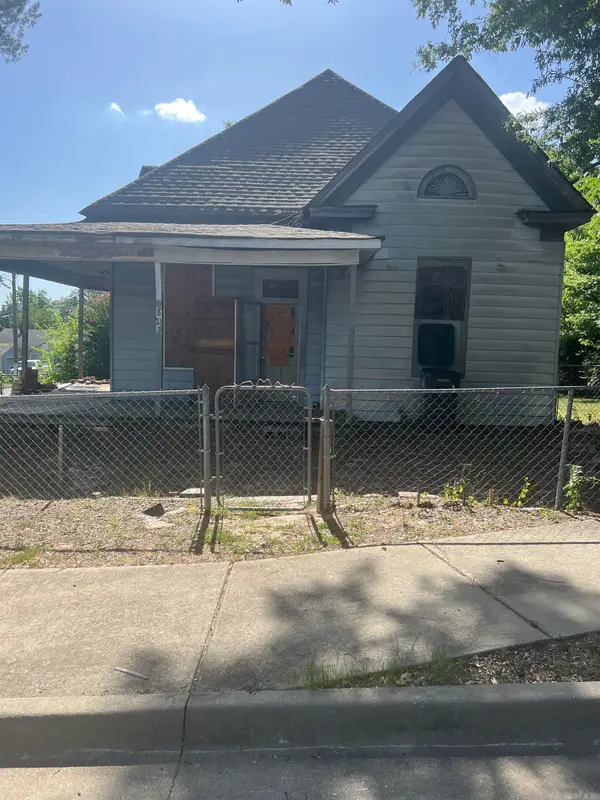 $60,000Active3 beds 2 baths1,272 sq. ft.
822 S Elm Street, Little Rock, AR 72204
MLS# 25040358Listed by: KELLER WILLIAMS REALTY $9,900Active3 beds 1 baths1,148 sq. ft.
4216 W 17th Street, Little Rock, AR 72204
MLS# 25039854Listed by: RE/MAX AFFILIATES REALTY $165,000Active3 beds 2 baths1,510 sq. ft.
4110 Malloy Street, Little Rock, AR 72204
MLS# 25039473Listed by: ACCESS REALTY, INC. $105,500Active3 beds 1 baths925 sq. ft.
3101 Gilman St, Little Rock, AR 72204
MLS# 26000872Listed by: CRYE-LEIKE REALTORS KANIS BRANCH $15,000Active3 beds 1 baths1,376 sq. ft.
1610 S Cedar Street, Little Rock, AR 72204
MLS# 25038801Listed by: BROKERS GUILD REAL ESTATE $149,500Active3 beds 2 baths1,172 sq. ft.
2522 Quebec, Little Rock, AR 72204
MLS# 25038448Listed by: PRO REALTY, INC. $109,900Active3 beds 1 baths996 sq. ft.
1420 Washington Street, Little Rock, AR 72204
MLS# 25037921Listed by: PORCHLIGHT REALTY $3,800,000Active6 beds 6 baths9,023 sq. ft.
6601 Stagecoach Road, Little Rock, AR 72204
MLS# 26005094Listed by: EPIC REAL ESTATE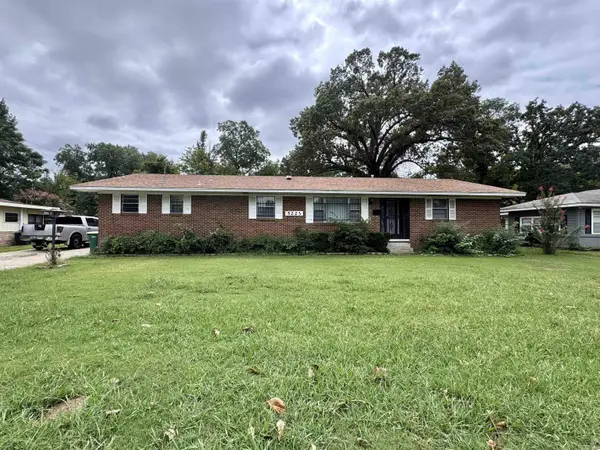 $159,000Active3 beds 2 baths1,555 sq. ft.
5223 Mabelvale Pike, Little Rock, AR 72204
MLS# 26009618Listed by: CENTURY 21 PRESTIGE REALTY $199,900Active3 beds 2 baths1,805 sq. ft.
10 Talmage Drive, Little Rock, AR 72204
MLS# 26007783Listed by: CRYE-LEIKE REALTORS KANIS BRANCH $79,900Active2 beds 1 baths931 sq. ft.
4200 19th Street, Little Rock, AR 72204
MLS# 25036610Listed by: CENTURY 21 PRESTIGE REALTY $12,000Active0.15 Acres
4424 Asher Avenue, Little Rock, AR 72204
MLS# 25036451Listed by: VR INVESTMENTS REALTY $249,500Active3 beds 2 baths1,592 sq. ft.
Address Withheld By Seller, Little Rock, AR 72204
MLS# 25035975Listed by: PLUSH HOMES CO. REALTORS $95,000Active2 beds 1 baths888 sq. ft.
1823 Johnson Street, Little Rock, AR 72204
MLS# 25035234Listed by: KELLER WILLIAMS REALTY $215,000Active5 beds 3 baths2,007 sq. ft.
1800 S Monroe Street, Little Rock, AR 72204
MLS# 25046579Listed by: MCGRAW REALTORS - BENTON $160,000Active2 beds 1 baths1,217 sq. ft.
4816 W 30th Street, Little Rock, AR 72204
MLS# 25032797Listed by: CRYE-LEIKE REALTORS KANIS BRANCH $145,000Active3 beds 3 baths2,046 sq. ft.
6609 Sterling Drive, Little Rock, AR 72204
MLS# 25032206Listed by: VR INVESTMENTS REALTY $175,000Active3 beds 2 baths1,790 sq. ft.
2118 S Pine Street, Little Rock, AR 72204
MLS# 26005465Listed by: REALTY ONE GROUP LOCK AND KEY $199,000Active3 beds 2 baths1,378 sq. ft.
4411 Bowers Street, Little Rock, AR 72204
MLS# 25031242Listed by: KELLER WILLIAMS REALTY $160,000Active3 beds 2 baths1,624 sq. ft.
7707 W 45th Street, Little Rock, AR 72204
MLS# 25046370Listed by: MICHELE PHILLIPS & CO. REALTORS SEARCY BRANCH $10,000Active0.23 Acres
8219 39th St, Little Rock, AR 72204
MLS# 25029925Listed by: MID SOUTH REALTY $50,000Active0.91 Acres
000 Longcoy St, Little Rock, AR 72204
MLS# 25029926Listed by: MID SOUTH REALTY $7,500Active0.15 Acres
000 Potter St, Little Rock, AR 72204
MLS# 25029927Listed by: MID SOUTH REALTY $15,500Active0.4 Acres
4117 West St, Little Rock, AR 72204
MLS# 25029929Listed by: MID SOUTH REALTY $8,000Active0.14 Acres
000 West St, Little Rock, AR 72204
MLS# 25029932Listed by: MID SOUTH REALTY $10,000Active0.17 Acres
000 Elam St, Little Rock, AR 72204
MLS# 25029934Listed by: MID SOUTH REALTY $110,000Active-- beds -- baths1,459 sq. ft.
2703 S Harrison, Little Rock, AR 72204
MLS# 25029516Listed by: PRO REALTY, INC. $160,000Active4 beds 3 baths1,852 sq. ft.
5216 W 31st Street, Little Rock, AR 72204
MLS# 26004119Listed by: LPT REALTY $209,000Active3 beds 2 baths1,289 sq. ft.
17 Diamanitina Way, Little Rock, AR 72204
MLS# 25041184Listed by: PLUSH HOMES CO. REALTORS $60,000Active3 beds 1 baths1,128 sq. ft.
Address Withheld By Seller, Little Rock, AR 72204
MLS# 25027364Listed by: BRICK KEY REALTY $7,500Active0.24 Acres
TBD Cardinal Road, Little Rock, AR 72204
MLS# 25026227Listed by: MID SOUTH REALTY $121,900Active2 beds 1 baths1,332 sq. ft.
4520 Weldon Avenue, Little Rock, AR 72204
MLS# 25024204Listed by: ARKBEST REALTY, INC. $170,000Active3 beds 2 baths1,312 sq. ft.
3419 W 10 Street, Little Rock, AR 72204
MLS# 26004888Listed by: CENTURY 21 UNITED $69,000Active2 beds 1 baths780 sq. ft.
8200 W 34th Street, Little Rock, AR 72204
MLS# 25046789Listed by: HOMETOWN INVESTMENTS & REALTY $189,900Active2 beds 2 baths1,248 sq. ft.
4500 Weldon Avenue, Little Rock, AR 72204
MLS# 25023769Listed by: ARKBEST REALTY, INC.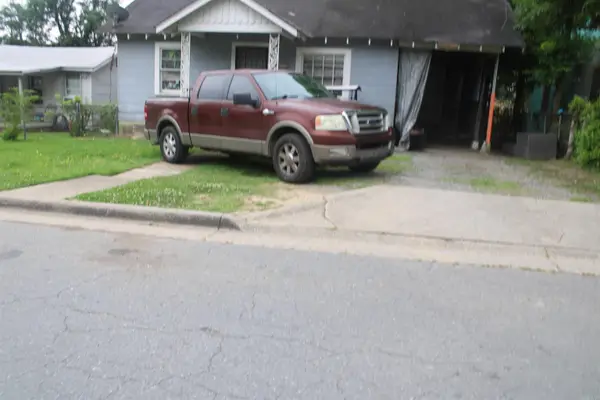 $100,000Active2 beds 1 baths893 sq. ft.
4319 W 28th Street, Little Rock, AR 72204
MLS# 25029696Listed by: RE/MAX ENCORE $9,500Active2 beds 1 baths900 sq. ft.
1004 Johnson, Little Rock, AR 72204
MLS# 25013976Listed by: MCDANIEL & CO. REALTORS INC. $103,000Active4 beds 1 baths1,152 sq. ft.
3112 W 16th Street, Little Rock, AR 72204
MLS# 25025304Listed by: PORCHLIGHT REALTY $44,500Active0.18 Acres
Lot 8 Kanis Oaks Drive, Little Rock, AR 72204
MLS# 25006434Listed by: CAPITAL REAL ESTATE ADVISORS $195,000Active3 beds 2 baths1,100 sq. ft.
2818 W 11th Street, Little Rock, AR 72204
MLS# 26003620Listed by: KELLER WILLIAMS REALTY $15,500Active0.27 Acres
Address Withheld By Seller, Little Rock, AR 72204
MLS# 24045394Listed by: COMPASS GROUP REAL ESTATE $104,900Active2 beds 1 baths936 sq. ft.
Address Withheld By Seller, Little Rock, AR 72204
MLS# 24034035Listed by: BRICK KEY REALTY $15,000Active0.15 Acres
00 W Maryland Avenue, Little Rock, AR 72204
MLS# 25036400Listed by: CRYE-LEIKE REALTORS FINANCIAL CENTRE BRANCH $275,000Active2.91 Acres
3301 W Roosevelt Road, Littlerock, AR 72204
MLS# 1283332Listed by: MOSES TUCKER PARTNERS-BENTONVILLE BRANCH $125,000Active2 beds 1 baths1,136 sq. ft.
2303 S Tyler Street, Little Rock, AR 72204
MLS# 26002946Listed by: ESQ. REALTY GROUP $80,000Active0.69 Acres
0000 W 33 Street, Little Rock, AR 72204
MLS# 24011867Listed by: ACCESS REALTY, INC. $17,000Active0.19 Acres
5209 W 22nd Street, Little Rock, AR 72120
MLS# 25042544Listed by: LPT REALTY $18,000Active0.08 Acres
3918 W 23 Street, Little Rock, AR 72204
MLS# 25029063Listed by: FAITH REALTY & ASSOCIATES $34,938Active3 beds 1 baths1,122 sq. ft.
4300 W 26th Street, Little Rock, AR 72204
MLS# 23038930Listed by: REALTY SOLUTION $950,000Active5.19 Acres
0 W 36th Street, Little Rock, AR 72206
MLS# 25023688Listed by: CAROLYN RUSSELL REAL ESTATE, INC.
Local realty services provided by:CENTURY 21 H.S.V. Realty, CENTURY 21 Lyons & Associates Real Estate
Popular searches near 72204
Popular neighborhoods near 72204
- Briarwood, Little Rock homes for sale
- Broadmoor, Little Rock homes for sale
- Chicot, Little Rock homes for sale
- Cloverdale, Little Rock homes for sale
- Fair Park, Little Rock homes for sale
- Forest Hills, Little Rock homes for sale
- Hall High, Little Rock homes for sale
- Hope, Little Rock homes for sale
- John Barrow, Little Rock homes for sale
- Love, Little Rock homes for sale
- Midtown, Little Rock homes for sale
- Oak Forest, Little Rock homes for sale
- Stagecoach, Little Rock homes for sale
- Stephens Area Faith, Little Rock homes for sale
- Town and Country, Little Rock homes for sale
- University West, Little Rock homes for sale
- Upper Baseline, Little Rock homes for sale
- Wakefield, Little Rock homes for sale
- Westwood, Little Rock homes for sale
- Windamere, Little Rock homes for sale
Counties near Little Rock, 72204
- Arkansas County homes for sale
- Cleburne County homes for sale
- Cleveland County homes for sale
- Conway County homes for sale
- Dallas County homes for sale
- Faulkner County homes for sale
- Garland County homes for sale
- Grant County homes for sale
- Hot Spring County homes for sale
- Jefferson County homes for sale
- Lincoln County homes for sale
- Lonoke County homes for sale
- Perry County homes for sale
- Pope County homes for sale
- Prairie County homes for sale
- Pulaski County homes for sale
- Saline County homes for sale
- Van Buren County homes for sale
- White County homes for sale
- Yell County homes for sale
Protect your home and budget from life's surprises with an Assurant Home Warranty, backed by a partner that supports you through every step of homeownership. Explore Plans.
©2026 Century 21 Real Estate LLC. All rights reserved. CENTURY 21®, the CENTURY 21 Logo and C21® are service marks owned by Century 21 Real Estate LLC. Century 21 Real Estate LLC fully supports the principles of the Fair Housing Act and the Equal Opportunity Act. Each office is independently owned and operated. Listing information is deemed reliable but not guaranteed accurate.