- Belleview-Cornerstone Park, Englewood homes for sale
- Bellewood, Englewood homes for sale
- Broadway Estates, Littleton homes for sale
- Brookridge, Englewood homes for sale
- Centennial, Littleton homes for sale
- Centennial Estates, Littleton homes for sale
- Centennial Park, Englewood homes for sale
- Downtown Littleton, Littleton homes for sale
- Dream House Acres, Littleton homes for sale
- Goddard, Littleton homes for sale
- Heritage, Littleton homes for sale
- Ketring Park, Littleton homes for sale
- Normandy Estates, Littleton homes for sale
- Progress Park, Littleton homes for sale
- Riverwalk, Littleton homes for sale
- South Littleton, Littleton homes for sale
- SouthPark, Littleton homes for sale
- Southwest Littleton, Littleton homes for sale
- Sterne Park, Littleton homes for sale
- Village of Four Lakes, Littleton homes for sale
Littleton, CO - homes for sale
94 of 94 results displayed
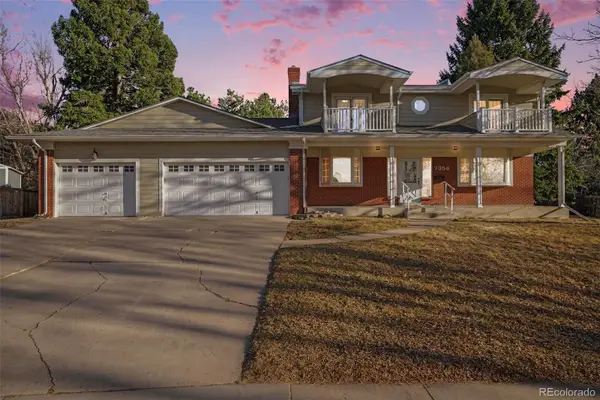
- New
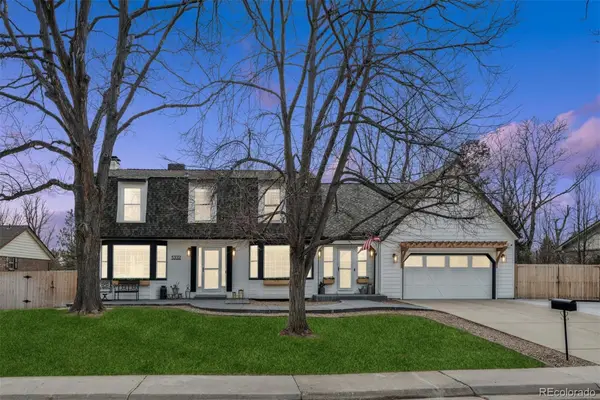
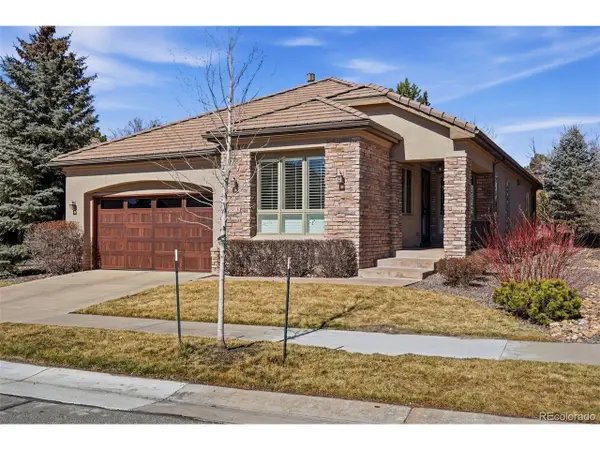
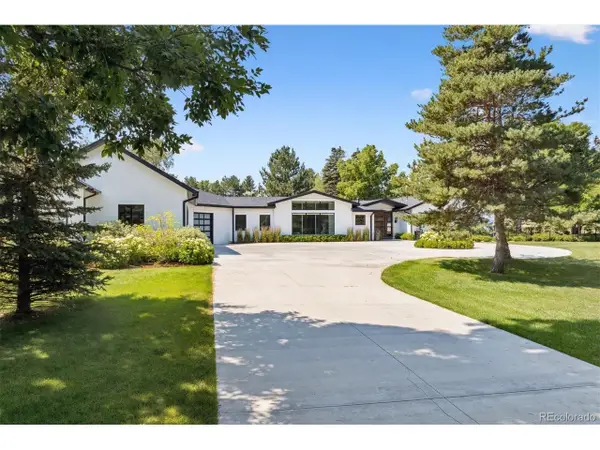
 $1,425,000Active5 beds 4 baths4,621 sq. ft.
5332 W Fair Dr, Littleton, CO 80123
MLS# 4776564Listed by: Metro Home Finders - Coming Soon
 $1,425,000Coming Soon5 beds 4 baths
5332 W Fair Drive, Littleton, CO 80123
MLS# 4776564Listed by: METRO HOME FINDERS
- New
 $565,000Active3 beds 2 baths1,640 sq. ft.
449 W Jamison Cir, Littleton, CO 80120
MLS# 1949052Listed by: RE/MAX Synergy - New
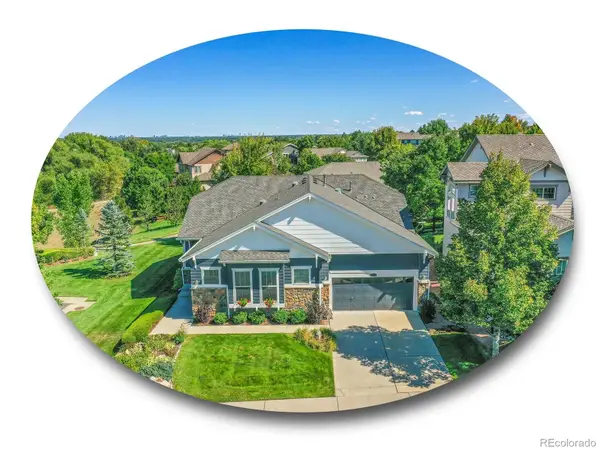
 $495,000Active3 beds 2 baths2,296 sq. ft.
5475 S Lakeview Street, Littleton, CO 80120
MLS# 7827631Listed by: KELLER WILLIAMS DTC - New
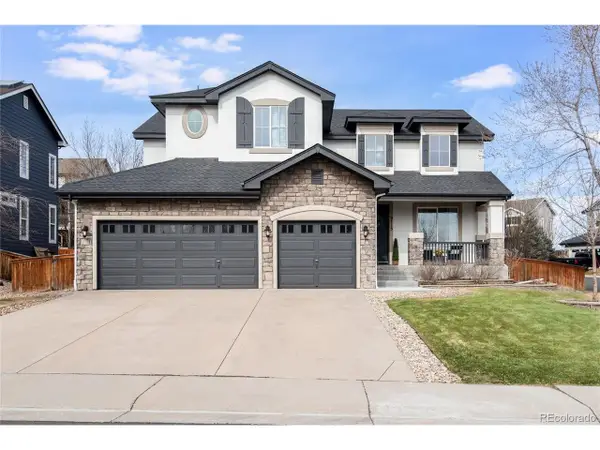
 $900,000Active5 beds 4 baths4,029 sq. ft.
7356 S Bannock Dr, Littleton, CO 80120
MLS# 4115528Listed by: Compass - Denver - Open Fri, 3am to 5pmNew
 $599,000Active4 beds 2 baths2,280 sq. ft.
8985 W Euclid Ave, Littleton, CO 80123
MLS# 8400983Listed by: Keller Williams DTC - Coming Soon
 $900,000Coming Soon5 beds 4 baths
7356 S Bannock Drive, Littleton, CO 80120
MLS# 4115528Listed by: COMPASS - DENVER - Coming SoonOpen Fri, 3am to 5pm
 $599,000Coming Soon4 beds 2 baths
8985 W Euclid Avenue, Littleton, CO 80123
MLS# 8400983Listed by: KELLER WILLIAMS DTC - New
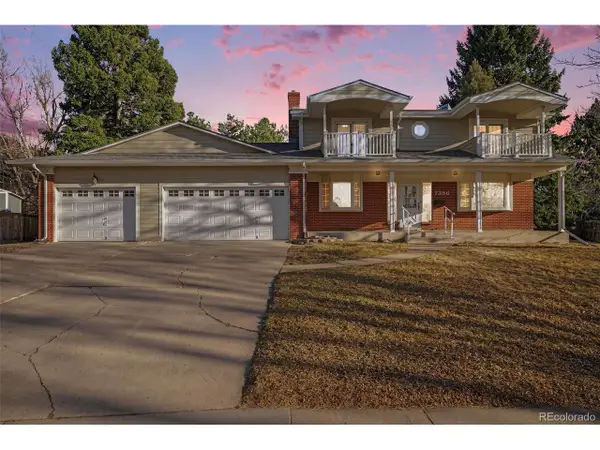
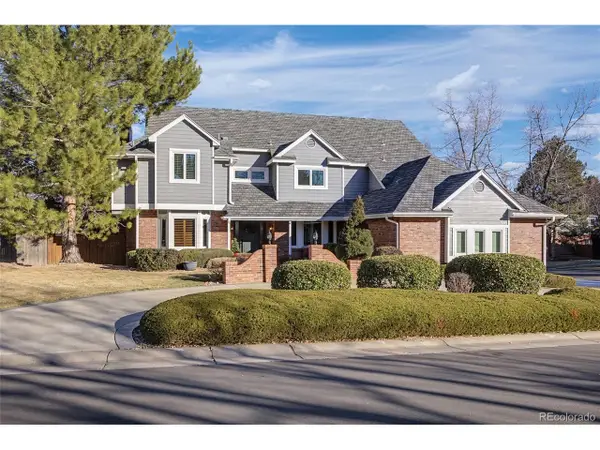
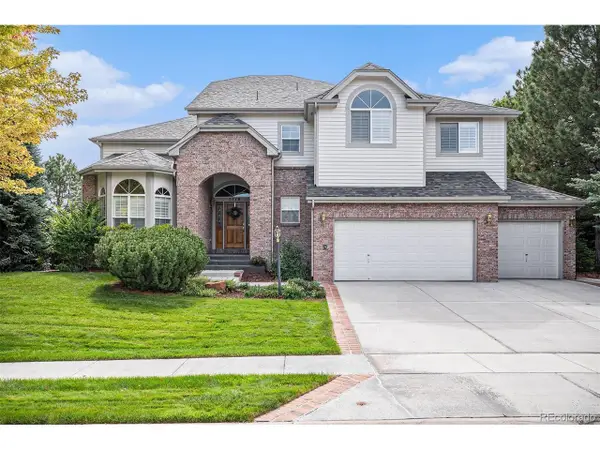 $1,590,000Active5 beds 5 baths5,162 sq. ft.
5770 S Benton Cir, Littleton, CO 80123
MLS# 7893417Listed by: Landmark Residential Brokerage - New
 $710,000Active4 beds 3 baths3,042 sq. ft.
6273 S Marshall Ct, Littleton, CO 80123
MLS# 2844708Listed by: RE/MAX Alliance - New
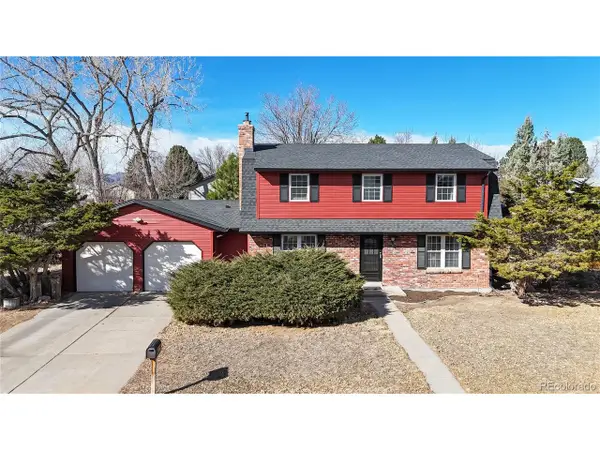
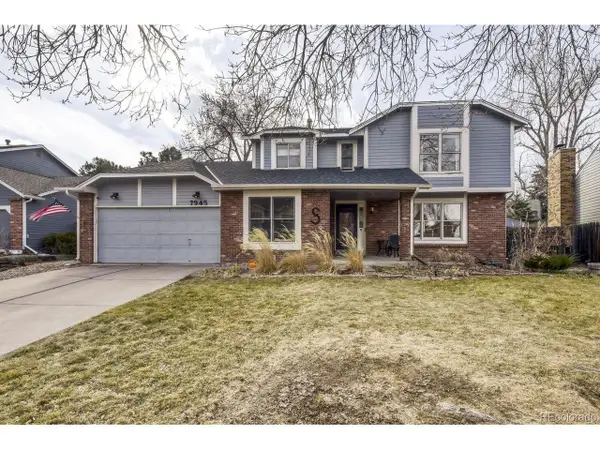 $749,900Active4 beds 3 baths3,349 sq. ft.
7945 S Elati Cir, Littleton, CO 80120
MLS# 8653523Listed by: Infinity Group Realty Denver - New
 $725,000Active3 beds 3 baths2,623 sq. ft.
5485 S Harlan Way, Littleton, CO 80123
MLS# 7357864Listed by: Redfin Corporation - New
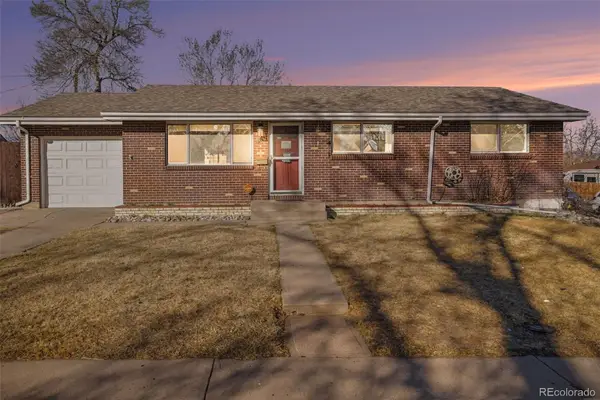
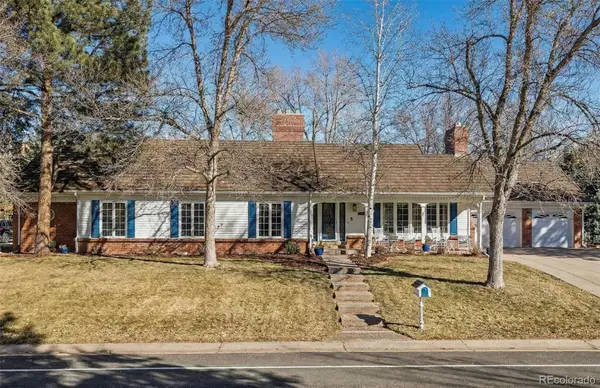
 $595,000Active3 beds 1 baths1,010 sq. ft.
1454 W Lake Ave, Littleton, CO 80120
MLS# 4900069Listed by: Compass - Denver - New
 $685,000Active5 beds 2 baths2,300 sq. ft.
6158 S Westview St, Littleton, CO 80120
MLS# 5977146Listed by: Compass - Denver - New
 $499,900Active3 beds 2 baths1,736 sq. ft.
5634 S Huron St, Littleton, CO 80120
MLS# 6958281Listed by: Madison & Company Properties - New
 $1,120,000Active4 beds 3 baths4,758 sq. ft.
5013 S Allison Way, Littleton, CO 80123
MLS# 1743773Listed by: Dynamic Dwellings LLC - New
 $3,200,000Active6 beds 5 baths6,353 sq. ft.
4443 W Cottonwood Place, Littleton, CO 80123
MLS# 9342139Listed by: LIV SOTHEBY'S INTERNATIONAL REALTY - New
 $575,000Active3 beds 2 baths1,567 sq. ft.
4902 S Garland St, Littleton, CO 80123
MLS# 7748174Listed by: JPAR Modern Real Estate - New
 $625,000Active3 beds 2 baths1,164 sq. ft.
5556 S Elmwood St, Littleton, CO 80120
MLS# 7133009Listed by: Compass - Denver - New
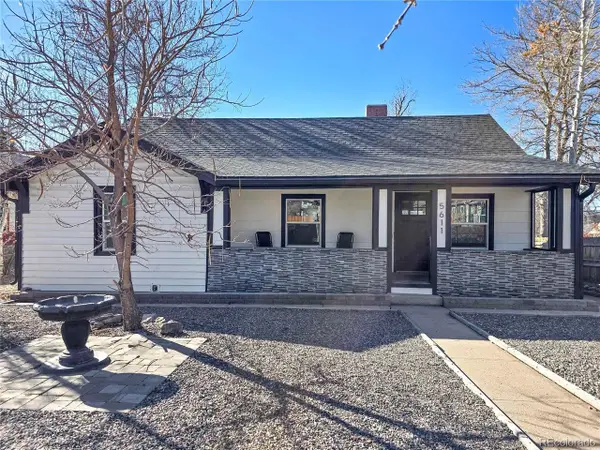 $650,000Active4 beds 2 baths2,155 sq. ft.
5611 S Cedar St, Littleton, CO 80120
MLS# 5169344Listed by: West and Main Homes Inc - New
 $649,000Active4 beds 2 baths1,100 sq. ft.
1464 W Lake Ave, Littleton, CO 80120
MLS# 5842273Listed by: Compass - Denver - New
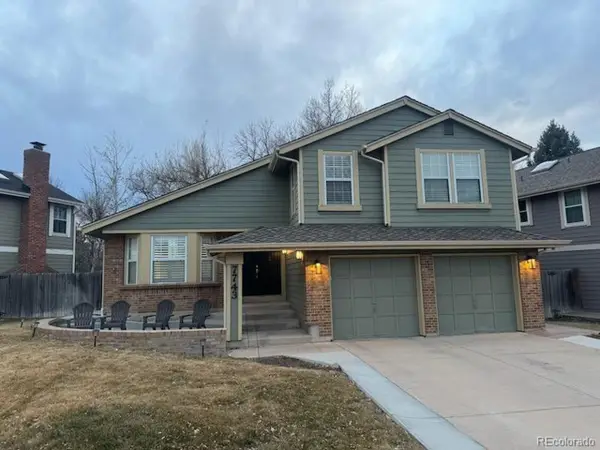 $775,000Active3 beds 3 baths2,530 sq. ft.
7743 S Nevada Dr, Littleton, CO 80120
MLS# 8938779Listed by: RE/MAX Professionals - New
 $639,000Active3 beds 3 baths2,084 sq. ft.
805 W Peakview Circle, Littleton, CO 80120
MLS# 6592584Listed by: RE/MAX PROFESSIONALS - New
 $849,950Active3 beds 3 baths3,233 sq. ft.
6700 W Dorado Drive #9, Littleton, CO 80123
MLS# 5697352Listed by: RE/MAX PROFESSIONALS - New
 $499,000Active3 beds 1 baths1,160 sq. ft.
3374 W Belmont Ave, Littleton, CO 80123
MLS# 3715301Listed by: Orchard Brokerage LLC - New
 $1,199,000Active6 beds 5 baths5,212 sq. ft.
9536 W Avalon Dr, Littleton, CO 80127
MLS# 6112308Listed by: RE/MAX Professionals - New
 $3,495,000Active6 beds 6 baths6,559 sq. ft.
5899 Green Oaks Drive, Littleton, CO 80121
MLS# 8953646Listed by: KELLER WILLIAMS DTC - New
 $1,792,000Active5 beds 5 baths5,225 sq. ft.
5960 Blue Sage Way, Littleton, CO 80123
MLS# 1717855Listed by: The Fullerton Team - New
 $2,295,000Active6 beds 5 baths5,950 sq. ft.
72 Fairway Lane, Littleton, CO 80123
MLS# 2071757Listed by: RE/MAX PROFESSIONALS - New
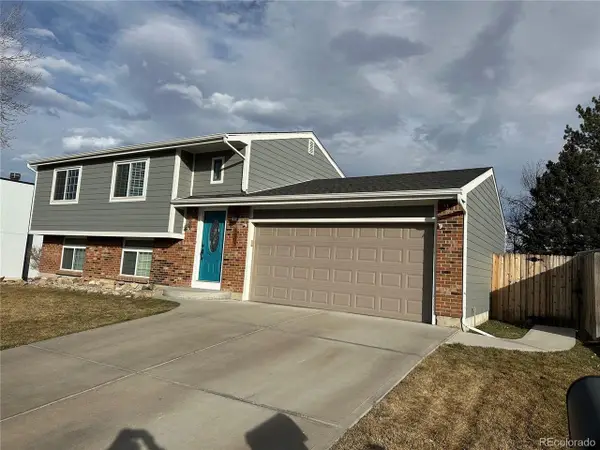
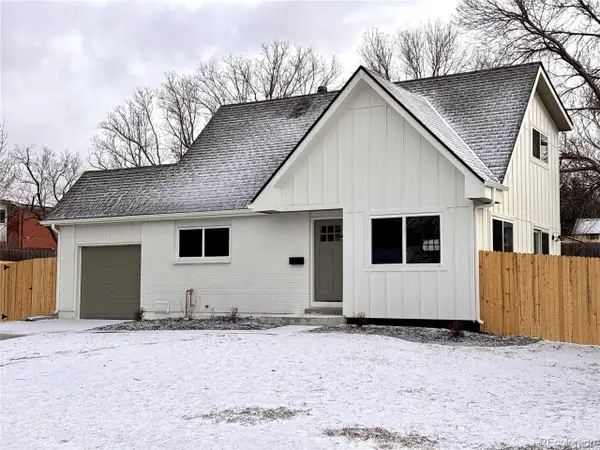
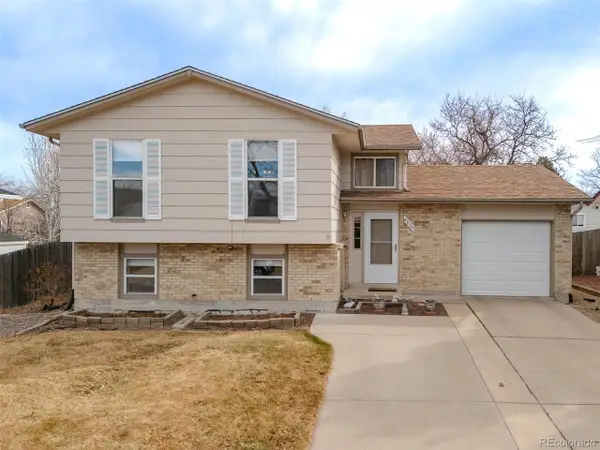 $579,000Active4 beds 2 baths1,635 sq. ft.
4894 S Jellison St, Littleton, CO 80123
MLS# 7229710Listed by: Lunnon Realty - New
 $1,028,000Active6 beds 5 baths3,595 sq. ft.
9713 W Avalon Pl, Littleton, CO 80127
MLS# 8992555Listed by: Dubrova and Associate LLC - New
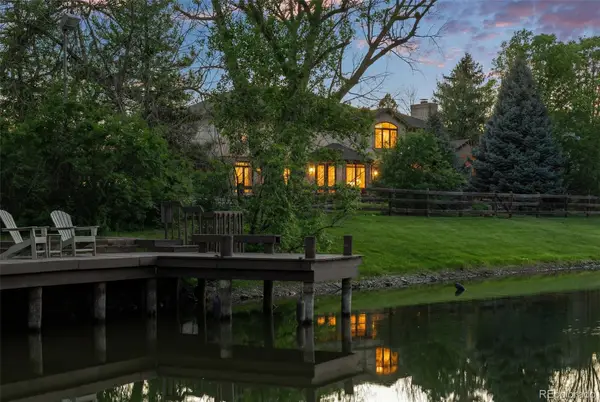
 $4,300,000Active4 beds 5 baths5,486 sq. ft.
4900 Lakeshore Dr, Littleton, CO 80123
MLS# 9581067Listed by: RE/MAX Professionals - New
 $940,000Active3 beds 3 baths3,978 sq. ft.
6534 S Chase Street, Littleton, CO 80123
MLS# 2063698Listed by: THE STELLER GROUP, INC 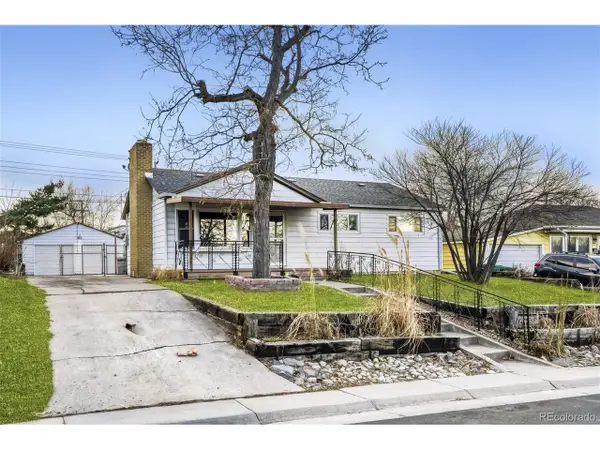 $549,900Active3 beds 2 baths2,498 sq. ft.
5291 S Sherman St, Littleton, CO 80121
MLS# 4446283Listed by: Keller Williams Advantage Realty LLC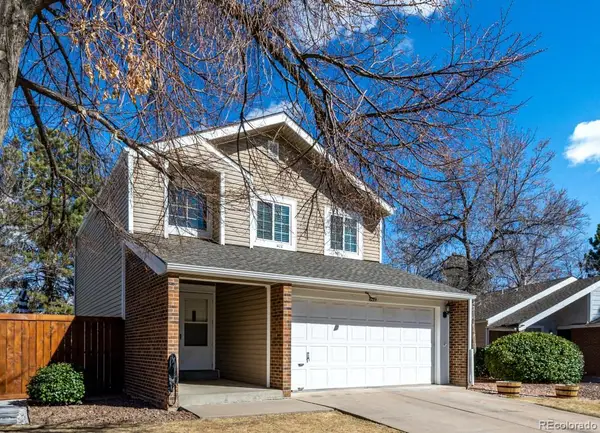 $575,000Active3 beds 3 baths1,852 sq. ft.
639 W Jamison Circle, Littleton, CO 80120
MLS# 9800081Listed by: KELLER WILLIAMS ADVANTAGE REALTY LLC $75,000Active3 beds 2 baths1,632 sq. ft.
6527 S Flower Street, Littleton, CO 80123
MLS# 8732890Listed by: RE/MAX ALLIANCE $850,000Active5 beds 4 baths3,122 sq. ft.
5134 S Perry Street, Littleton, CO 80123
MLS# 6174586Listed by: KELLER WILLIAMS DTC $720,000Active4 beds 2 baths2,424 sq. ft.
6123 S Datura St, Littleton, CO 80120
MLS# 2964279Listed by: EXIT Mosaic Realty $540,000Active3 beds 2 baths1,510 sq. ft.
800 E Pinewood Avenue, Littleton, CO 80121
MLS# 2966134Listed by: COMPASS - DENVER $525,000Active3 beds 2 baths1,972 sq. ft.
5810 S Greenwood Street, Littleton, CO 80120
MLS# 7257627Listed by: ROCKY MOUNTAIN REAL ESTATE INC $650,000Active4 beds 2 baths2,250 sq. ft.
5830 S Delaware St, Littleton, CO 80120
MLS# 9425296Listed by: Real Broker, LLC DBA Real $820,000Active4 beds 3 baths2,700 sq. ft.
342 W Caley Ave, Littleton, CO 80120
MLS# 1812131Listed by: Compass - Denver $720,000Active3 beds 3 baths1,519 sq. ft.
5641 S Hickory Street, Littleton, CO 80120
MLS# 2683030Listed by: MADISON & COMPANY PROPERTIES $1,100,000Active4 beds 3 baths4,665 sq. ft.
885 Front Range Road, Littleton, CO 80120
MLS# 7030860Listed by: KENTWOOD REAL ESTATE CHERRY CREEK- $740,000Active4 beds 2 baths2,128 sq. ft.
6521 S Cedar St, Littleton, CO 80120
MLS# 3228758Listed by: Payan Realty 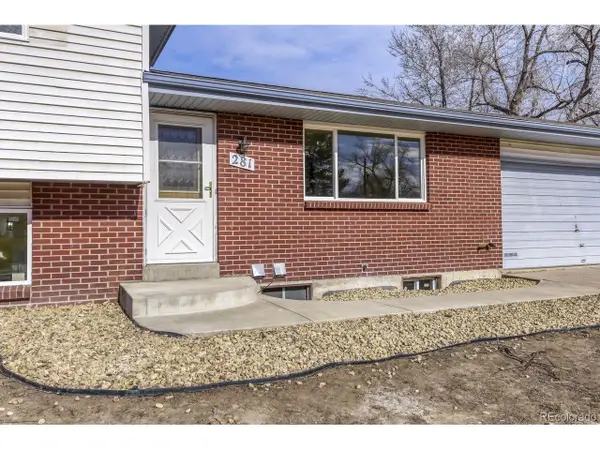 $625,000Active5 beds 2 baths2,320 sq. ft.
281 W Acoma Dr, Littleton, CO 80120
MLS# 4689368Listed by: MB Marston and Blue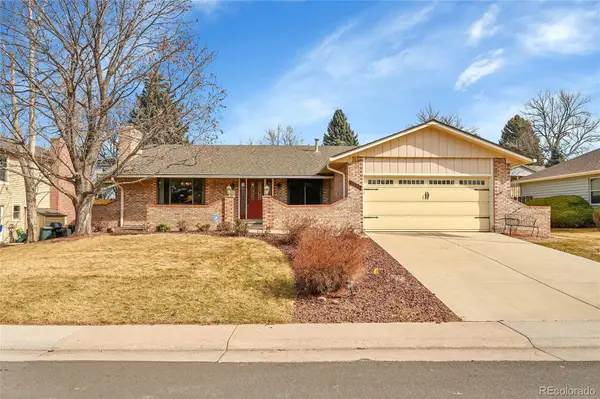 $855,000Active5 beds 3 baths3,536 sq. ft.
7252 S Costilla Street, Littleton, CO 80120
MLS# 6650483Listed by: KELLER WILLIAMS ADVANTAGE REALTY LLC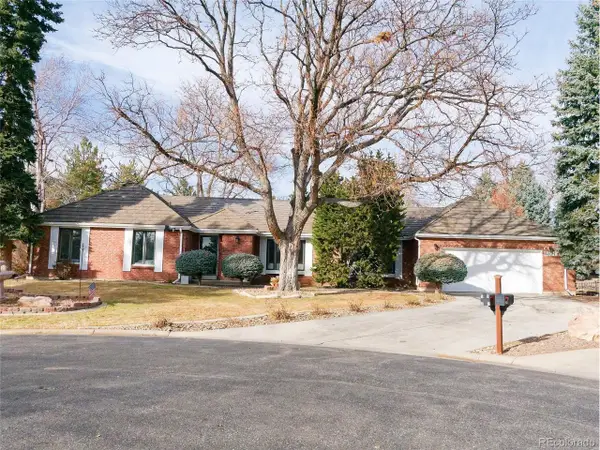 $1,329,900Active4 beds 4 baths3,268 sq. ft.
5927 S Yates Ct, Littleton, CO 80123
MLS# 4475122Listed by: LPT Realty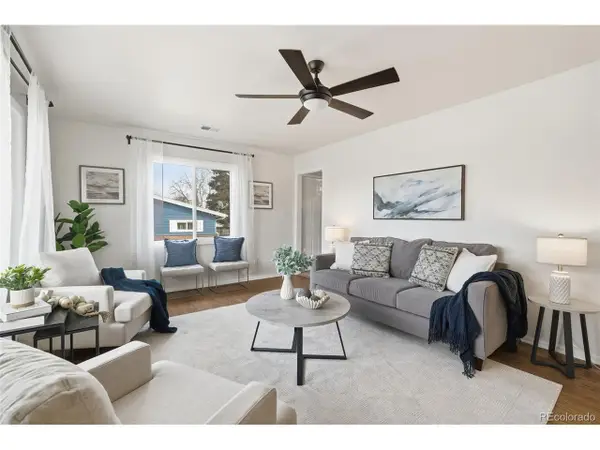 $549,900Active5 beds 2 baths2,340 sq. ft.
3370 W Belleview Ave, Littleton, CO 80123
MLS# 4832660Listed by: eXp Realty, LLC $595,000Active3 beds 1 baths1,010 sq. ft.
1484 W Lake Avenue, Littleton, CO 80120
MLS# 7739318Listed by: COMPASS - DENVER $859,900Active6 beds 4 baths4,223 sq. ft.
4411 W Jamison Pl, Littleton, CO 80128
MLS# 4038646Listed by: First Integrity Home Buyers $1,150,000Active6 beds 4 baths4,316 sq. ft.
2480 W Jamison Way, Littleton, CO 80120
MLS# 3973843Listed by: eXp Realty, LLC $649,950Active5 beds 2 baths2,096 sq. ft.
3509 W Alamo Place, Littleton, CO 80123
MLS# 6180148Listed by: RE/MAX PROFESSIONALS $600,000Pending5 beds 3 baths2,592 sq. ft.
6852 S Greenwood St, Littleton, CO 80120
MLS# 3567766Listed by: The Agency - Denver $595,000Active5 beds 3 baths1,992 sq. ft.
3504 W Alamo Drive, Littleton, CO 80123
MLS# 5948940Listed by: 8Z REAL ESTATE $950,000Active4 beds 3 baths2,901 sq. ft.
2273 W Parkhill Avenue, Littleton, CO 80120
MLS# 9620424Listed by: RE/MAX OF CHERRY CREEK $775,000Active5 beds 4 baths2,612 sq. ft.
1148 W Hinsdale Drive, Littleton, CO 80120
MLS# 9275363Listed by: RE/MAX PROFESSIONALS $1,175,000Active4 beds 3 baths2,900 sq. ft.
7475 S Houstoun Waring Circle, Littleton, CO 80120
MLS# 7107556Listed by: MILEHIMODERN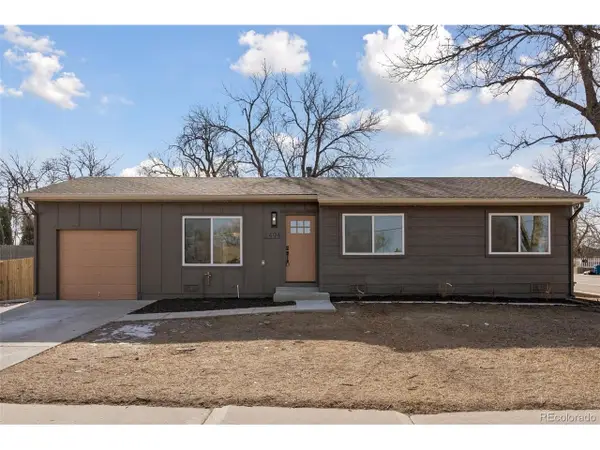 $595,000Active3 beds 1 baths1,018 sq. ft.
1494 W Lake Ave, Littleton, CO 80120
MLS# 5925466Listed by: Compass - Denver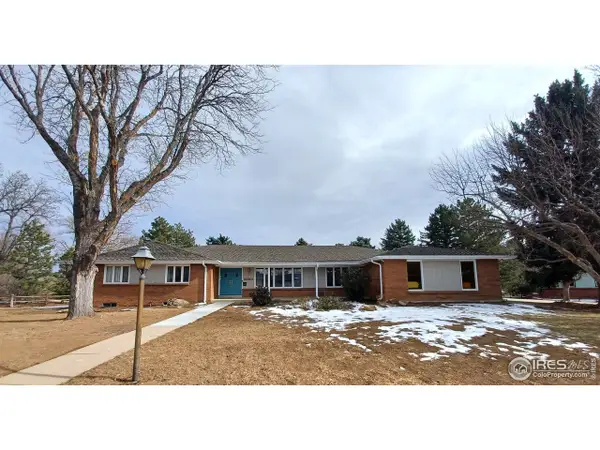 $1,500,000Active5 beds 3 baths4,086 sq. ft.
5860 Wood Sorrel Dr, Littleton, CO 80123
MLS# 1050729Listed by: The Home Brokers LLC $595,000Pending3 beds 4 baths3,505 sq. ft.
7290 S Sundown Cir, Littleton, CO 80120
MLS# 6661630Listed by: RE/MAX Professionals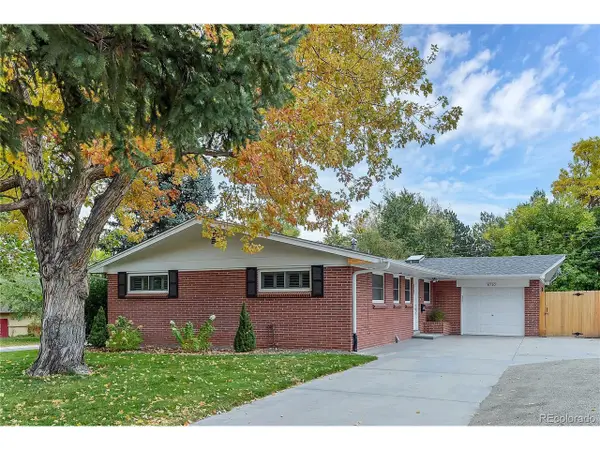 $687,000Pending3 beds 3 baths1,682 sq. ft.
6710 S Foresthill St, Littleton, CO 80120
MLS# 9286823Listed by: Real Estate Investment Advisors, LLC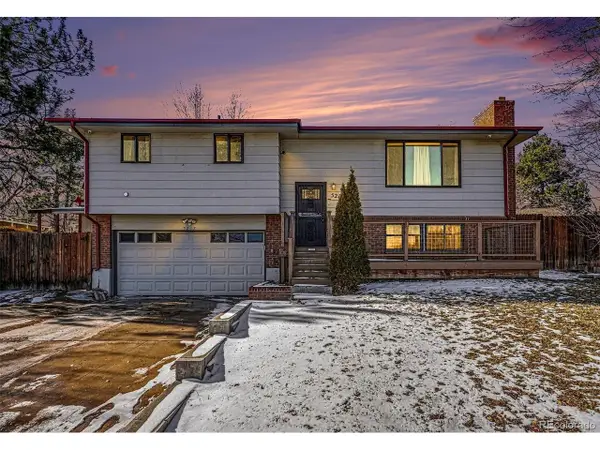 $595,000Active3 beds 2 baths1,672 sq. ft.
5217 S Mabre Ct, Littleton, CO 80123
MLS# 8629565Listed by: Madison & Company Properties $725,000Pending5 beds 3 baths3,297 sq. ft.
3647 W Grand Avenue, Littleton, CO 80123
MLS# 8756080Listed by: KELLER WILLIAMS PREFERRED REALTY $2,780,000Active6 beds 6 baths5,879 sq. ft.
725 Front Range Road, Littleton, CO 80120
MLS# 2324350Listed by: EQUITY COLORADO REAL ESTATE $545,000Pending4 beds 4 baths2,184 sq. ft.
995 W Peakview Circle, Littleton, CO 80120
MLS# 8692334Listed by: UNITED REAL ESTATE PRESTIGE DENVER $575,000Active3 beds 2 baths3,024 sq. ft.
7885 S Logan St, Littleton, CO 80122
MLS# 5438323Listed by: Realty One Group Premier Colorado $699,900Active4 beds 3 baths2,182 sq. ft.
707 W Easter Avenue, Littleton, CO 80120
MLS# 1698602Listed by: KELLER WILLIAMS DTC $1,025,000Active5 beds 4 baths3,415 sq. ft.
9641 W Belfast Dr, Littleton, CO 80127
MLS# 7738792Listed by: RE/MAX Professionals $649,500Active5 beds 3 baths2,240 sq. ft.
5455 S Knox Court, Littleton, CO 80123
MLS# 7386440Listed by: YOUR CASTLE REAL ESTATE INC $700,000Active5 beds 4 baths3,228 sq. ft.
8230 S Ogden Circle, Littleton, CO 80122
MLS# 7121860Listed by: DISTINCTIVE HOMES AND LIVING $555,000Pending5 beds 2 baths2,416 sq. ft.
6148 S Westview St, Littleton, CO 80120
MLS# 8667794Listed by: eXp Realty, LLC $829,500Active4 beds 3 baths3,015 sq. ft.
9788 S Johnson Way, Littleton, CO 80127
MLS# 9749599Listed by: JAMES COLEMAN $650,000Active2 beds 3 baths2,249 sq. ft.
5687 S Foresthill Street, Littleton, CO 80120
MLS# 6809954Listed by: LUX REAL ESTATE COMPANY ERA POWERED $650,000Active4 beds 3 baths2,542 sq. ft.
3396 W Arlington Avenue, Littleton, CO 80123
MLS# 9335123Listed by: GUIDE REAL ESTATE $925,000Pending2 beds 4 baths4,280 sq. ft.
8292 S Peninsula Drive, Littleton, CO 80120
MLS# 3503054Listed by: MB HAUSCHILD &CO $935,000Active5 beds 3 baths3,644 sq. ft.
2002 W Ridge Road, Littleton, CO 80120
MLS# 9810344Listed by: COMPASS - DENVER $1,145,000Active5 beds 4 baths4,616 sq. ft.
7265 S Sundown Circle, Littleton, CO 80120
MLS# 3953764Listed by: DENVER REALTY AND HOMES $949,000Active4 beds 4 baths2,857 sq. ft.
7604 S Datura Circle W, Littleton, CO 80120
MLS# 3837620Listed by: CAMBER REALTY, LTD $639,900Active4 beds 2 baths2,041 sq. ft.
6689 S Delaware St, Littleton, CO 80120
MLS# 6925869Listed by: LoKation Real Estate $649,000Active5 beds 4 baths2,286 sq. ft.
8274 S Ogden Cir, Littleton, CO 80122
MLS# 2245279Listed by: Resident Realty North Metro LLC $415,000Active2 beds 1 baths840 sq. ft.
5644 S Huron Street, Littleton, CO 80120
MLS# 3431972Listed by: REALTY ONE GROUP PREMIER $1,250,000Active6 beds 4 baths4,357 sq. ft.
4431 W Jamison Place, Littleton, CO 80128
MLS# 2366987Listed by: COLDWELL BANKER GLOBAL LUXURY DENVER $2,850,000Active4 beds 6 baths7,058 sq. ft.
7175 S Polo Ridge Drive, Littleton, CO 80128
MLS# 9083191Listed by: MADISON & COMPANY PROPERTIES $525,000Active4 beds 2 baths1,811 sq. ft.
6483 S Elati Street, Littleton, CO 80120
MLS# 3380701Listed by: INVALESCO REAL ESTATE $1,175,000Active5 beds 4 baths3,326 sq. ft.
6127 S Coventry Lane, Littleton, CO 80123
MLS# 6986939Listed by: EXP REALTY, LLC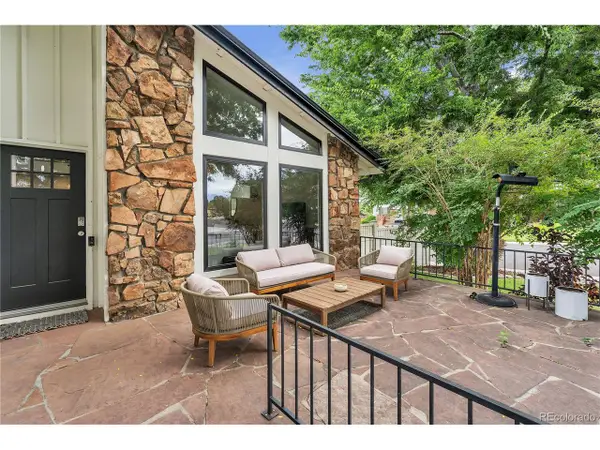 $899,000Pending6 beds 4 baths2,936 sq. ft.
7391 S Costilla St, Littleton, CO 80120
MLS# 1887596Listed by: Compass - Denver $2,399,000Active6 beds 7 baths7,529 sq. ft.
1300 W Caley Ave, Littleton, CO 80120
MLS# 6719490Listed by: Engel & Volkers Denver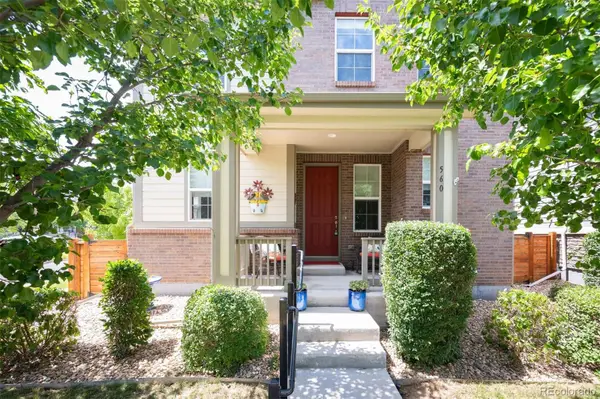 $850,000Active4 beds 4 baths3,331 sq. ft.
560 E Fremont Place, Littleton, CO 80122
MLS# 8839242Listed by: LIV SOTHEBY'S INTERNATIONAL REALTY $779,000Pending3 beds 4 baths3,107 sq. ft.
7909 S Bemis Street, Littleton, CO 80120
MLS# 7535076Listed by: RE/MAX PROFESSIONALS $675,000Active4 beds 3 baths1,848 sq. ft.
7120 S Clay St, Littleton, CO 80120
MLS# 7682710Listed by: Redfin Corporation $824,900Active4 beds 3 baths3,071 sq. ft.
9610 S Dover Way, Littleton, CO 80127
MLS# 4838239Listed by: DUBROVA AND ASSOCIATE LLC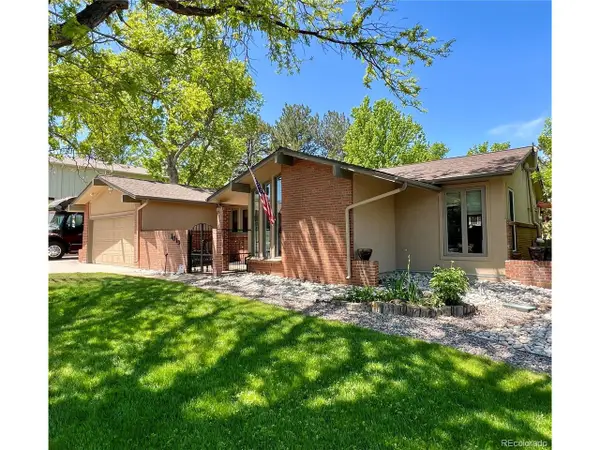 $845,000Active5 beds 3 baths3,414 sq. ft.
7019 S Windermere St, Littleton, CO 80120
MLS# 3005589Listed by: Rocky Mountain Real Estate Inc $1,549,000Active6 beds 3 baths4,874 sq. ft.
2606 W Alamo Ave, Littleton, CO 80120
MLS# 1935408Listed by: eXp Realty, LLC
Local realty services provided by:CENTURY 21 Cornerstone, CENTURY 21 Trenka Real Estate
The real estate listing information and related content displayed on this site is provided exclusively for consumer's personal, non-commercial use and may not be used for any purpose other than to identify prospective properties consumers may be interested in purchasing. This information and related content is deemed reliable but is not guaranteed accurate by Information and Real Estate Services, LLC.
Information source: Information and Real Estate Services, LLC. Provided for limited non-commercial use only under IRES Rules © Copyright IRES. The information being provided by Information and Real Estate Services is for the consumer's personal, non-commercial use and may not be used for any purpose other than to identify prospective properties consumer may be interested in purchasing. Any information relating to real estate for sale referenced on this web site comes from the Internet Data Exchange (IDX) program of the Information and Real Estate Services. This web site may reference real estate listing(s) held by a brokerage firm other than the broker and/or agent who owns this web site.
The accuracy of all information, regardless of source, including but not limited to open house information, square footages and lot sizes, is deemed reliable but not guaranteed and should be personally verified through personal inspection by and/or with the appropriate professionals. The data contained herein is copyrighted by Information and Real Estate Services and is protected by all applicable copyright laws. Any unauthorized dissemination of this information is in violation of copyright laws and is strictly prohibited.
Based on information submitted to the MLS GRID as of February 25, 2026 04:39 AM. All data is obtained from various sources and may not have been verified by broker or MLS GRID. Supplied Open House information is subject to change without notice. All information should be independently reviewed and verified for accuracy. Properties may or may not be listed by the office/agent presenting the information.
Neighborhoods near Littleton, CO
Zip codes near Littleton, CO
- 80110 homes for sale
- 80111 homes for sale
- 80113 homes for sale
- 80120 homes for sale
- 80121 homes for sale
- 80122 homes for sale
- 80123 homes for sale
- 80126 homes for sale
- 80128 homes for sale
- 80129 homes for sale
- 80130 homes for sale
- 80210 homes for sale
- 80219 homes for sale
- 80222 homes for sale
- 80223 homes for sale
- 80227 homes for sale
- 80232 homes for sale
- 80235 homes for sale
- 80236 homes for sale
- 80237 homes for sale
Popular searches near Littleton, CO
- Acres Green homes for sale
- Bow Mar homes for sale
- Centennial homes for sale
- Cherry Creek homes for sale
- Cherry Hills Village homes for sale
- Columbine homes for sale
- Columbine Valley homes for sale
- Dakota Ridge homes for sale
- Englewood homes for sale
- Greenwood Village homes for sale
- Highlands Ranch homes for sale
- Holly Hills homes for sale
- Inverness homes for sale
- Ken Caryl homes for sale
- Lakewood homes for sale
- Littleton homes for sale
- Lone Tree homes for sale
- Sheridan homes for sale
- Southwest Arapahoe homes for sale
- Sterling Ranch homes for sale
Protect your home and budget from life's surprises with an Assurant Home Warranty, backed by a partner that supports you through every step of homeownership. Explore Plans.
©2026 Century 21 Real Estate LLC. All rights reserved. CENTURY 21®, the CENTURY 21 Logo and C21® are service marks owned by Century 21 Real Estate LLC. Century 21 Real Estate LLC fully supports the principles of the Fair Housing Act and the Equal Opportunity Act. Each office is independently owned and operated. Listing information is deemed reliable but not guaranteed accurate.