- Bluffwood, Iowa City homes for sale
- College Green, Iowa City homes for sale
- Creekside, Iowa City homes for sale
- Downtown, Iowa City homes for sale
- Eastside, Iowa City homes for sale
- Goose Town, Iowa City homes for sale
- Longfellow, Iowa City homes for sale
- Lucas Farms, Iowa City homes for sale
- Manville Heights, Iowa City homes for sale
- Miller-Orchard, Iowa City homes for sale
- Morningside-Glendale, Iowa City homes for sale
- Peninsula Area, Iowa City homes for sale
- Pepperwood, Iowa City homes for sale
- Rochester, Iowa City homes for sale
- South Downtown, Iowa City homes for sale
- The University of Iowa, Iowa City homes for sale
- Ty N Cae, Iowa City homes for sale
- Washington Hills, Iowa City homes for sale
- Westside, Iowa City homes for sale
- Windsor Ridge, Iowa City homes for sale
Lockridge, IA - homes for sale
2 of 2 results displayed
- New
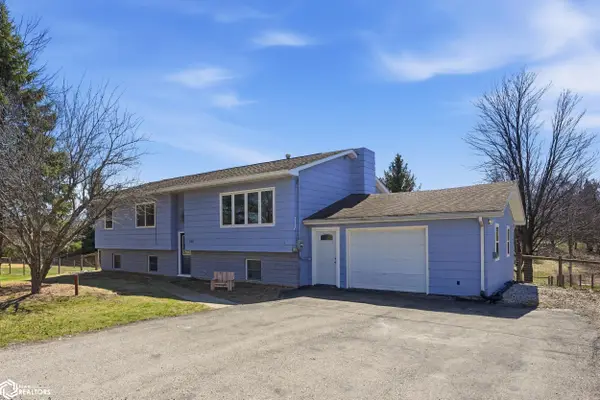 $240,000Active4 beds 2 baths2,363 sq. ft.
105 E Main Street, Lockridge, IA 52635
MLS# 6336562Listed by: COTTAGE REALTY 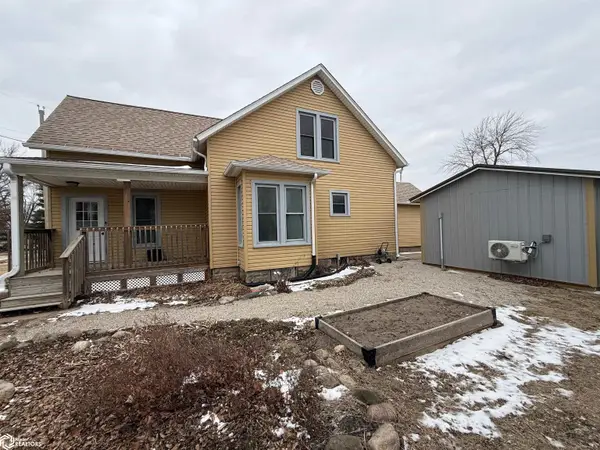 $110,000Pending3 beds 1 baths1,445 sq. ft.
309 W Main Street, Lockridge, IA 52635
MLS# 6335337Listed by: FAIRFIELD REAL ESTATE
Local realty services provided by:CENTURY 21 BW Preferred, Inc.
Neighborhoods near Lockridge, IA
Zip codes near Lockridge, IA
- 52248 homes for sale
- 52353 homes for sale
- 52533 homes for sale
- 52540 homes for sale
- 52551 homes for sale
- 52554 homes for sale
- 52556 homes for sale
- 52560 homes for sale
- 52565 homes for sale
- 52621 homes for sale
- 52625 homes for sale
- 52626 homes for sale
- 52635 homes for sale
- 52638 homes for sale
- 52641 homes for sale
- 52645 homes for sale
- 52655 homes for sale
- 52656 homes for sale
- 52659 homes for sale
- 52738 homes for sale
Popular searches near Lockridge, IA
- Baltimore homes for sale
- Brighton homes for sale
- Center homes for sale
- Center homes for sale
- Crawford homes for sale
- Crawfordsville homes for sale
- Douds homes for sale
- Fairfield homes for sale
- Keosauqua homes for sale
- Lockridge township homes for sale
- Maharishi Vedic City homes for sale
- Mt Pleasant homes for sale
- New London township homes for sale
- New London homes for sale
- Scott homes for sale
- Tippecanoe homes for sale
- Van Buren homes for sale
- Washington homes for sale
- Wayne homes for sale
- Winfield homes for sale
Protect your home and budget from life's surprises with an Assurant Home Warranty, backed by a partner that supports you through every step of homeownership. Explore Plans.
©2026 Century 21 Real Estate LLC. All rights reserved. CENTURY 21®, the CENTURY 21 Logo and C21® are service marks owned by Century 21 Real Estate LLC. Century 21 Real Estate LLC fully supports the principles of the Fair Housing Act and the Equal Opportunity Act. Each office is independently owned and operated. Listing information is deemed reliable but not guaranteed accurate.