- Atlanta Country Club, Marietta homes for sale
- Brookhaven, Atlanta homes for sale
- Buckhead, Atlanta homes for sale
- Chastain Park, Atlanta homes for sale
- East Chastain Park, Atlanta homes for sale
- Glenridge Hammond, Atlanta homes for sale
- Merlandale, Atlanta homes for sale
- Mt. Paran, Atlanta homes for sale
- Mount Vernon Woods, Atlanta homes for sale
- Mountaire Springs, Atlanta homes for sale
- North Buckhead, Atlanta homes for sale
- North Riverside, Atlanta homes for sale
- Northside Woods, Atlanta homes for sale
- Park Towers, Atlanta homes for sale
- Randall Mill, Atlanta homes for sale
- Ridgeview, Atlanta homes for sale
- Riverside, Atlanta homes for sale
- Sandy Springs ITP, Atlanta homes for sale
- South Tuxedo Park, Atlanta homes for sale
- Tuxedo Park, Atlanta homes for sale
Londenberry, Atlanta, GA - homes for sale
5 of 5 results displayed
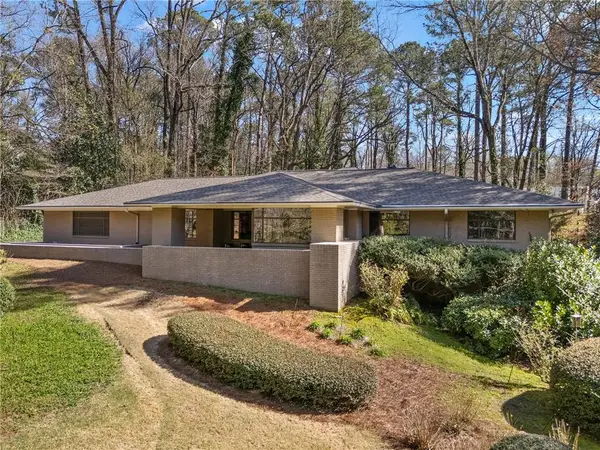 $1,425,000Pending4 beds 3 baths3,173 sq. ft.
374 Londonberry Road, Atlanta, GA 30327
MLS# 7736916Listed by: ATLANTA FINE HOMES SOTHEBY'S INTERNATIONAL
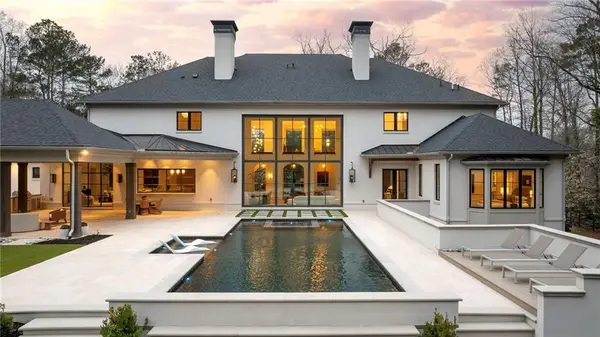 $8,170,000Active6 beds 11 baths11,066 sq. ft.
5245 Kenbrook Way, Sandy Springs, GA 30327
MLS# 7715744Listed by: ANSLEY REAL ESTATE | CHRISTIE'S INTERNATIONAL REAL ESTATE $4,494,900Active7 beds 10 baths12,256 sq. ft.
453 Londonberry Road, Atlanta, GA 30327
MLS# 10686233Listed by: Keller Williams Atlanta Classic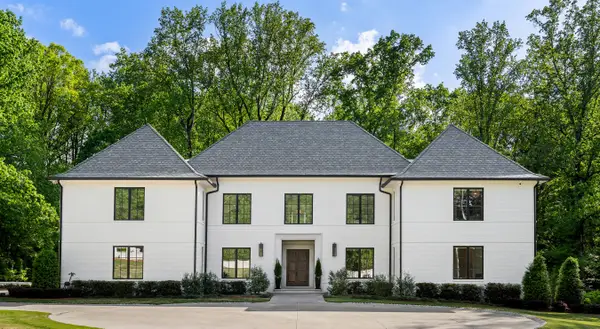 $5,750,000Active8 beds 9 baths10,444 sq. ft.
5260 Long Island Drive Nw, Atlanta, GA 30327
MLS# 7704160Listed by: ATLANTA FINE HOMES SOTHEBY'S INTERNATIONAL $6,099,000Active6 beds 9 baths9,933 sq. ft.
388 Londonberry Road Nw, Sandy Springs, GA 30327
MLS# 7669272Listed by: ATLANTA FINE HOMES SOTHEBY'S INTERNATIONAL
Local realty services provided by:CENTURY 21 The Avenues, CENTURY 21 Novus
2026 Georgia MLS. All rights reserved. Information Deem Reliable But Not Guaranteed April 2, 2026
Popular neighborhoods near Londenberry, Atlanta, GA
Zip codes near Londenberry, Atlanta, GA
- 30067 homes for sale
- 30068 homes for sale
- 30080 homes for sale
- 30305 homes for sale
- 30309 homes for sale
- 30318 homes for sale
- 30319 homes for sale
- 30324 homes for sale
- 30326 homes for sale
- 30327 homes for sale
- 30328 homes for sale
- 30329 homes for sale
- 30338 homes for sale
- 30339 homes for sale
- 30341 homes for sale
- 30342 homes for sale
- 30346 homes for sale
- 30350 homes for sale
- 30360 homes for sale
- 30363 homes for sale
Counties near Londenberry, Atlanta, GA
- Barrow County homes for sale
- Bartow County homes for sale
- Cherokee County homes for sale
- Clayton County homes for sale
- Cobb County homes for sale
- Coweta County homes for sale
- Dawson County homes for sale
- DeKalb County homes for sale
- Douglas County homes for sale
- Fayette County homes for sale
- Forsyth County homes for sale
- Fulton County homes for sale
- Gwinnett County homes for sale
- Henry County homes for sale
- Newton County homes for sale
- Paulding County homes for sale
- Pickens County homes for sale
- Rockdale County homes for sale
- Spalding County homes for sale
- Walton County homes for sale
Protect your home and budget from life's surprises with an Assurant Home Warranty, backed by a partner that supports you through every step of homeownership. Explore Plans.
©2026 Century 21 Real Estate LLC. All rights reserved. CENTURY 21®, the CENTURY 21 Logo and C21® are service marks owned by Century 21 Real Estate LLC. Century 21 Real Estate LLC fully supports the principles of the Fair Housing Act and the Equal Opportunity Act. Each office is independently owned and operated. Listing information is deemed reliable but not guaranteed accurate.