- Avinger homes for sale
- Avinger homes for sale
- Bettie homes for sale
- Cason homes for sale
- Cookville homes for sale
- Daingerfield homes for sale
- Diana homes for sale
- Gilmer homes for sale
- Harleton homes for sale
- Hughes Springs homes for sale
- Hughes Springs-Avinger homes for sale
- Lake O' The Pines homes for sale
- Linden homes for sale
- Lone Star homes for sale
- Longview Northwest homes for sale
- Marietta homes for sale
- Omaha homes for sale
- Ore City homes for sale
- Pine Harbor homes for sale
- Pittsburg homes for sale
75668, TX - homes for sale
34 of 34 results displayed
- New
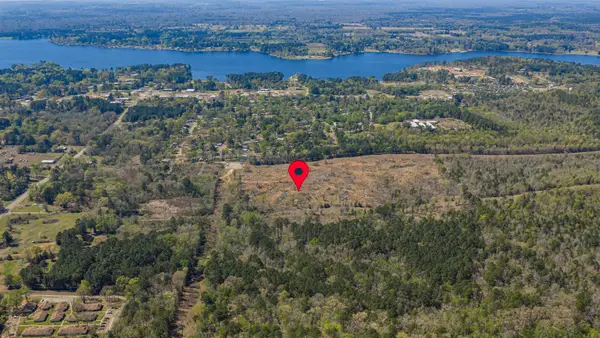 $255,000Active42.69 Acres
0000 Hillcrest Dr, Lone Star, TX 75668
MLS# 20262101Listed by: RAMSEY REALTY GROUP - New
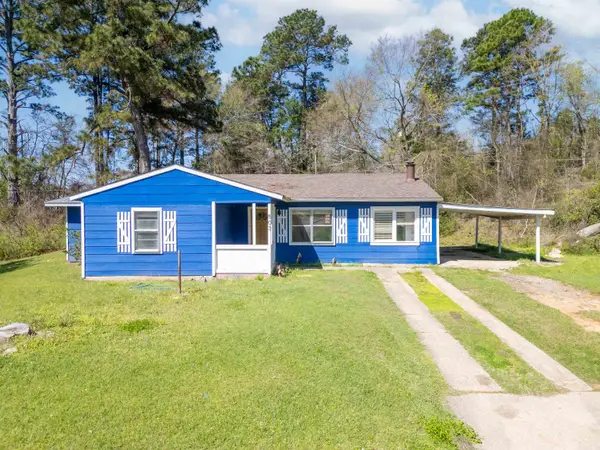 $130,000Active3 beds 3 baths1,404 sq. ft.
503 Bowie St, Lone Star, TX 75668
MLS# 20261924Listed by: TEXAS REAL ESTATE EXECUTIVES, THE DANIELS GROUP - GILMER 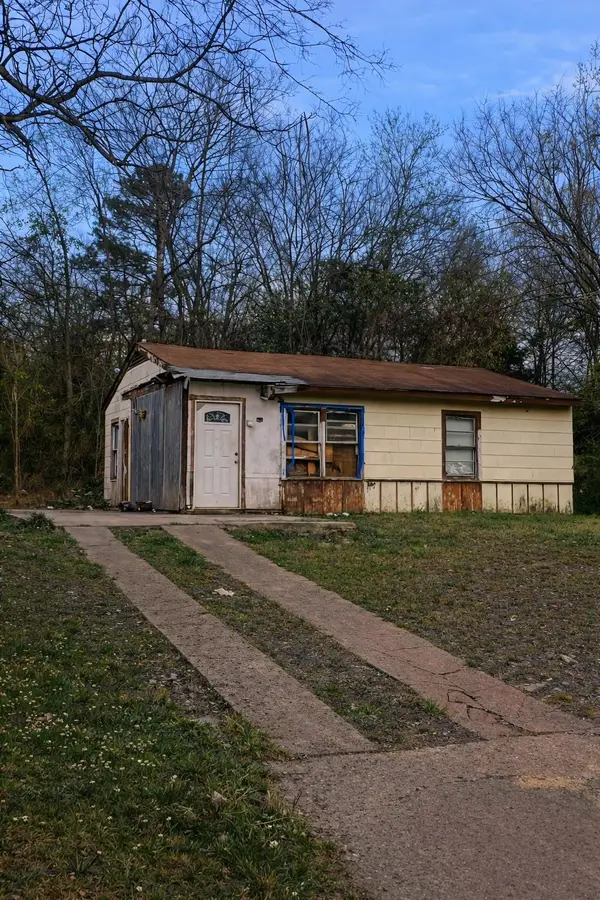 $21,000Active2 beds 1 baths840 sq. ft.
316 Houston Street, Lone Star, TX 75668
MLS# 59816201Listed by: LPT REALTY, LLC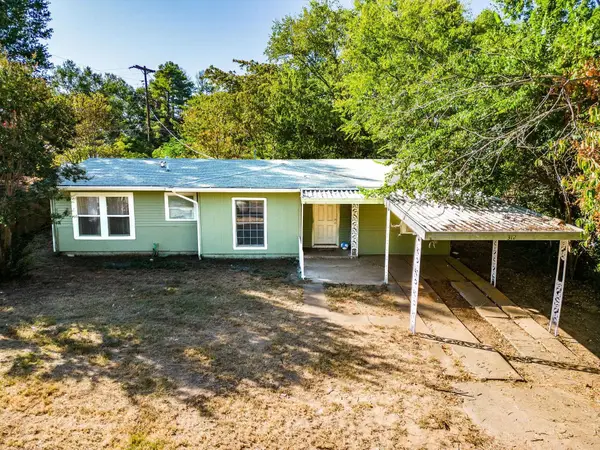 $126,900Active3 beds 1 baths864 sq. ft.
312 Germany Ave, Lone Star, TX 75668
MLS# 20261226Listed by: TEXAS REAL ESTATE EXECUTIVES, THE DANIELS GROUP - GILMER $79,000Active16.45 Acres
0 Hwy 155, Lone Star, TX 75668
MLS# 52534120Listed by: CAPITAL TRUST REALTY
 $39,900Active12.2 Acres
001 Highway 729, Lone Star, TX 75668
MLS# 20261069Listed by: CENTURY 21 PLATINUM PARTNERS $599,000Active-- beds 3 baths2,440 sq. ft.
300 Martin Street, Lone Star, TX 75668
MLS# 21179620Listed by: TEXAS REAL ESTATE EXECUTIVES, $145,000Active15 Acres
TBD CR 2307 BEASLEY RD, Lone Star, TX 75668
MLS# 26002012Listed by: EXP REALTY, LLC-AUSTIN $199,000Active0.42 Acres
TBD Cathy Street, Lone Star, TX 75668
MLS# 20260788Listed by: UNITED COUNTRY WALKER REALTY & AUCTION $882,000Active147 Acres
TBD Radio Rd, Lone Star, TX 75668
MLS# 20260736Listed by: UNITED COUNTRY WALKER REALTY & AUCTION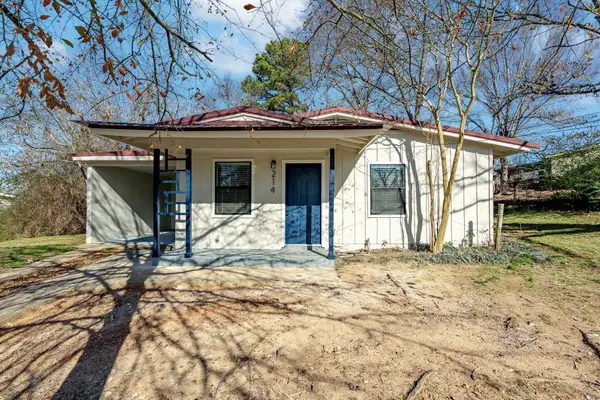 $107,900Active2 beds 1 baths964 sq. ft.
214 Randolph St, Lone Star, TX 75668
MLS# 20260698Listed by: TEXAS REAL ESTATE EXECUTIVES, THE DANIELS GROUP - GILMER $177,900Active4 beds 2 baths1,496 sq. ft.
236 Alamo St, Lone Star, TX 75668
MLS# 20260667Listed by: TEXAS REAL ESTATE EXECUTIVES, THE DANIELS GROUP - GILMER $375,000Active3 beds 3 baths1,883 sq. ft.
230 North Shore Circle, Lone Star, TX 75668
MLS# 20260644Listed by: UNITED COUNTRY WALKER REALTY & AUCTION $225,000Active4 beds 2 baths1,966 sq. ft.
4054 Lakeshore Dr, Lone Star, TX 75668
MLS# 26001367Listed by: ELEVATE HAVEN REALTY, LLC $84,500Active6.33 Acres
000 Jefferson Street/Lakeshore Dr, Lone Star, TX 75668
MLS# 20260571Listed by: CENTURY 21 PLATINUM PARTNERS $99,000Active14.86 Acres
TBD Willow Point Marina Road, Avinger, TX 75668
MLS# 21149481Listed by: MAYBEN REALTY, LLC $229,000Active3 beds 2 baths1,600 sq. ft.
321 Jefferson St, Lone Star, TX 75668
MLS# 20260143Listed by: TEXAS REAL ESTATE EXECUTIVES, THE DANIELS GROUP - GILMER $152,900Active2 beds 2 baths1,176 sq. ft.
210 GILBERT ST, Lone Star, TX 75668
MLS# 26000147Listed by: TEXAS REAL ESTATE EXECUTIVES-GILMER $263,000Active3 beds 2 baths2,500 sq. ft.
995 Old Coffeeville Rd, Lone Star, TX 75668
MLS# 20258034Listed by: TEXAS REAL ESTATE EXECUTIVES, THE DANIELS GROUP - GILMER $405,000Active2 beds 2 baths1,008 sq. ft.
299 Southshore Drive, Lone Star, TX 75668
MLS# 20257991Listed by: CASTILLO REALTY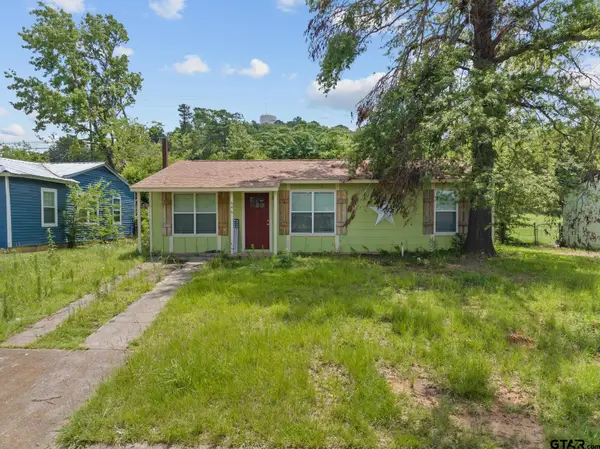 $105,000Pending3 beds 2 baths984 sq. ft.
646 N Northaven, Lone Star, TX 75668
MLS# 25016747Listed by: MAYBEN REALTY - PITTSBURG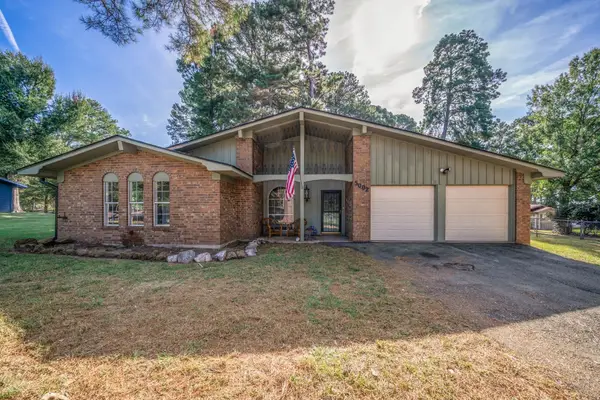 $254,000Active3 beds 2 baths1,398 sq. ft.
5002 Stevens St., Lone Star, TX 75668
MLS# 20257291Listed by: SUMMERS COOK & COMPANY $65,000Active3 beds 1 baths728 sq. ft.
212 Bryne Street, Lone Star, TX 75668
MLS# 20256417Listed by: UNITED COUNTRY WALKER REALTY & AUCTION $76,500Active2 beds 1 baths868 sq. ft.
310 Fannin, Lone Star, TX 75668
MLS# 20256008Listed by: L4 PROPERTY GROUP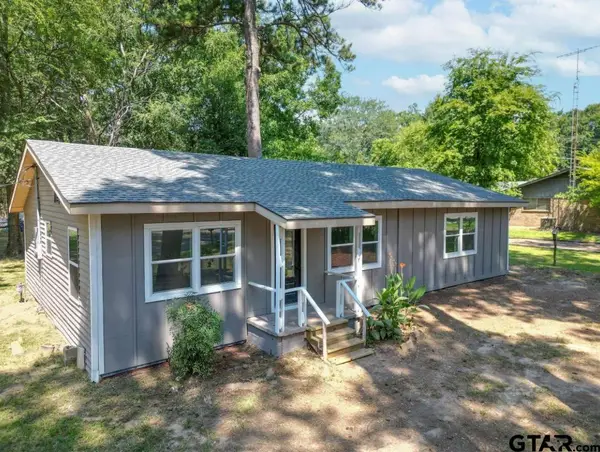 $207,000Active3 beds 2 baths1,530 sq. ft.
4052 LAKESHORE DR, Lone Star, TX 75668
MLS# 25012489Listed by: TEXAS REAL ESTATE EXECUTIVES-GILMER $229,000Active3 beds 2 baths1,500 sq. ft.
1205 Hillcrest Ave, Lone Star, TX 75668
MLS# 118458Listed by: Toler Group Realty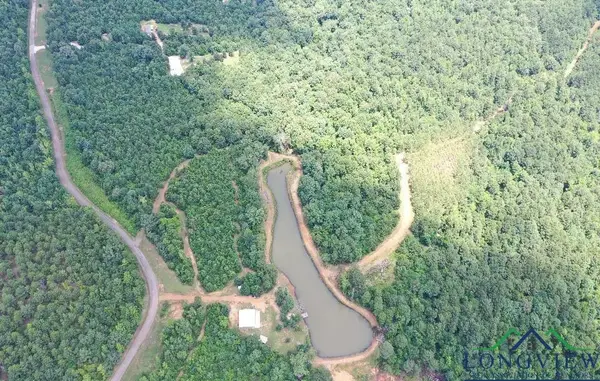 $899,000Active2 beds 1 baths1,225 sq. ft.
Address Withheld By Seller, Lone Star, TX 75668
MLS# 20254572 $350,000Active2 beds 2 baths2,546 sq. ft.
401 S Timberlane, Lone Star, TX 75638
MLS# 20947596Listed by: LONESTAR REALTY $99,000Active14.86 Acres
TBD Willow Point Marina Rd, Lone Star, TX 75668
MLS# 23008998Listed by: MAYBEN REALTY - MT. PLEASANT $63,900Active4 beds 1 baths1,248 sq. ft.
262 HOUSTON ST, Lone Star, TX 75668
MLS# 20255457Listed by: COLDWELL BANKER LENHART-GILMER $284,900Active0.48 Acres
4139 & 4141 LAKESHORE DR, Lone Star, TX 75668
MLS# 20247522Listed by: TEXAS REAL ESTATE EXECUTIVES, THE DANIELS GROUP - GILMER $874,000Active172.21 Acres
TBD N HWY 259, Lone Star, TX 75668
MLS# 20256128Listed by: TEXAS REAL ESTATE EXECUTIVES, THE DANIELS GROUP - GILMER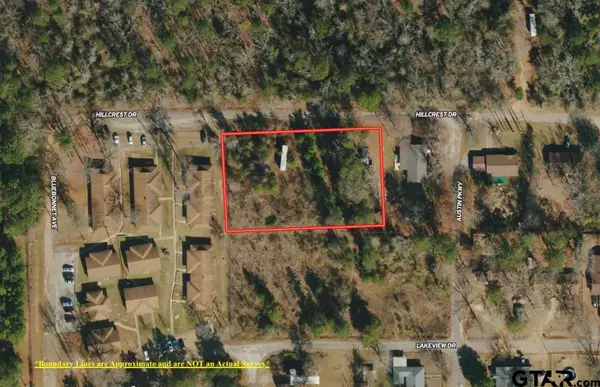 $19,900Active0.76 Acres
TBD Hillcrest Dr, Lone Star, TX 75668
MLS# 24010639Listed by: PATRICK REDFEARN REALTY, LLC $99,000Active14.86 Acres
TBD Willow Point Marina Rd, Lone Star, TX 75668
MLS# 20233939Listed by: MAYBEN REALTY, LLC
Local realty services provided by:CENTURY 21 A Select Group, CENTURY 21 Lucky Money Real Estate, CENTURY 21 Middleton, CENTURY 21 Judge Fite Company, CENTURY 21 Platinum Partners
Copyright 2026, Houston Realtors Information Service, Inc. All information provided is deemed reliable but is not guaranteed and should be independently verified. IDX information is provided exclusively for consumers' personal, non-commercial use, it may not be used for any purpose other than to identify prospective properties consumers may be interested in purchasing, and the data is deemed reliable but is not guaranteed accurate by the MLS.
Information provided, in part, by North Texas Real Estate Information Systems, Inc. Last Updated March 26, 2026 Listings with the NTREIS logo are listed by brokerages other than CENTURY 21 Middleton.
Popular searches near 75668
Popular neighborhoods near 75668
- Azalea District, Tyler homes for sale
- Brick Streets District, Tyler homes for sale
- Butler College, Tyler homes for sale
- Charnwood District, Tyler homes for sale
- Choctaw Bayou, Shreveport homes for sale
- Connally Heights, Tyler homes for sale
- Downtown Tyler, Tyler homes for sale
- East Side, Tyler homes for sale
- Lakeview, Shreveport homes for sale
- North Highland, Shreveport homes for sale
- Northwood, Shreveport homes for sale
- Page Bayou, Shreveport homes for sale
- Pine Island, Shreveport homes for sale
- Shorewood Hills, Shreveport homes for sale
- The Highlands, Tyler homes for sale
- The Woods, Tyler homes for sale
- Wake Village, Wake Village homes for sale
- West Cooper Road, Shreveport homes for sale
- Western Hills, Shreveport homes for sale
- Wilton Place, Shreveport homes for sale
Counties near Lone Star, 75668
- Bowie County homes for sale
- Caddo County homes for sale
- Camp County homes for sale
- Cass County homes for sale
- Franklin County homes for sale
- Gregg County homes for sale
- Harrison County homes for sale
- Hopkins County homes for sale
- Little River County homes for sale
- Marion County homes for sale
- Miller County homes for sale
- Morris County homes for sale
- Panola County homes for sale
- Rains County homes for sale
- Red River County homes for sale
- Rusk County homes for sale
- Smith County homes for sale
- Titus County homes for sale
- Upshur County homes for sale
- Wood County homes for sale
Protect your home and budget from life's surprises with an Assurant Home Warranty, backed by a partner that supports you through every step of homeownership. Explore Plans.
©2026 Century 21 Real Estate LLC. All rights reserved. CENTURY 21®, the CENTURY 21 Logo and C21® are service marks owned by Century 21 Real Estate LLC. Century 21 Real Estate LLC fully supports the principles of the Fair Housing Act and the Equal Opportunity Act. Each office is independently owned and operated. Listing information is deemed reliable but not guaranteed accurate.