- Cambridge Country, Mundelein homes for sale
- Conway Farms, Lake Forest homes for sale
- Cranberry Lake, Hainesville homes for sale
- Deerfield Park, Deerfield homes for sale
- Fox River Valley Gardens, Port Barrington homes for sale
- Hawthorn Woods Country Club, Lake Zurich homes for sale
- Lake Barrington Shores, Lake Barrington homes for sale
- Laudymont Terrace, Arlington Heights homes for sale
- Madrona Village, Round Lake homes for sale
- Prairie Crossing, Grayslake homes for sale
- Ridgewood, Buffalo Grove homes for sale
- Rivershire, Lincolnshire homes for sale
- The Crossings, Buffalo Grove homes for sale
- The Woodlands at Fiore, Buffalo Grove homes for sale
- Valley Lakes, Round Lake homes for sale
- Village of Lake Bluff, Lake Bluff homes for sale
- Washburn Park, North Chicago homes for sale
- White Oak Estates, Long Grove homes for sale
- Winston Park Northwest, Palatine homes for sale
- Wynstone, North Barrington homes for sale
Long Grove, IL - homes for sale
19 of 19 results displayed
- New
 $119,000Active1.43 Acres
6856 Ellis Drive, Long Grove, IL 60047
MLS# 12596451Listed by: COMPASS
 $215,000Active1.87 Acres
4595 Patricia Drive, Long Grove, IL 60047
MLS# 12582693Listed by: @PROPERTIES CHRISTIE'S INTERNATIONAL REAL ESTATE $159,000Active4.19 Acres
6857 Ellis Avenue, Long Grove, IL 60047
MLS# 12581012Listed by: @PROPERTIES CHRISTIE'S INTERNATIONAL REAL ESTATE $449,000Active6.83 Acres
5176 Aptakisic Road, Long Grove, IL 60047
MLS# 12571963Listed by: RE/MAX TOP PERFORMERS $249,700Active2.03 Acres
6783 W Creekside Drive, Long Grove, IL 60047
MLS# 12557034Listed by: BERG PROPERTIES $299,800Active1.1 Acres
7107 Highway 83, Long Grove, IA 60047
MLS# 12562485Listed by: HOMESMART CONNECT LLC $599,999Active1.22 Acres
3981 Old Mchenry Road, Long Grove, IL 60047
MLS# 12508587Listed by: RE/MAX METROPOLITAN $299,000Active1.05 Acres
1144 Steeple View Drive, Long Grove, IL 60047
MLS# 12587700Listed by: RE/MAX SUBURBAN $250,000Active2.29 Acres
3702 Deerwood Drive, Long Grove, IL 60047
MLS# 12490013Listed by: HELEN OLIVERI REAL ESTATE $395,900Active2.69 Acres
3734 Deerwood Drive, Long Grove, IL 60047
MLS# 12490044Listed by: HELEN OLIVERI REAL ESTATE $495,900Active7.13 Acres
3733 Deerwood Drive, Long Grove, IL 60047
MLS# 12489254Listed by: HELEN OLIVERI REAL ESTATE $239,900Active1.68 Acres
6421 Collier Circle, Long Grove, IL 60047
MLS# 12487163Listed by: RE/MAX HORIZON- $235,000Active4.37 Acres
6764 W Creekside Drive, Long Grove, IL 60047
MLS# 12478191Listed by: GRANDVIEW REALTY, LLC  $375,000Active2.68 Acres
4438 Hearthmoor Court, Long Grove, IL 60047
MLS# 12503294Listed by: @PROPERTIES CHRISTIE'S INTERNATIONAL REAL ESTATE $375,000Active2.97 Acres
4542 Kimberly Court, Long Grove, IL 60047
MLS# 12429762Listed by: EXP REALTY $1,750,000Active2.35 Acres
5107 N Arlington Heights Road, Long Grove, IL 60047
MLS# 12301599Listed by: @PROPERTIES COMMERCIAL $249,900Active3.1 Acres
4594 Patricia Drive, Long Grove, IL 60047
MLS# 12049402Listed by: HELEN OLIVERI REAL ESTATE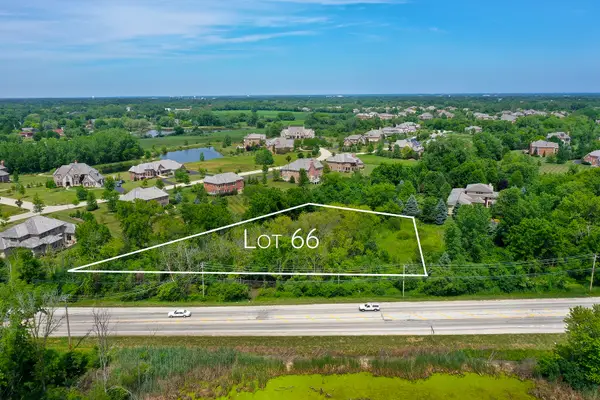 $249,900Active2.46 Acres
4597 Patricia Drive, Long Grove, IL 60047
MLS# 12049418Listed by: HELEN OLIVERI REAL ESTATE $610,000Active4.9 Acres
3523 Long Grove Road, Long Grove, IL 60047
MLS# 12349286Listed by: COLDWELL BANKER REALTY
Local realty services provided by:CENTURY 21 New Heritage
Copyright 2026 Midwest Real Estate Data LLC. All rights reserved. The data relating to real estate for sale on this web site comes in part from the Broker Reciprocity Program of the Midwest Real Estate Data LLC. Listing information is deemed reliable but not guaranteed.
Neighborhoods near Long Grove, IL
Zip codes near Long Grove, IL
- 60004 homes for sale
- 60005 homes for sale
- 60008 homes for sale
- 60010 homes for sale
- 60015 homes for sale
- 60040 homes for sale
- 60044 homes for sale
- 60045 homes for sale
- 60047 homes for sale
- 60048 homes for sale
- 60060 homes for sale
- 60061 homes for sale
- 60062 homes for sale
- 60067 homes for sale
- 60069 homes for sale
- 60070 homes for sale
- 60074 homes for sale
- 60084 homes for sale
- 60089 homes for sale
- 60090 homes for sale
Popular searches near Long Grove, IL
- Buffalo Grove homes for sale
- Deer Park homes for sale
- Ela homes for sale
- Forest Lake homes for sale
- Fremont homes for sale
- Hawthorn Woods homes for sale
- Kildeer homes for sale
- Lake Zurich homes for sale
- Libertyville township homes for sale
- Libertyville homes for sale
- Lincolnshire homes for sale
- Mettawa homes for sale
- Mundelein homes for sale
- Palatine homes for sale
- Palatine Township homes for sale
- Riverwoods homes for sale
- Vernon homes for sale
- Vernon Hills homes for sale
- Wheeling homes for sale
- Wheeling Township homes for sale
Protect your home and budget from life's surprises with an Assurant Home Warranty, backed by a partner that supports you through every step of homeownership. Explore Plans.
©2026 Century 21 Real Estate LLC. All rights reserved. CENTURY 21®, the CENTURY 21 Logo and C21® are service marks owned by Century 21 Real Estate LLC. Century 21 Real Estate LLC fully supports the principles of the Fair Housing Act and the Equal Opportunity Act. Each office is independently owned and operated. Listing information is deemed reliable but not guaranteed accurate.