- Artondale, Gig Harbor homes for sale
- Edgewater, Olympia homes for sale
- Fox Island, Fox Island homes for sale
- Hawks Prairie, Olympia homes for sale
- Heron Island, Lakebay homes for sale
- Hoffman Hill Village, Dupont homes for sale
- Jubilee, Olympia homes for sale
- Kopachuck Ridge, Gig Harbor homes for sale
- Lake City, Lakewood homes for sale
- Meridian Campus, Olympia homes for sale
- Northwest Landing, Dupont homes for sale
- Oakbrook, Lakewood homes for sale
- Palisade Village, Dupont homes for sale
- Raft Island, Gig Harbor homes for sale
- Riveria Community Club, Anderson Island homes for sale
- Rosedale, Gig Harbor homes for sale
- Steliacoom, Steilacoom homes for sale
- University Place, Tacoma homes for sale
- West Slope, Tacoma homes for sale
- Yehle Park Village, Dupont homes for sale
Longbranch, WA - homes for sale
64 of 64 results displayed
- New
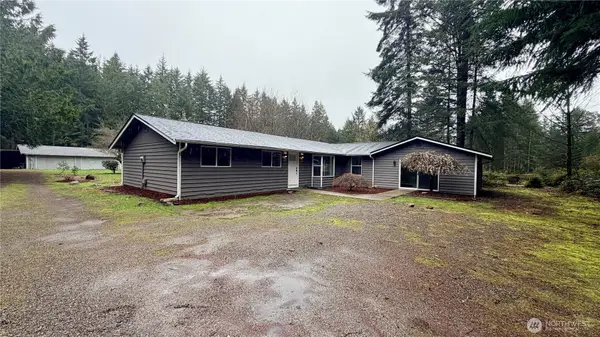 $709,950Active4 beds 2 baths2,092 sq. ft.
11 Webb Road Sw, Lakebay, WA 98349
MLS# 2497937Listed by: DOVE REALTY, INC.
- New
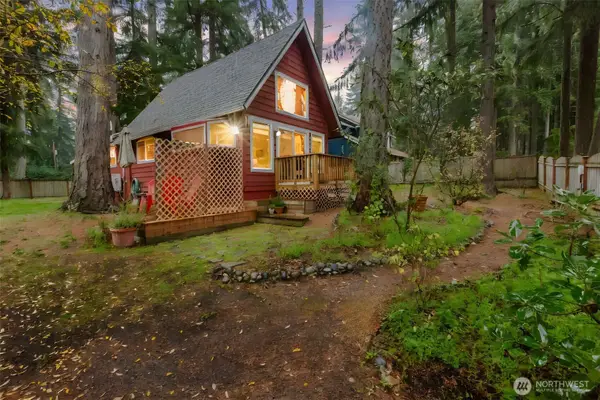 $334,500Active1 beds 1 baths864 sq. ft.
1822 190th Avenue Sw, Lakebay, WA 98349
MLS# 2498194Listed by: COLDWELL BANKER BAIN - New
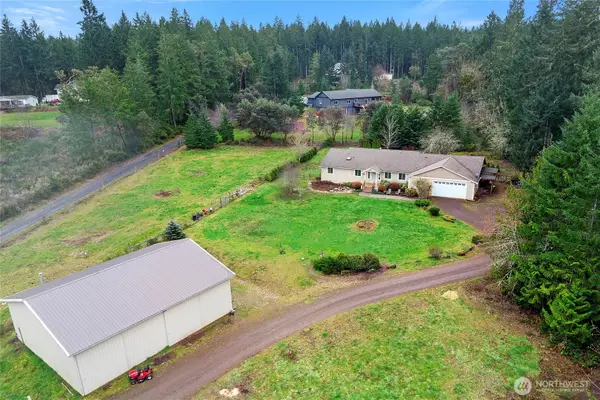 $689,000Active4 beds 3 baths2,528 sq. ft.
606 206 Avenue Nw, Lakebay, WA 98349
MLS# 2495751Listed by: WINDERMERE RE WEST SOUND INC. - New
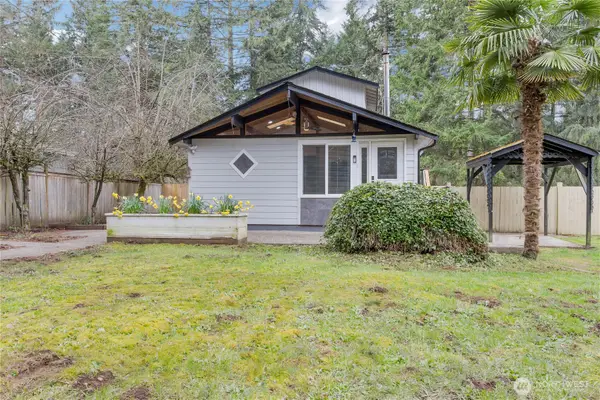 $332,000Active3 beds 1 baths710 sq. ft.
2308 197th Avenue Sw, Lakebay, WA 98349
MLS# 2495917Listed by: EXP REALTY  $625,000Active3 beds 2 baths1,560 sq. ft.
8308 176th Avenue Ct Sw, Longbranch, WA 98351
MLS# 2472136Listed by: WINDERMERE RE WEST SOUND INC. $249,000Active4.89 Acres
17124 80th Street Sw, Longbranch, WA 98351
MLS# 2491725Listed by: ADELBERN REAL ESTATE LLC $429,000Active20.73 Acres
5118 Key Peninsula Highway Sw, Longbranch, WA 98351
MLS# 2488989Listed by: REDFIN $215,000Active10 Acres
4223 183rd Avenue Ct Sw #Revised Lot A, Longbranch, WA 98351
MLS# 2488886Listed by: WINDERMERE PROF PARTNERS $149,900Active5 Acres
4319 183rd Avenue Ct Sw #Revised Lot B, Longbranch, WA 98351
MLS# 2489573Listed by: WINDERMERE PROF PARTNERS $149,900Active5.12 Acres
4324 183rd Avenue Ct Sw #Revised Lot C, Longbranch, WA 98351
MLS# 2489575Listed by: WINDERMERE PROF PARTNERS $495,000Pending3 beds 2 baths1,651 sq. ft.
19816 30th Street Sw, Lakebay, WA 98349
MLS# 2487750Listed by: BCR LLC $725,000Active3 beds 2 baths1,563 sq. ft.
4011 172nd Avenue Sw, Longbranch, WA 98351
MLS# 2486583Listed by: JOHN L. SCOTT, INC. $369,950Pending3 beds 2 baths1,296 sq. ft.
1810 193rd Avenue Sw, Lakebay, WA 98349
MLS# 2485725Listed by: EXP REALTY $620,000Active3 beds 3 baths2,102 sq. ft.
2507 Creviston Road Sw, Lakebay, WA 98349
MLS# 2484904Listed by: REDFIN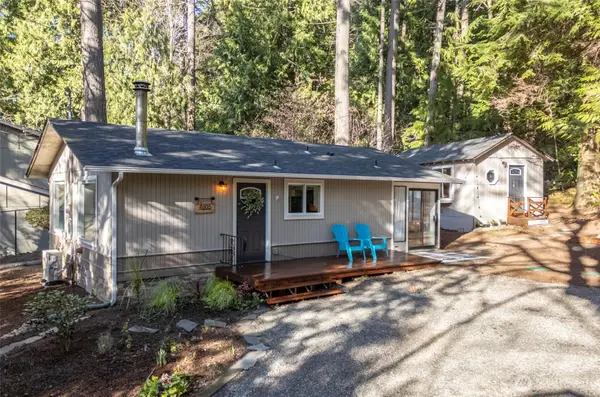 $359,500Active1 beds 1 baths756 sq. ft.
4803 165th Avenue Sw, Longbranch, WA 98351
MLS# 2484559Listed by: PROPERTIESNW OF GIG HARBOR LTD $2,490,000Active4 beds 3 baths4,386 sq. ft.
17510 88th Street Sw, Longbranch, WA 98351
MLS# 2477352Listed by: WINDERMERE PROF PARTNERS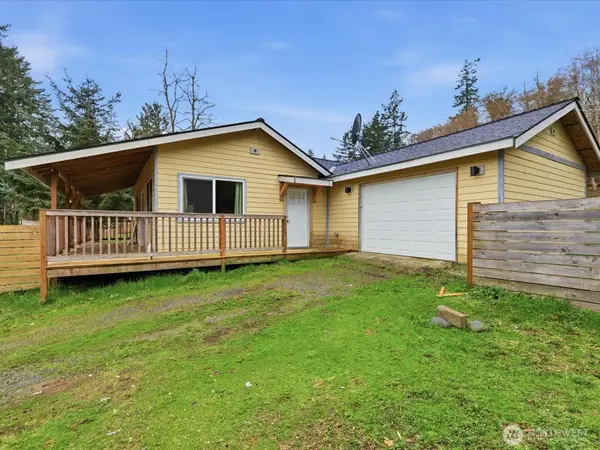 $399,950Active2 beds 2 baths1,032 sq. ft.
16602 Delano Road, Lakebay, WA 98349
MLS# 2461648Listed by: KW NORTH SOUND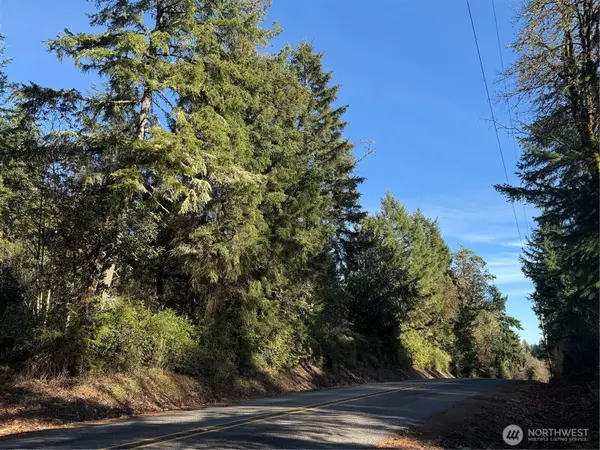 $178,000Pending5.14 Acres
7515 Whiteman Road Sw #Lot3, Longbranch, WA 98351
MLS# 2480819Listed by: JOHN L. SCOTT, INC.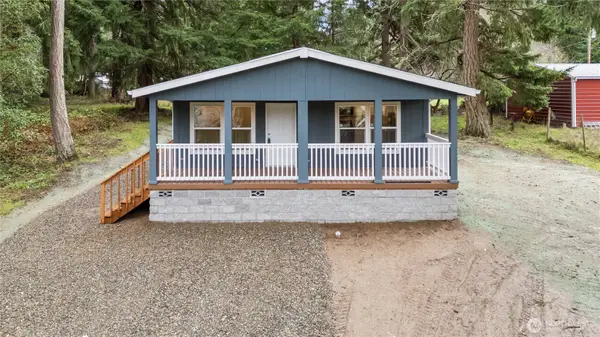 $379,000Active3 beds 2 baths1,296 sq. ft.
8315 175th Avenue Sw, Longbranch, WA 98351
MLS# 2465020Listed by: BETTER PROPERTIES REAL ESTATE $130,000Pending0.38 Acres
17411 81st Street Ct Sw, Longbranch, WA 98351
MLS# 2478485Listed by: TIMBER REAL ESTATE $250,000Pending19.58 Acres
0 Whiteman Road Sw, Lakebay, WA 98349
MLS# 2472101Listed by: WINDERMERE PROF PARTNERS $179,000Active0.74 Acres
7118 190th Avenue Sw, Longbranch, WA 98351
MLS# 2477367Listed by: JOHN L. SCOTT, INC. $225,000Active1 beds 1 baths480 sq. ft.
8216 175th Avenue Sw, Longbranch, WA 98351
MLS# 2477144Listed by: KELLER WILLIAMS RTY TACOMA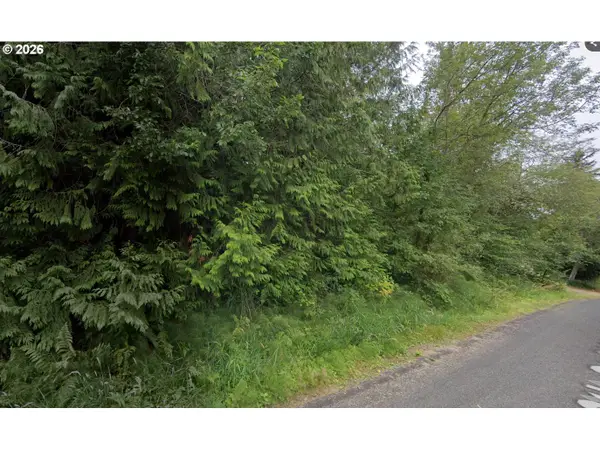 $110,000Active0 Acres
17609 SW 81st St, Longbranch, WA 98351
MLS# 335872728Listed by: WILLAMETTE EQUITY BROKERAGE LLC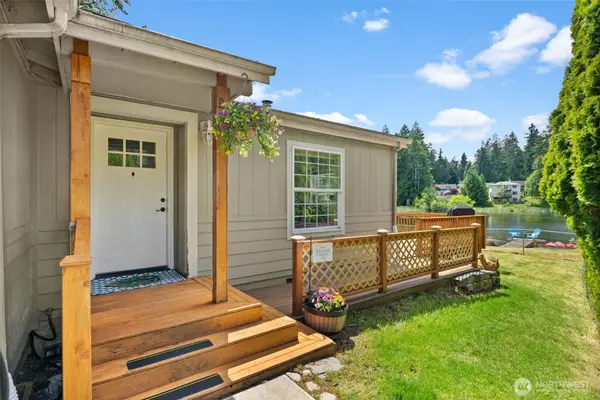 $415,000Pending3 beds 2 baths1,504 sq. ft.
19308 22nd Street Ct Sw, Lakebay, WA 98349
MLS# 2476115Listed by: NEIGHBORHOOD EXPERTS REAL EST.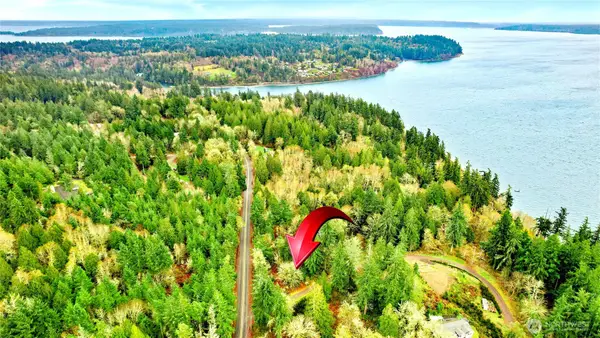 $200,000Active0.51 Acres
18813 74th Street Sw, Longbranch, WA 98351
MLS# 2472603Listed by: REDFIN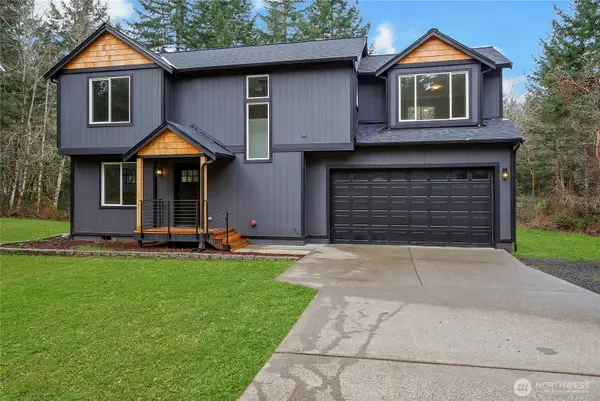 $534,999Active4 beds 3 baths1,582 sq. ft.
210 Tiedeman Road Nw, Lakebay, WA 98349
MLS# 2472489Listed by: EVERY DOOR REAL ESTATE $175,000Active4.85 Acres
14802 Delano Road Sw, Lakebay, WA 98349
MLS# 2471787Listed by: JOHN L. SCOTT MUKILTEO $475,000Pending2 beds 2 baths1,344 sq. ft.
16017 72nd Street Sw, Longbranch, WA 98351
MLS# 2467440Listed by: WINDERMERE PROF PARTNERS $159,950Active5.56 Acres
206 184th Avenue Ct Nw, Lakebay, WA 98349
MLS# 2464357Listed by: EXP REALTY $650,000Active3 beds 3 baths3,206 sq. ft.
2311 202nd Avenue Sw, Lakebay, WA 98349
MLS# 2456063Listed by: KELLER WILLIAMS EASTSIDE $850,000Active3 beds 2 baths2,900 sq. ft.
4914 182nd Avenue Sw, Longbranch, WA 98351
MLS# 2453057Listed by: SKYLINE PROPERTIES, INC.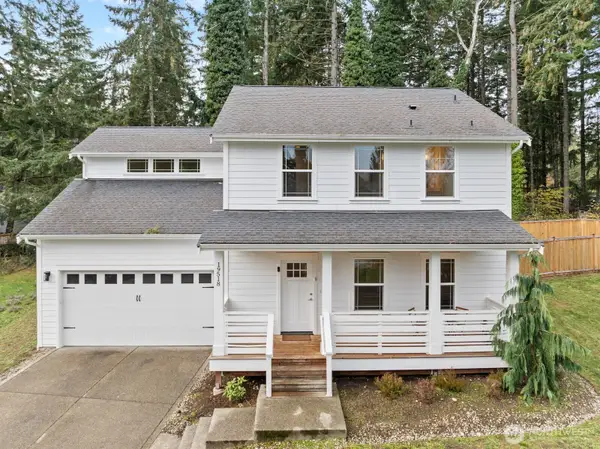 $520,000Active4 beds 3 baths1,837 sq. ft.
19518 26th Street Court Sw, Lakebay, WA 98349
MLS# 2449260Listed by: REALOGICS SOTHEBY'S INT'L RLTY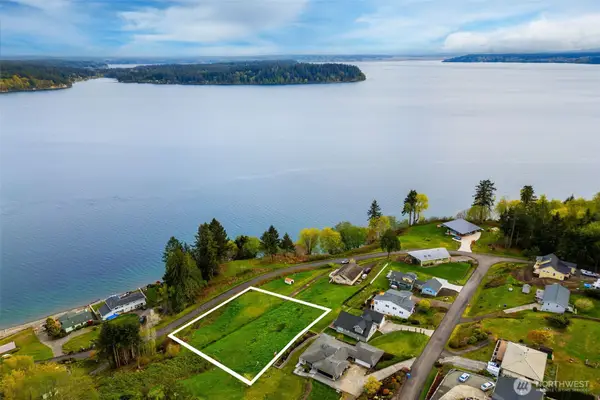 $220,000Active0.96 Acres
9214 163rd Avenue Ct Sw #36, Longbranch, WA 98351
MLS# 2449303Listed by: COMPASS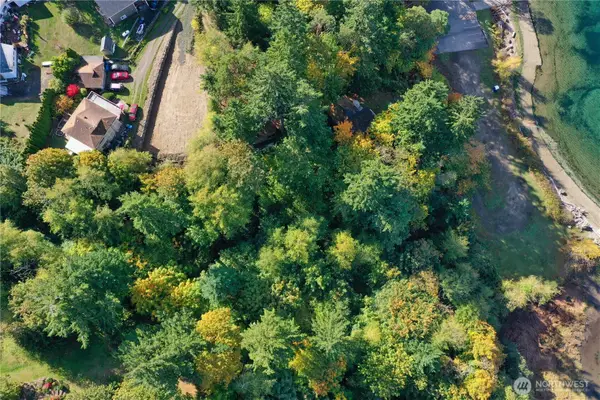 $179,000Active0.27 Acres
8115 178th Ave Ct Sw #34, Longbranch, WA 98351
MLS# 2446315Listed by: JOHN L. SCOTT, INC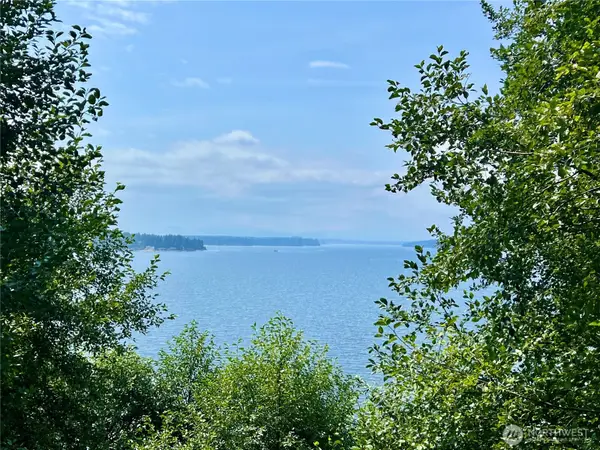 $310,000Active0.85 Acres
6908 190th Avenue Sw, Longbranch, WA 98351
MLS# 2445533Listed by: BEST CHOICE REALTY LLC $225,000Active3.49 Acres
17430 27th Street Sw #3, Lakebay, WA 98349
MLS# 2442797Listed by: HAWKINS POE $145,000Active2.41 Acres
120 184th Avenue Ct Nw, Lakebay, WA 98349
MLS# 2439517Listed by: HAWKINS POE $1,195,000Pending2 beds 3 baths2,210 sq. ft.
1403 S Head Avenue Sw, Lakebay, WA 98349
MLS# 2430895Listed by: JOHN L. SCOTT R.E.TACOMA NORTH $449,950Active3 beds 2 baths1,628 sq. ft.
1906 197th Avenue Sw, Lakebay, WA 98349
MLS# 2437479Listed by: REALTY ONE GROUP TURN KEY $165,000Active2.5 Acres
623 208th Avenue Nw #2, Lakebay, WA 98349
MLS# 2428542Listed by: KELLER WILLIAMS WEST SOUND $399,950Pending3 beds 2 baths1,404 sq. ft.
5315 Whiteman Road Sw, Longbranch, WA 98351
MLS# 2428202Listed by: COMPASS $250,000Active5 Acres
18220 70th Street Ct Sw, Longbranch, WA 98351
MLS# 2420785Listed by: SIEVERS REAL ESTATE $125,000Active0.24 Acres
0 175th Avenue Sw #9, Longbranch, WA 98351
MLS# 2418939Listed by: RE/MAX ADVANTAGE $179,950Active4.58 Acres
2721 158th Avenue Sw, Lakebay, WA 98340
MLS# 2423064Listed by: JOHN L. SCOTT, INC $480,000Active4 beds 2 baths1,836 sq. ft.
1510 Key Peninsula Highway Sw, Lakebay, WA 98349
MLS# 2420703Listed by: REAL BROKER LLC $113,400Active1.32 Acres
4101 161st Avenue Sw, Longbranch, WA 98351
MLS# 2428633Listed by: KELLER WILLIAMS WEST SOUND $29,900Active0.25 Acres
19401 Whiteman Cove Road Sw #20, Longbranch, WA 98351
MLS# 2413188Listed by: BETTER PROPERTIES GIG HARBOR $979,995Active4 beds 3 baths4,200 sq. ft.
2219 Key Peninsula Highway Sw, Lakebay, WA 98349
MLS# 2402196Listed by: JOHN L. SCOTT, INC. $110,000Pending2.49 Acres
411 208th Avenue Nw #4, Lakebay, WA 98349
MLS# 2382670Listed by: JOHN L. SCOTT R.E.TACOMA NORTH $129,500Active8.21 Acres
3912 183rd Avenue Ct Sw, Longbranch, WA 98351
MLS# 2401515Listed by: HOMECOIN.COM $145,000Pending1.01 Acres
14528 45th Street Sw #9, Lakebay, WA 98349
MLS# 2396377Listed by: REALTY ONE GROUP TURN KEY $185,000Pending - Backup offer requested10 Acres
18771 Erickson Road Sw, Longbranch, WA 98351
MLS# 2386546Listed by: SKYLINE PROPERTIES, INC. $249,000Active8.3 Acres
0 30th Street Sw, Lakebay, WA 98349
MLS# 2342056Listed by: WINDERMERE PROF PARTNERS $680,000Active2 beds 2 baths1,000 sq. ft.
7021 Cliff Avenue Sw, Longbranch, WA 98351
MLS# 2418029Listed by: AGENCYONE $189,900Active5 Acres
1809 208th Avenue Sw, Lakebay, WA 98349
MLS# 2452020Listed by: HAWKINS POE $215,900Active10 Acres
14817 24th St Sw, Lakebay, WA 98349
MLS# 2329641Listed by: COLDWELL BANKER PARK SHORE RE $4,799,000Active4 beds 3 baths3,720 sq. ft.
17403 SW 88th St, Longbranch, WA 98351
MLS# 548230307Listed by: EXP REALTY LLC $125,000Pending1 Acres
14516 45th Street Sw #10, Lakebay, WA 98349
MLS# 2351514Listed by: REALTY ONE GROUP TURN KEY $95,000Active0.53 Acres
919 Sanford Avenue #10, Lakebay, WA 98349
MLS# 2289521Listed by: WINDERMERE PENINSULAPROPERTIES $199,000Active5 Acres
1415 208th Avenue Sw, Lakebay, WA 98349
MLS# 2287787Listed by: RE/MAX EXCLUSIVE $117,000Pending5.17 Acres
0 Tiedman Road Sw, Lakebay, WA 98349
MLS# 2298446Listed by: REAL BROKER LLC $4,799,000Active4 beds 4 baths3,720 sq. ft.
17403 88th Street Sw, Longbranch, WA 98351
MLS# 2142614Listed by: EXP REALTY $159,000Active0.4 Acres
5006 165th Avenue Sw, Longbranch, WA 98351
MLS# 2006285Listed by: RE/MAX EXTRA INC.
Local realty services provided by:CENTURY 21 Tri-Cities, CENTURY 21 Agate Realty
Listings courtesy of Northwest MLS as distributed by MLS GRID. Based on information submitted to the MLS GRID as of April 1, 2026. All data is obtained from various sources and may not have been verified by broker or MLS GRID. Supplied Open House Information is subject to change without notice. All information should be independently reviewed and verified for accuracy. Properties may or may not be listed by the office/agent presenting the information. Listing information is provided for consumers' personal, non-commercial use, solely to identify prospective properties for potential purchase; all other use is strictly prohibited and may violate relevant federal and state law. Information deemed reliable but not guaranteed. Copyright © 2026 MLS GRID. All Rights Reserved.
All information provided is deemed reliable but is not guaranteed and should be independently verified. The content relating to real estate for sale on this web site comes in part from the IDX program of the RMLS of Portland Oregon. Real estate listings held by brokerage firms other than CENTURY 21 Agate Realty are marked with the RMLS logo and detailed information about these properties includes the names of the listing brokers. Copyright 2026 RMLS, Portland, Oregon. Last updated: March 20, 2026
Neighborhoods near Longbranch, WA
Zip codes near Longbranch, WA
- 98303 homes for sale
- 98327 homes for sale
- 98329 homes for sale
- 98332 homes for sale
- 98333 homes for sale
- 98335 homes for sale
- 98349 homes for sale
- 98351 homes for sale
- 98388 homes for sale
- 98394 homes for sale
- 98406 homes for sale
- 98465 homes for sale
- 98466 homes for sale
- 98467 homes for sale
- 98498 homes for sale
- 98502 homes for sale
- 98506 homes for sale
- 98516 homes for sale
- 98524 homes for sale
- 98546 homes for sale
Popular searches near Longbranch, WA
- Anderson Island homes for sale
- Artondale homes for sale
- Dupont homes for sale
- Fox Island homes for sale
- Gig Harbor homes for sale
- Gig Harbor Peninsula homes for sale
- Grapeview homes for sale
- Herron Island homes for sale
- Home homes for sale
- Key Center homes for sale
- Key Peninsula-Anderson Island homes for sale
- Lakebay homes for sale
- Raft Island homes for sale
- Rosedale homes for sale
- Stansberry Lake homes for sale
- Steilacoom homes for sale
- Timber Lake-Harstine Island homes for sale
- University Place homes for sale
- Vaughn homes for sale
- Wollochet homes for sale
Protect your home and budget from life's surprises with an Assurant Home Warranty, backed by a partner that supports you through every step of homeownership. Explore Plans.
©2026 Century 21 Real Estate LLC. All rights reserved. CENTURY 21®, the CENTURY 21 Logo and C21® are service marks owned by Century 21 Real Estate LLC. Century 21 Real Estate LLC fully supports the principles of the Fair Housing Act and the Equal Opportunity Act. Each office is independently owned and operated. Listing information is deemed reliable but not guaranteed accurate.