- Audubon Park properties for sale
- Beechwood Village properties for sale
- Central Jefferson properties for sale
- Clarksville properties for sale
- Graymoor-Devondale properties for sale
- Indian Hills properties for sale
- Jeffersonville properties for sale
- Louisville properties for sale
- Louisville Central properties for sale
- Louisville East properties for sale
- Louisville South properties for sale
- Louisville West properties for sale
- Lynnview properties for sale
- New Albany properties for sale
- New Albany Township properties for sale
- North Dixie properties for sale
- St Matthews properties for sale
- Shively properties for sale
- Utica Township properties for sale
- Windy Hills properties for sale
40203, KY - homes for sale
90 of 90 results displayed
- New
 $110,000Active3 beds 1 baths1,114 sq. ft.
1727 Baird St, Louisville, KY 40203
MLS# 1705455Listed by: HOMEPAGE REALTY - New
 $185,500Active3 beds 2 baths1,200 sq. ft.
632 S 15th St, Louisville, KY 40203
MLS# 1705355Listed by: CORPORATE SERVICES CONSULTANTS - New
 $176,000Active4 beds 2 baths2,086 sq. ft.
1926 W Chestnut St, Louisville, KY 40203
MLS# 1705199Listed by: WEICHERT REALTORS - ABG - New
 $225,000Active3 beds 3 baths2,328 sq. ft.
1042 S 6th St, Louisville, KY 40203
MLS# 1705154Listed by: 85W REAL ESTATE - Open Sun, 2 to 4pmNew
 $324,000Active4 beds 3 baths1,710 sq. ft.
417 Camp St, Louisville, KY 40203
MLS# 1705079Listed by: KELLER WILLIAMS COLLECTIVE - New
 $34,000Active0.05 Acres
639 E Jacob St, Louisville, KY 40203
MLS# 1705040Listed by: ETERNAL, LLC - New
 $210,000Active2 beds 2 baths1,178 sq. ft.
818 S Hancock St, Louisville, KY 40203
MLS# 1705006Listed by: RE/MAX PROPERTIES EAST  $375,000Active-- beds -- baths3,250 sq. ft.
952 S 6th St, Louisville, KY 40203
MLS# 1704700Listed by: UNITED REAL ESTATE LOUISVILLE $275,000Active8 beds 4 baths2,280 sq. ft.
721 Roselane St, Louisville, KY 40203
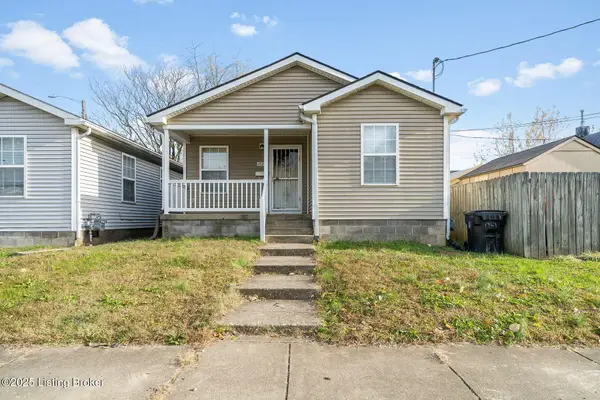
MLS# 1704572Listed by: SEMONIN REALTORS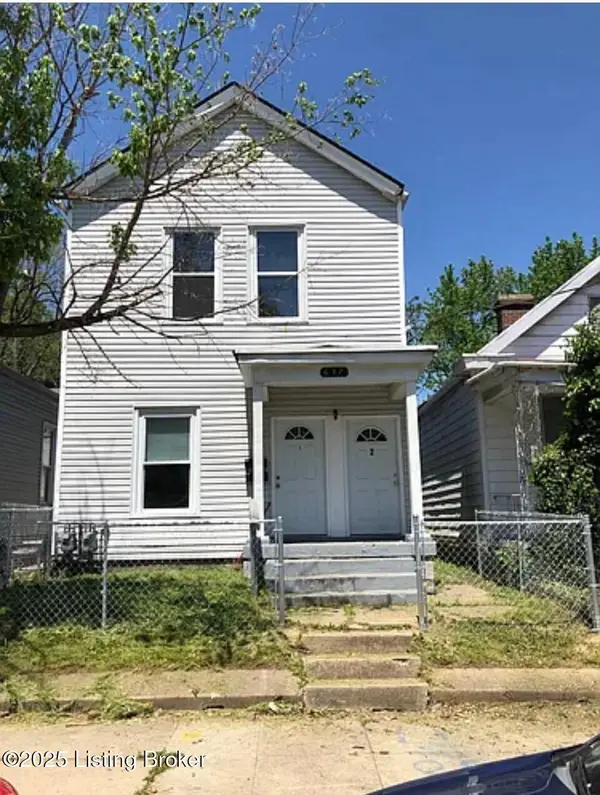 $259,900Active4 beds 2 baths2,168 sq. ft.
637 E Ormsby Ave, Louisville, KY 40203
MLS# 1704403Listed by: THINK REAL ESTATE LLC $59,900Active0.08 Acres
312 Camp St, Louisville, KY 40203
MLS# 1703929Listed by: RE/MAX PROPERTIES EAST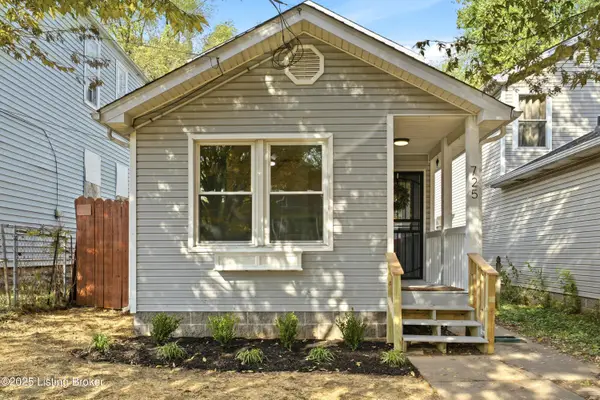 $255,000Active3 beds 2 baths1,216 sq. ft.
725 Speckert Ct, Louisville, KY 40203
MLS# 1703550Listed by: COVENANT REALTY LLC $449,900Active5 beds 5 baths4,722 sq. ft.
125 W Ormsby Ave, Louisville, KY 40203
MLS# 1703502Listed by: LOUISVILLE MAGIC REALTY $324,900Active3 beds 2 baths2,159 sq. ft.
506 E Ormsby Ave, Louisville, KY 40203
MLS# 1703339Listed by: HOUSING ASSOCIATES $265,000Active3 beds 3 baths4,000 sq. ft.
428 E Ormsby Ave, Louisville, KY 40203
MLS# 1703384Listed by: RE/MAX PROPERTIES EAST $70,000Active3 beds 1 baths1,369 sq. ft.
1728 Rowan St, Louisville, KY 40203
MLS# 1703489Listed by: BROADWAY MANAGEMENT GROUP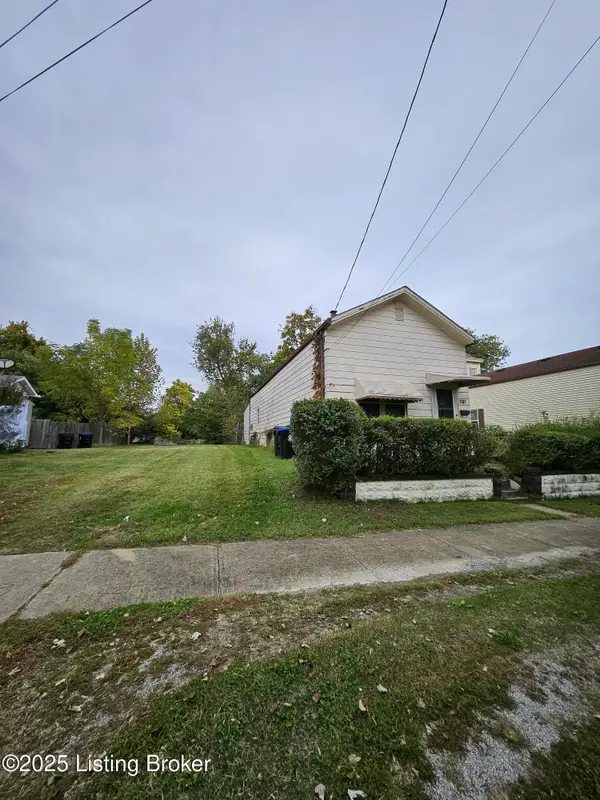 $74,900Active2 beds 1 baths896 sq. ft.
1707 Baird St, Louisville, KY 40203
MLS# 1702990Listed by: KENTUCKIANA REALTY GROUP, LLC $215,000Active2 beds 2 baths1,180 sq. ft.
538 E Ormsby Ave, Louisville, KY 40203
MLS# 1702696Listed by: KEY ASSOCIATES SIGNATURE REALTY $407,500Pending5 beds 3 baths3,349 sq. ft.
1034 S Brook St, Louisville, KY 40203
MLS# 1702888Listed by: RE/MAX RESULTS $145,000Active2 beds 2 baths1,916 sq. ft.
214 N 17th St, Louisville, KY 40203
MLS# 1702521Listed by: BELLMAN REALTY LLC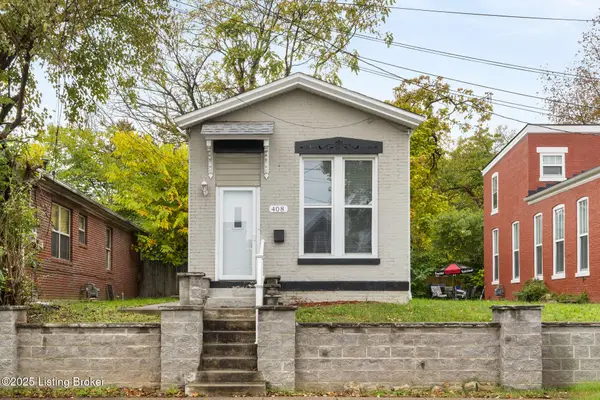 $135,000Active2 beds 2 baths1,270 sq. ft.
408 Dr W J Hodge St, Louisville, KY 40203
MLS# 1702488Listed by: POLO REAL ESTATE GROUP LLC $199,900Active3 beds 1 baths1,232 sq. ft.
708 E Kentucky St, Louisville, KY 40203
MLS# 1702321Listed by: HOMEPAGE REALTY $90,000Active2 beds 1 baths1,020 sq. ft.
1922 Bank St, Louisville, KY 40203
MLS# 1702224Listed by: SIX DEGREES REAL ESTATE, LLC $137,000Active2 beds 1 baths1,500 sq. ft.
1815 Owen St, Louisville, KY 40203
MLS# 1701836Listed by: KELLER WILLIAMS REALTY -LOU $390,000Active7 beds 9 baths6,808 sq. ft.
1022 S 3rd St, Louisville, KY 40203
MLS# 1701497Listed by: GREEN TEAM REAL ESTATE SERVICES $299,900Active4 beds 2 baths2,510 sq. ft.
1273 S Preston St, Louisville, KY 40203
MLS# 1701340Listed by: RE/MAX PREMIER PROPERTIES $205,000Active3 beds 2 baths1,260 sq. ft.
961 S 7th St, Louisville, KY 40203
MLS# 1701156Listed by: THE BRELAND GROUP $159,900Active1 beds 1 baths1,000 sq. ft.
507 E Oak St, Louisville, KY 40203
MLS# 1701115Listed by: FAMILY REALTY LLC $160,000Active2 beds 1 baths846 sq. ft.
1008 S Shelby St, Louisville, KY 40203
MLS# 1701016Listed by: REAL BROKER, LLC $350,000Active3 beds 3 baths1,708 sq. ft.
605 E Kentucky St, Louisville, KY 40203
MLS# 1700783Listed by: SEMONIN REALTORS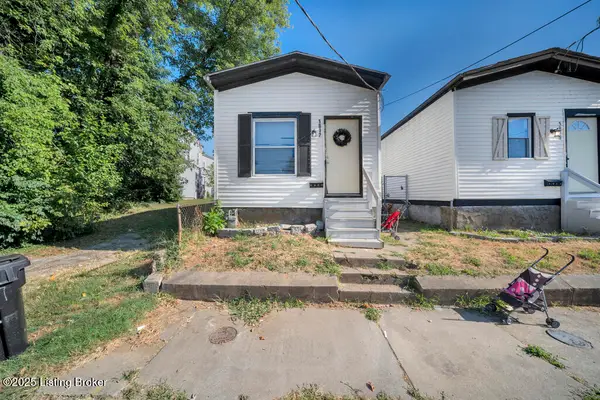 $75,000Active2 beds 1 baths616 sq. ft.
1815 Columbia St, Louisville, KY 40203
MLS# 1700041Listed by: HOMEPAGE REALTY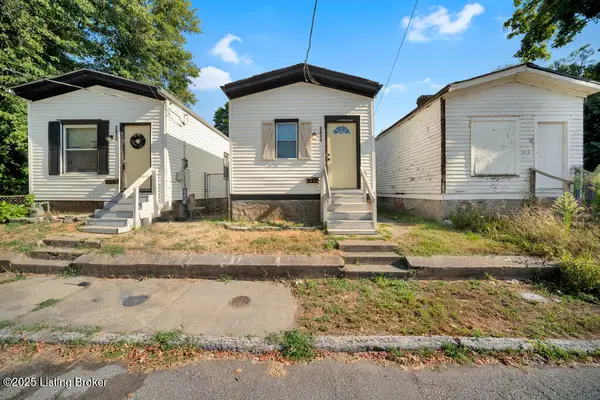 $70,000Active1 beds 1 baths616 sq. ft.
1817 Columbia St, Louisville, KY 40203
MLS# 1700042Listed by: HOMEPAGE REALTY $122,500Active3 beds 1 baths930 sq. ft.
1914 Lytle St, Louisville, KY 40203
MLS# 1699926Listed by: DIAMOND KEY REALTORS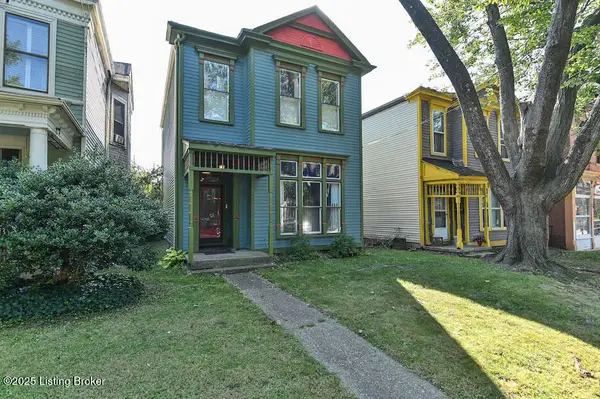 $345,000Pending3 beds 3 baths2,403 sq. ft.
1267 S Floyd St, Louisville, KY 40203
MLS# 1699793Listed by: GREYSTONE REALTORS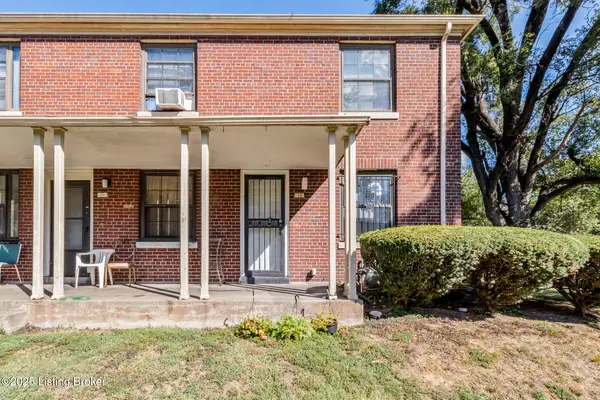 $75,000Active2 beds 2 baths891 sq. ft.
12 College Ct, Louisville, KY 40203
MLS# 1699760Listed by: REAL BROKER, LLC $670,000Active10 beds 7 baths3,731 sq. ft.
320 E College St, Louisville, KY 40203
MLS# 1699583Listed by: RE/MAX PREMIER PROPERTIES $425,000Pending4 beds 4 baths1,824 sq. ft.
1251 S Shelby St, Louisville, KY 40203
MLS# 1699492Listed by: RE/MAX PREMIER PROPERTIES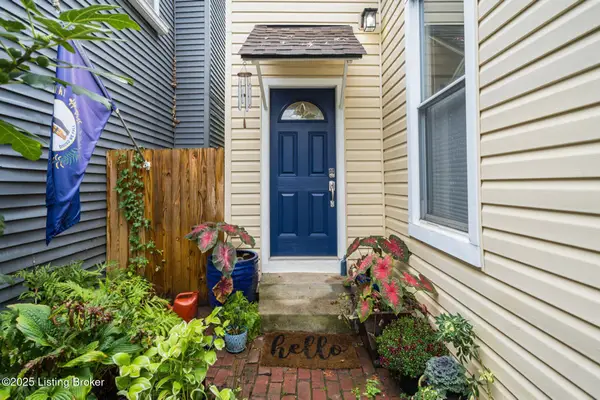 $233,000Active2 beds 2 baths864 sq. ft.
632 Camp St, Louisville, KY 40203
MLS# 1699259Listed by: HOMEPAGE REALTY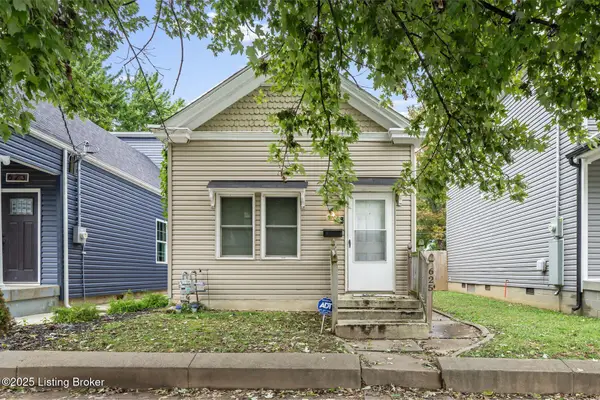 $195,000Active3 beds 1 baths1,080 sq. ft.
625 E Ormsby Ave, Louisville, KY 40203
MLS# 1700261Listed by: HOMEPAGE REALTY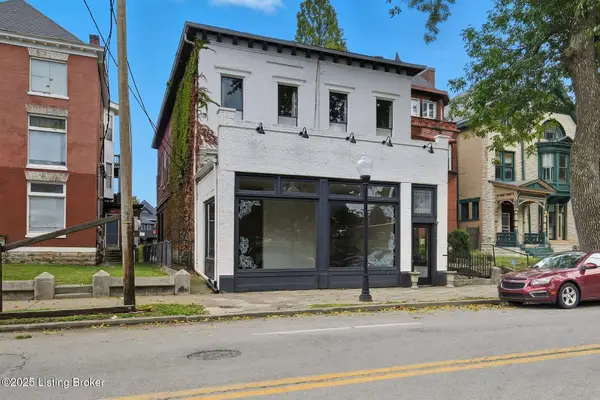 $535,000Active4 beds 3 baths4,929 sq. ft.
1217 S 4th St, Louisville, KY 40203
MLS# 1699204Listed by: LENIHAN SOTHEBY'S INTERNATIONAL REALTY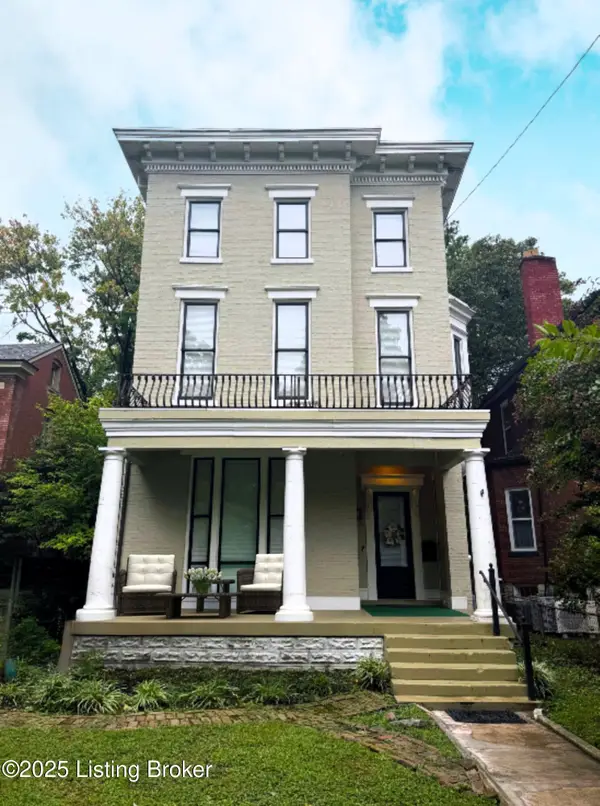 $845,000Active5 beds 5 baths5,158 sq. ft.
1232 S 6th St, Louisville, KY 40203
MLS# 1699173Listed by: RE/MAX RESULTS $480,000Active5 beds 4 baths7,757 sq. ft.
1143 S 1st St, Louisville, KY 40203
MLS# 1698950Listed by: RE/MAX PROPERTIES EAST $305,000Active3 beds 3 baths2,163 sq. ft.
438 E Oak St, Louisville, KY 40203
MLS# 1698726Listed by: NOIR REALTY KY LLC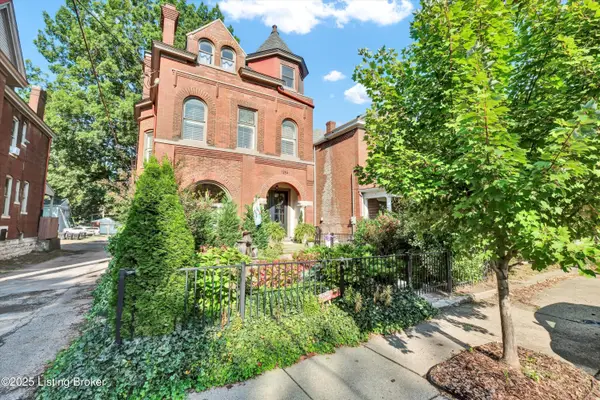 $647,000Active3 beds 4 baths3,428 sq. ft.
1254 S Brook St, Louisville, KY 40203
MLS# 1698665Listed by: SCHULER BAUER REAL ESTATE SERVICES ERA POWERED $188,000Active3 beds 1 baths1,105 sq. ft.
818 W St Catherine St, Louisville, KY 40203
MLS# 1704296Listed by: ONE KEY REALTY $465,000Active-- beds -- baths3,381 sq. ft.
1245 S 1st St, Louisville, KY 40203
MLS# 1698435Listed by: PRG COMMERCIAL PROPERTY ADVISORS- New
 $429,999Active7 beds 4 baths3,202 sq. ft.
628 E Oak St, Louisville, KY 40203
MLS# 1705045Listed by: WINNER REALTY 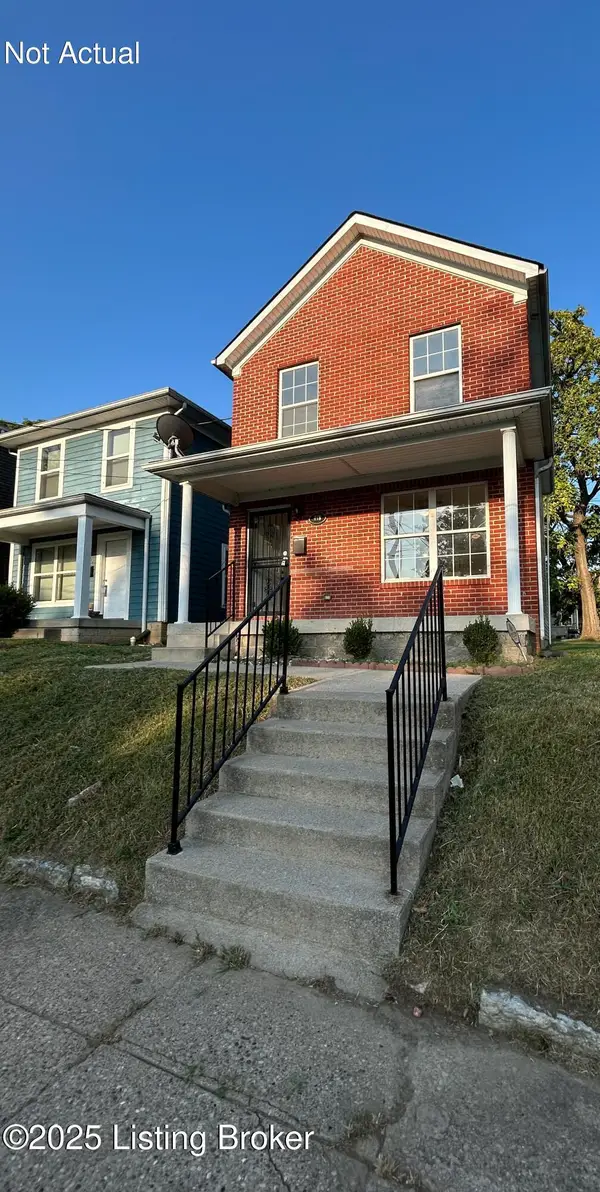 $140,000Active3 beds 3 baths1,406 sq. ft.
418 W Dr W. J. Hodge St, Louisville, KY 40203
MLS# 1698232Listed by: PRG COMMERCIAL PROPERTY ADVISORS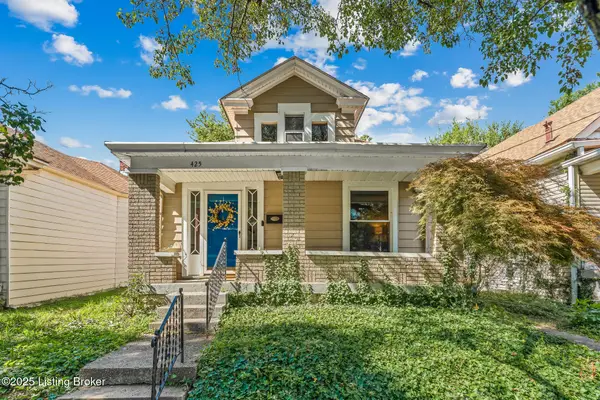 $325,000Pending4 beds 1 baths1,380 sq. ft.
425 E Oak St, Louisville, KY 40203
MLS# 1698177Listed by: UNITED REAL ESTATE LOUISVILLE $290,000Active2 beds 2 baths1,080 sq. ft.
931 S Clay St, Louisville, KY 40203
MLS# 1697784Listed by: DIAMOND KEY REALTORS $289,000Active4 beds 2 baths2,060 sq. ft.
1516 W Chestnut St, Louisville, KY 40203
MLS# 1697362Listed by: REAL ESTATE UNLIMITED $257,000Pending4 beds 4 baths2,900 sq. ft.
1236 S Floyd St, Louisville, KY 40203
MLS# 1697073Listed by: 85W REAL ESTATE $165,000Active3 beds 2 baths1,418 sq. ft.
914 S Preston St, Louisville, KY 40203
MLS# 1697066Listed by: BROADWAY MANAGEMENT GROUP $224,996Active2 beds 2 baths1,250 sq. ft.
713 E Kentucky St, Louisville, KY 40203
MLS# 1696936Listed by: DREAM J P PIRTLE REALTORS $1,525,000Active4 beds 4 baths6,852 sq. ft.
1529 W Market St, Louisville, KY 40203
MLS# 1696821Listed by: ALLODIUM REAL ESTATE $110,000Active3 beds 1 baths1,248 sq. ft.
1812 Magazine St, Louisville, KY 40203
MLS# 1696326Listed by: RE/MAX FIVE STAR PROPERTIES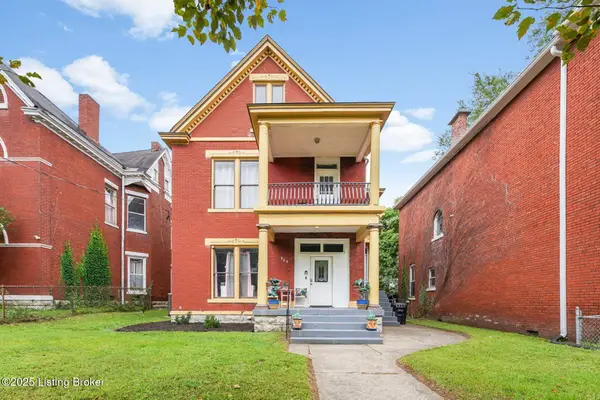 $530,000Active6 beds 3 baths3,734 sq. ft.
520 W Oak St, Louisville, KY 40203
MLS# 1696166Listed by: HOMEPAGE REALTY $70,000Active4 beds 1 baths
532 N 20th St, Louisville, KY 40203
MLS# 1695705Listed by: KELLER WILLIAMS COLLECTIVE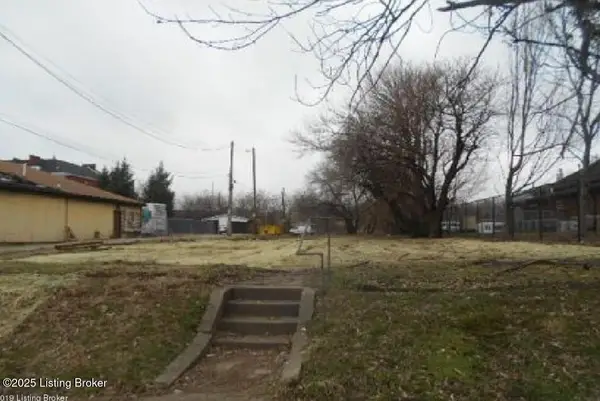 $65,000Active0.3 Acres
1144 S Preston St, Louisville, KY 40203
MLS# 1695654Listed by: UNITED REAL ESTATE LOUISVILLE $407,500Pending5 beds 3 baths3,349 sq. ft.
1034 S Brook St, Louisville, KY 40203
MLS# 1695347Listed by: RE/MAX RESULTS $137,500Active2 beds 1 baths838 sq. ft.
510 N 17th St, Louisville, KY 40203
MLS# 1694085Listed by: EXP REALTY LLC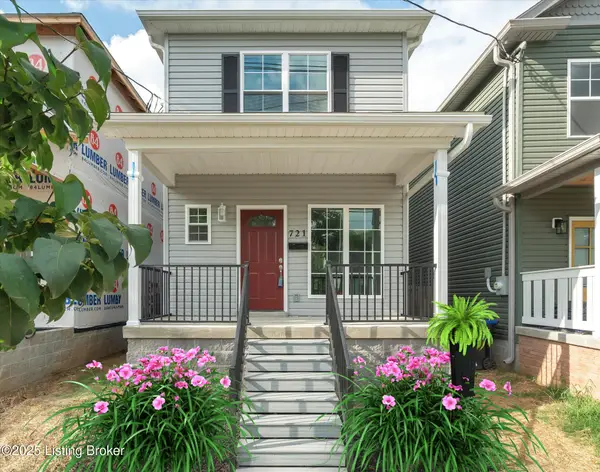 $299,900Active3 beds 3 baths1,465 sq. ft.
721 E Caldwell St, Louisville, KY 40203
MLS# 1693274Listed by: METRO 1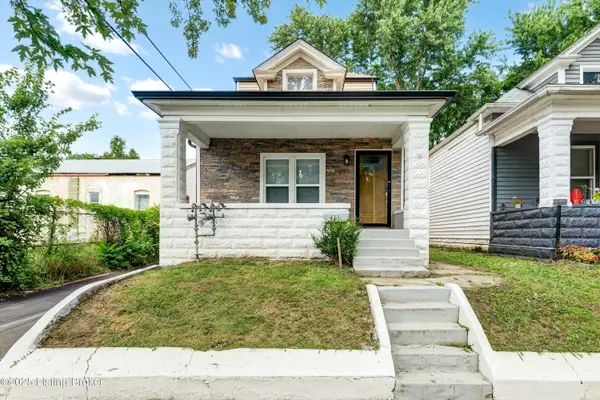 $275,000Active3 beds 4 baths2,332 sq. ft.
413 Camp St, Louisville, KY 40203
MLS# 1693249Listed by: DIAMOND KEY REALTORS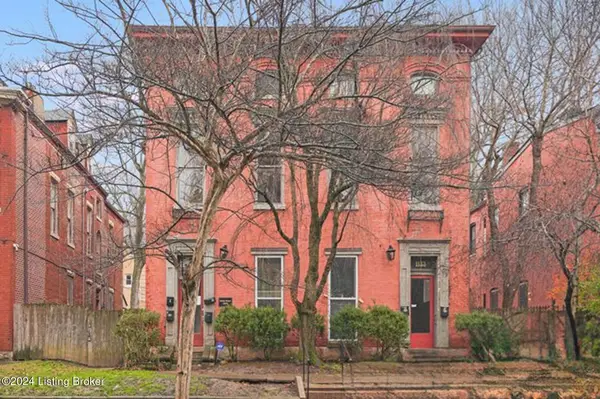 $99,500Active1 beds 1 baths562 sq. ft.
1131 S Brook St #APT 3, Louisville, KY 40203
MLS# 1702118Listed by: HOMEPAGE REALTY $90,000Pending3 beds 1 baths1,518 sq. ft.
2024 Portland Ave, Louisville, KY 40203
MLS# 1703583Listed by: KELLER WILLIAMS COLLECTIVE $550,000Active4 beds 5 baths5,409 sq. ft.
1100 S 3rd St, Louisville, KY 40203
MLS# 1692801Listed by: KENTUCKY SELECT PROPERTIES $269,000Active3 beds 3 baths1,450 sq. ft.
534 Lampton St, Louisville, KY 40203
MLS# 1692785Listed by: WEICHERT REALTORS - ABG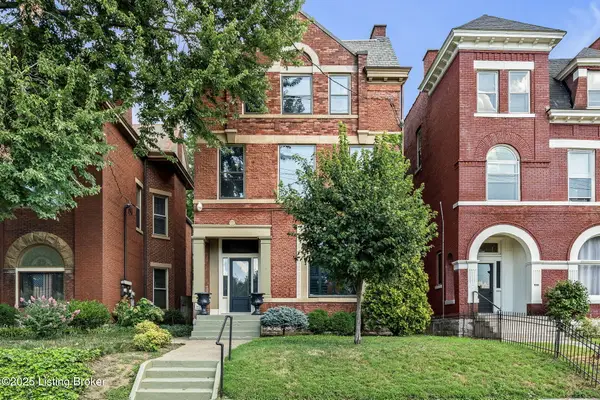 $670,000Active4 beds 5 baths4,218 sq. ft.
1127 S 2nd St, Louisville, KY 40203
MLS# 1692232Listed by: TOTALLY ABOUT HOUSES $285,900Active3 beds 3 baths1,559 sq. ft.
412 Gwendolyn St, Louisville, KY 40203
MLS# 1699011Listed by: INVESTMENT PROPERTY GROUP,INC. $300,000Active3 beds 6 baths2,387 sq. ft.
1308 S 2nd St, Louisville, KY 40208
MLS# 1690962Listed by: JAN SCHOLTZ REALTORS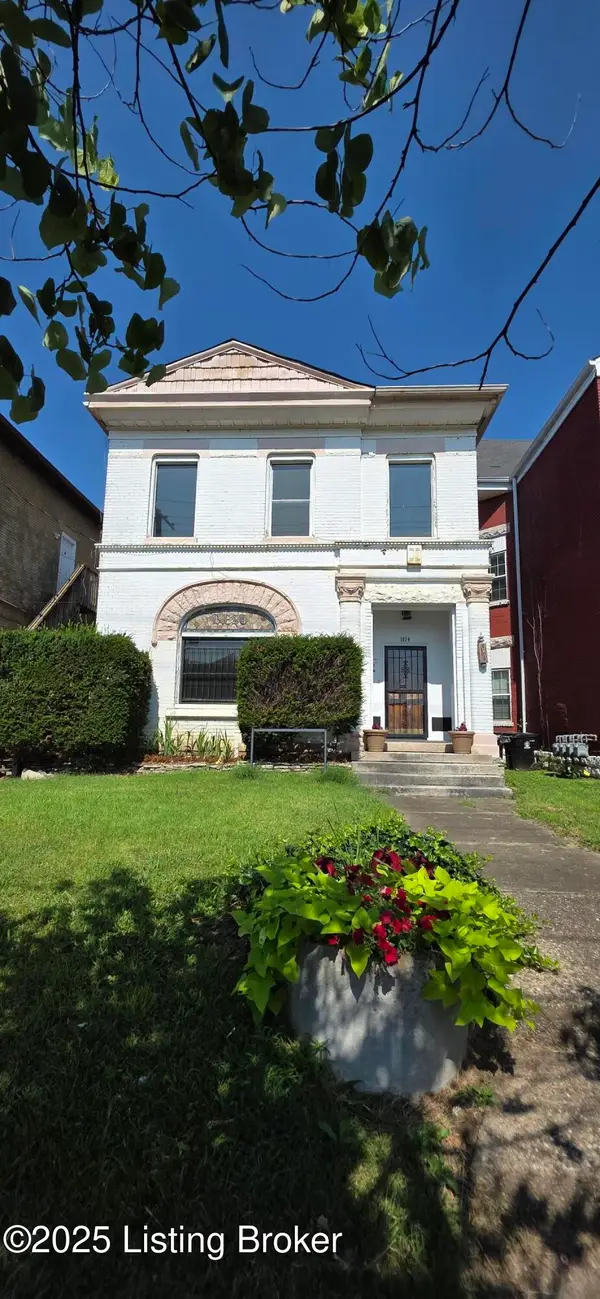 $295,000Active3 beds 3 baths2,925 sq. ft.
1014 S Floyd St, Louisville, KY 40203
MLS# 1690621Listed by: SCHULER BAUER REAL ESTATE SERVICES ERA POWERED $295,000Active2 beds 2 baths2,775 sq. ft.
1014 S Floyd St, Louisville, KY 40203
MLS# 1690613Listed by: SCHULER BAUER REAL ESTATE SERVICES ERA POWERED $124,500Active2 beds 1 baths807 sq. ft.
122 E Oak St #3, Louisville, KY 40203
MLS# 1696451Listed by: KELLER WILLIAMS COLLECTIVE $45,000Active1 beds 1 baths762 sq. ft.
1809 Owen St, Louisville, KY 40203
MLS# 1689523Listed by: KELLER WILLIAMS COLLECTIVE $50,000Pending0.08 Acres
632 E Oak St, Louisville, KY 40203
MLS# 1688104Listed by: RE SOLUTIONS LLC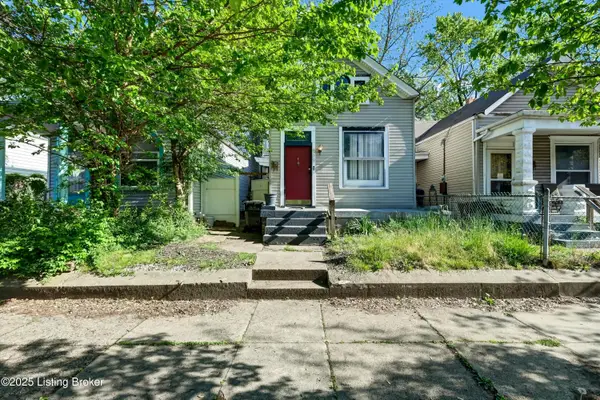 $155,000Pending2 beds 2 baths1,200 sq. ft.
519 E Oak St, Louisville, KY 40203
MLS# 1688106Listed by: RE SOLUTIONS LLC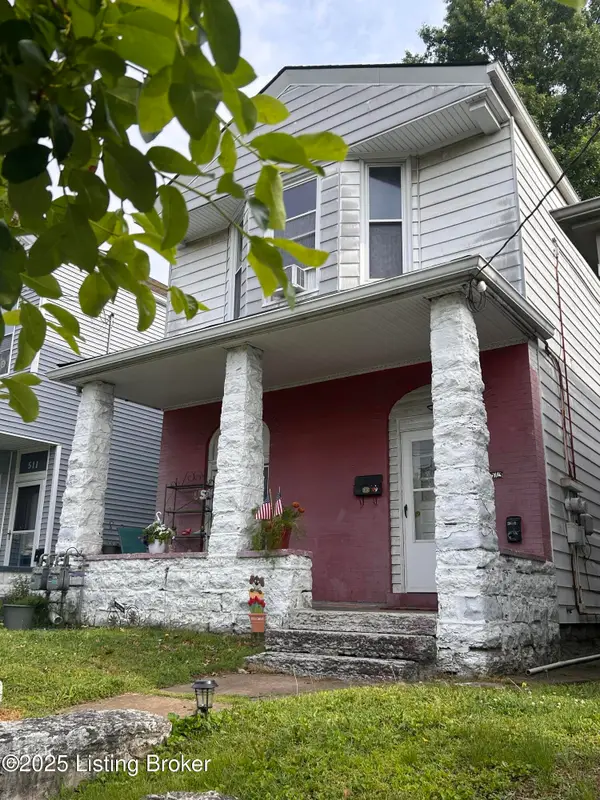 $199,500Pending2 beds 2 baths1,760 sq. ft.
513 Camp St, Louisville, KY 40203
MLS# 1694409Listed by: JAN SCHOLTZ REALTORS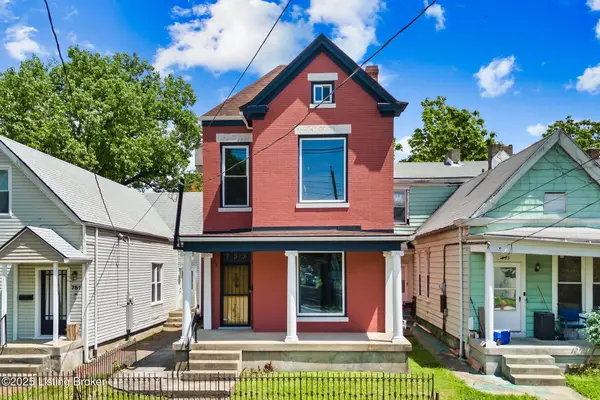 $257,500Active3 beds 2 baths2,795 sq. ft.
753 S Shelby St, Louisville, KY 40203
MLS# 1686340Listed by: 1 PERCENT LISTS PURPLE DOOR $1,000Pending3 beds 2 baths1,824 sq. ft.
415 Gwendolyn St, Louisville, KY 40203
MLS# 1685530Listed by: WEICHERT REALTORS-H. BARRY SMITH CO. $470,000Active1.84 Acres
909 S 6th St, Louisville, KY 40203
MLS# 1685082Listed by: EXP REALTY LLC $165,000Pending3 beds 2 baths1,050 sq. ft.
935 S Clay St, Louisville, KY 40203
MLS# 1697298Listed by: WEICHERT REALTORS - ABG $65,000Pending0.21 Acres
312 E Ormsby Ave, Louisville, KY 40203
MLS# 1681532Listed by: R & Y REALTY GROUP $450,000Active-- beds 5 baths4,795 sq. ft.
624 W St Catherine St, Louisville, KY 40203
MLS# 1678959Listed by: REAL ESTATE UNLIMITED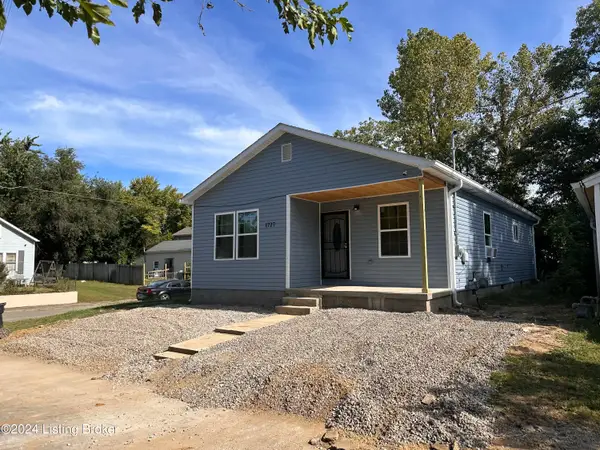 $165,000Active3 beds 2 baths1,170 sq. ft.
1727 Lytle St, Louisville, KY 40203
MLS# 1677208Listed by: UNITED REAL ESTATE LOUISVILLE $199,999Pending2 beds 2 baths1,007 sq. ft.
445 Marret Ave, Louisville, KY 40208
MLS# 1704428Listed by: JPAR ASPIRE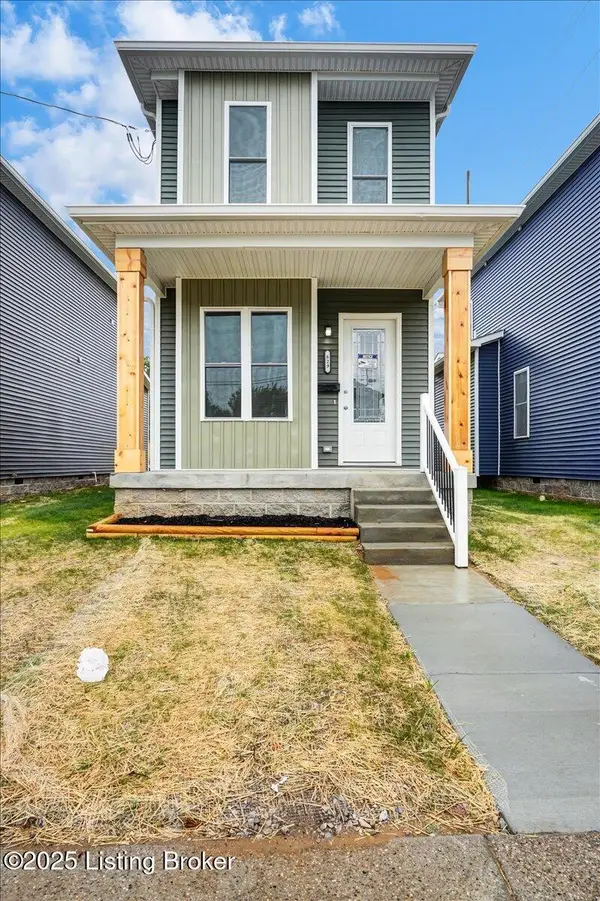 $159,900Pending3 beds 3 baths1,358 sq. ft.
629 S 19th St, Louisville, KY 40203
MLS# 1686764Listed by: LJH INFINITY REALTORS $145,000Active3 beds 2 baths1,376 sq. ft.
2006 W Market St, Louisville, KY 40203
MLS# 1677474Listed by: METRO ADVANTAGE REALTY $145,000Active3 beds 2 baths1,376 sq. ft.
2008 W Market St, Louisville, KY 40203
MLS# 1677476Listed by: METRO ADVANTAGE REALTY $145,000Active3 beds 2 baths1,376 sq. ft.
2010 W Market St, Louisville, KY 40203
MLS# 1677477Listed by: METRO ADVANTAGE REALTY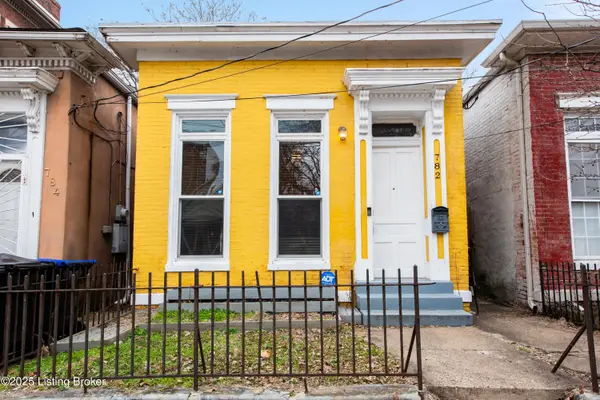 $239,000Active2 beds 1 baths1,479 sq. ft.
782 S Shelby St, Louisville, KY 40203
MLS# 1703356Listed by: KELLER WILLIAMS COLLECTIVE
Local realty services provided by:CENTURY 21 Simpson & Associates
Popular searches near 40203
Popular neighborhoods near 40203
- Algonquin, Louisville properties for sale
- Butchertown, Louisville properties for sale
- California, Louisville properties for sale
- Chickasaw, Louisville properties for sale
- Downtown, Louisville properties for sale
- East Main District, Louisville properties for sale
- Hallmark, Louisville properties for sale
- Highlands, Louisville properties for sale
- Limerick, Louisville properties for sale
- Merriwether, Louisville properties for sale
- Old Louisville, Louisville properties for sale
- Park Duvalle, Louisville properties for sale
- Park Hill, Louisville properties for sale
- Parkland, Louisville properties for sale
- Phoenix Hill, Louisville properties for sale
- Portland, Louisville properties for sale
- Russell, Louisville properties for sale
- Shawnee, Louisville properties for sale
- Shelby Park, Louisville properties for sale
- Smoketown, Louisville properties for sale
Counties near Louisville, 40203
- Bullitt County properties for sale
- Carroll County properties for sale
- Clark County properties for sale
- Crawford County properties for sale
- Floyd County properties for sale
- Hardin County properties for sale
- Harrison County properties for sale
- Henry County properties for sale
- Jefferson County properties for sale
- Jefferson County properties for sale
- Meade County properties for sale
- Nelson County properties for sale
- Oldham County properties for sale
- Orange County properties for sale
- Scott County properties for sale
- Shelby County properties for sale
- Spencer County properties for sale
- Trimble County properties for sale
- Washington County properties for sale
- Washington County properties for sale
©2025 Century 21 Real Estate LLC. All rights reserved. CENTURY 21®, the CENTURY 21 Logo and C21® are service marks owned by Century 21 Real Estate LLC. Century 21 Real Estate LLC fully supports the principles of the Fair Housing Act and the Equal Opportunity Act. Each office is independently owned and operated. Listing information is deemed reliable but not guaranteed accurate.
©2025 Century 21 Real Estate LLC. All rights reserved. CENTURY 21®, the CENTURY 21 Logo and C21® are service marks owned by Century 21 Real Estate LLC. Century 21 Real Estate LLC fully supports the principles of the Fair Housing Act and the Equal Opportunity Act. Each office is independently owned and operated. Listing information is deemed reliable but not guaranteed accurate.