- Camelot Independent Retirement Village, Harlingen homes for sale
- César Chávez, Edinburg homes for sale
- Cottonwood Country Club & Golf Course, Harlingen homes for sale
- Country Club Place, Edinburg homes for sale
- Edcouch, Edcouch homes for sale
- Edinburg Townsite, Edinburg homes for sale
- Encantada-Ranchito El Calaboz, San Benito homes for sale
- La Paloma, San Benito homes for sale
- La Sienna, Edinburg homes for sale
- Lopezville, San Juan homes for sale
- Los Lagos, Edinburg homes for sale
- Mercedes Original Townsite, Mercedes homes for sale
- Monte Cristo, Edinburg homes for sale
- Muniz, Edinburg homes for sale
- North Alamo, San Juan homes for sale
- Nurillo, Edinburg homes for sale
- Palm Valley, Harlingen homes for sale
- South Alamo, Alamo homes for sale
- Tierra Santa, Weslaco homes for sale
- Treasure Hills, Harlingen homes for sale
Lyford, TX - homes for sale
3 of 3 results displayed
- New
 $35,000Active0.14 Acres
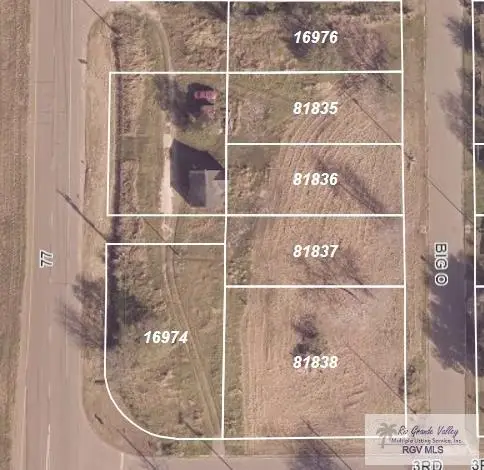
7901 Big O Ave, LYFORD, TX 78569
MLS# 29775152Listed by: COLDWELL BANKER LA MANSION REAL ESTATE BROWNSVILLE  $105,000Active0.41 Acres
7901 Big O Ave, LYFORD, TX 78569
MLS# 29772008Listed by: COLDWELL BANKER LA MANSION REAL ESTATE BROWNSVILLE $225,000Pending10 Acres
9530 N Expressway 77 Freeway, Lyford, TX 78569
MLS# 477798Listed by: A. Reyes & Associates
Local realty services provided by:CENTURY 21 Johnston Company
Neighborhoods near Lyford, TX
Zip codes near Lyford, TX
- 78535 homes for sale
- 78538 homes for sale
- 78542 homes for sale
- 78543 homes for sale
- 78549 homes for sale
- 78550 homes for sale
- 78552 homes for sale
- 78559 homes for sale
- 78561 homes for sale
- 78562 homes for sale
- 78568 homes for sale
- 78569 homes for sale
- 78570 homes for sale
- 78580 homes for sale
- 78583 homes for sale
- 78590 homes for sale
- 78593 homes for sale
- 78594 homes for sale
- 78598 homes for sale
- 78599 homes for sale
Popular searches near Lyford, TX
- Combes homes for sale
- Edcouch homes for sale
- Edcouch-Elsa homes for sale
- Elsa homes for sale
- Hargill homes for sale
- Harlingen-San Benito homes for sale
- Heidelberg homes for sale
- Indian Hills homes for sale
- La Blanca homes for sale
- La Feria North homes for sale
- La Villa homes for sale
- Las Palmas II homes for sale
- Lasara homes for sale
- Monte Alto homes for sale
- Palm Valley homes for sale
- Primera homes for sale
- Raymondville homes for sale
- San Perlita homes for sale
- Santa Rosa homes for sale
- Sebastian homes for sale
Protect your home and budget from life's surprises with an Assurant Home Warranty, backed by a partner that supports you through every step of homeownership. Explore Plans.
©2026 Century 21 Real Estate LLC. All rights reserved. CENTURY 21®, the CENTURY 21 Logo and C21® are service marks owned by Century 21 Real Estate LLC. Century 21 Real Estate LLC fully supports the principles of the Fair Housing Act and the Equal Opportunity Act. Each office is independently owned and operated. Listing information is deemed reliable but not guaranteed accurate.