- Amberley, Cincinnati homes for sale
- Bofinger & Hopkins, Cincinnati homes for sale
- Columbia-Tusculum, Cincinnati homes for sale
- Deer Park, Cincinnati homes for sale
- Elsmere, Cincinnati homes for sale
- Fairfax, Cincinnati homes for sale
- Hyde Park, Cincinnati homes for sale
- Hyde Park East, Cincinnati homes for sale
- Kennedy Heights, Cincinnati homes for sale
- Kenwood, Cincinnati homes for sale
- Linwood, Cincinnati homes for sale
- Madeira, Cincinnati homes for sale
- Mariemont, Cincinnati homes for sale
- Mt Lookout, Cincinnati homes for sale
- Norwood, Cincinnati homes for sale
- Oakley, Cincinnati homes for sale
- Pleasant Ridge, Cincinnati homes for sale
- Silverton, Cincinnati homes for sale
- Turpin Hills, Cincinnati homes for sale
- Village of Golf Manor, Cincinnati homes for sale
Madisonville, Cincinnati, OH - homes for sale
41 of 41 results displayed
- New
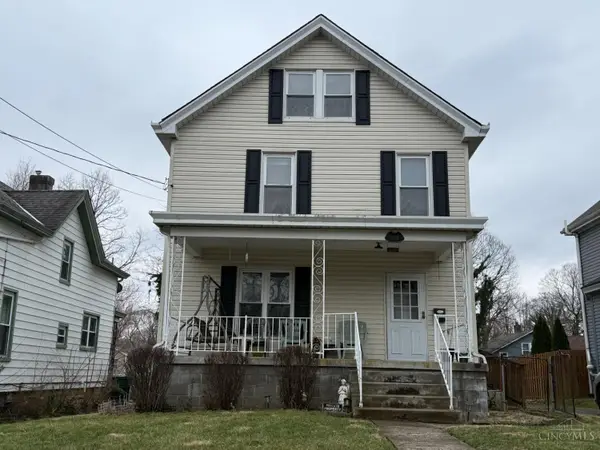
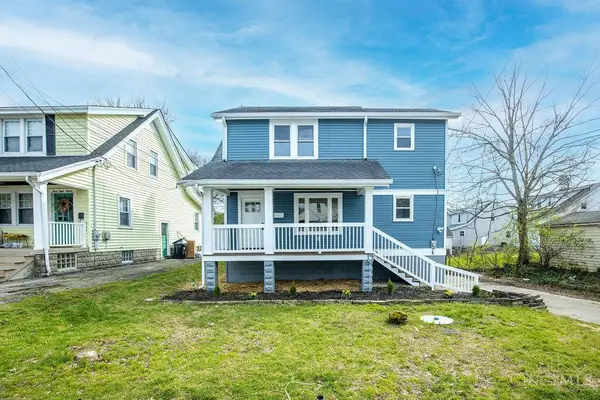 $415,000Active4 beds 3 baths
6813 Merwin Avenue, Cincinnati, OH 45227
MLS# 1872765Listed by: PLUM TREE REALTY
- New
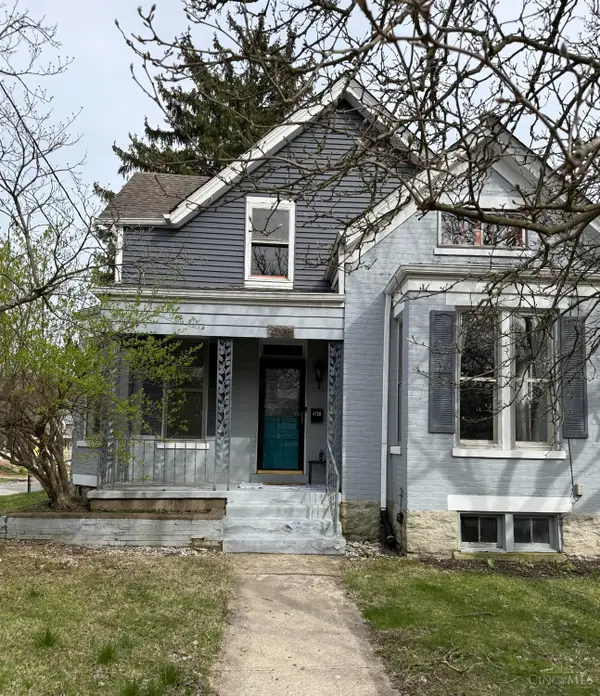 $289,900Active3 beds 1 baths1,576 sq. ft.
4726 Castle Place, Cincinnati, OH 45227
MLS# 1872803Listed by: BF REALTY 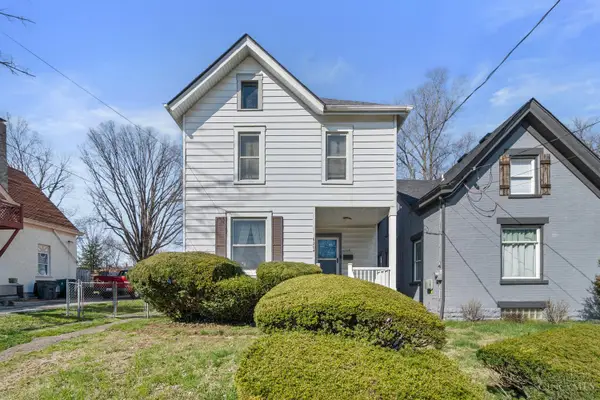 $190,000Pending3 beds 2 baths1,482 sq. ft.
6204 Prentice Street, Cincinnati, OH 45227
MLS# 1872469Listed by: EXP REALTY- New
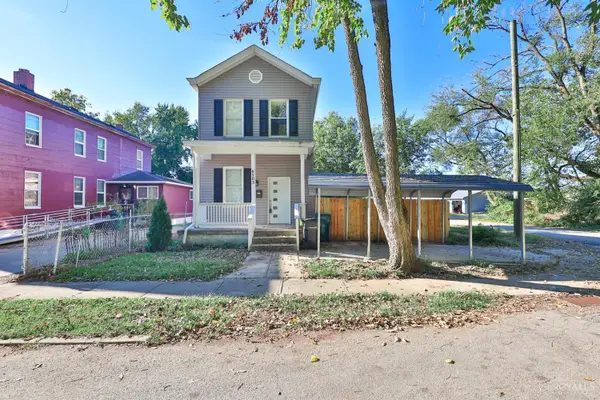 $299,000Active2 beds 2 baths1,064 sq. ft.
6503 E Ledge Street, Cincinnati, OH 45227
MLS# 1872345Listed by: SIBCY CLINE, INC. - New
 $325,000Active4 beds 2 baths
5709 Adelphi Street, Cincinnati, OH 45227
MLS# 1870360Listed by: KELLER WILLIAMS ADVISORS 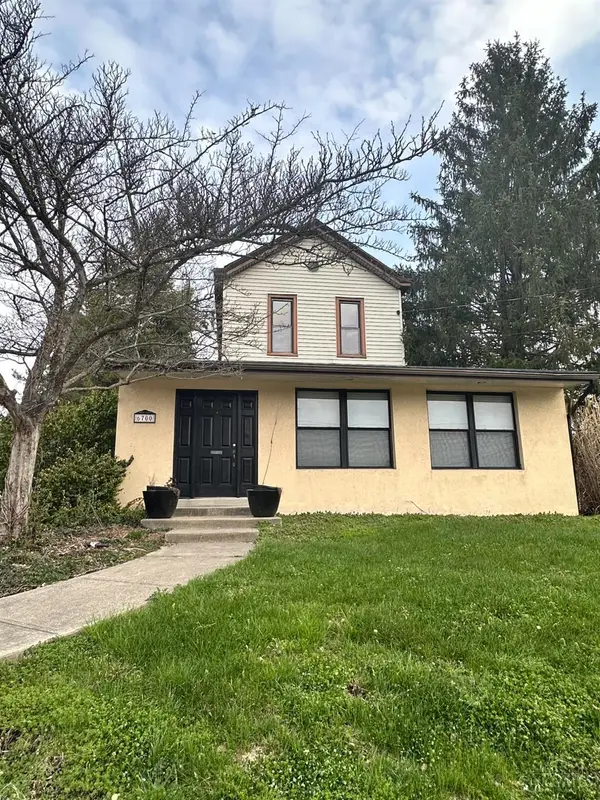 $299,000Active3 beds 2 baths2,808 sq. ft.
6700 Madison Road, Cincinnati, OH 45227
MLS# 1872088Listed by: COLDWELL BANKER REALTY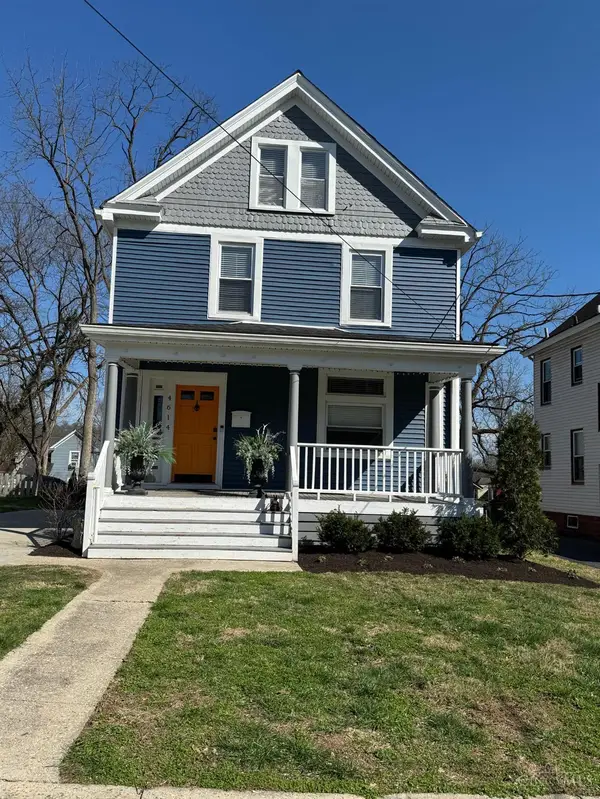 $575,000Active3 beds 3 baths1,959 sq. ft.
4614 Simpson Avenue, Cincinnati, OH 45227
MLS# 1868760Listed by: COLDWELL BANKER REALTY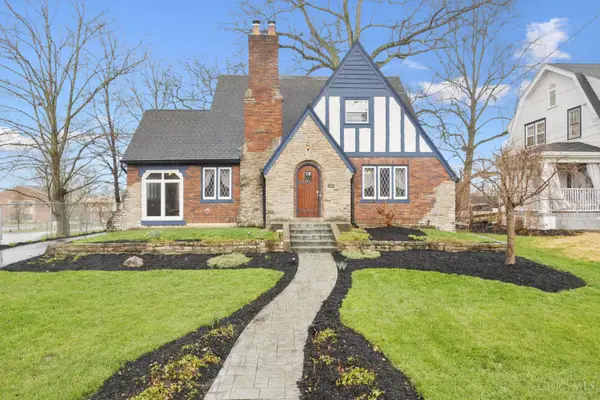 $535,000Pending4 beds 2 baths2,842 sq. ft.
5055 Anderson Place, Cincinnati, OH 45227
MLS# 1871314Listed by: COLDWELL BANKER REALTY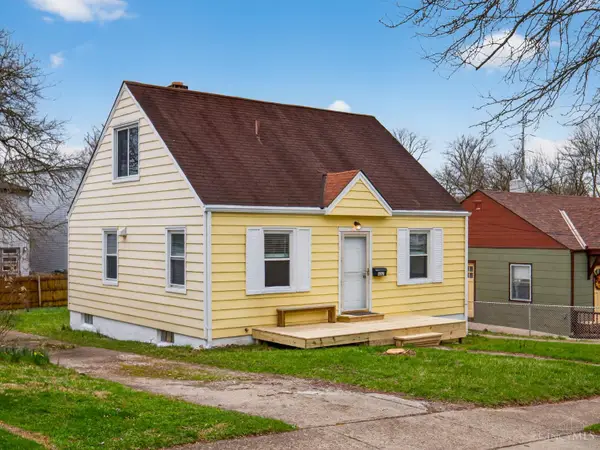 $199,000Pending3 beds 1 baths1,110 sq. ft.
5229 Charloe Street, Cincinnati, OH 45227
MLS# 1871091Listed by: KELLER WILLIAMS ADVISORS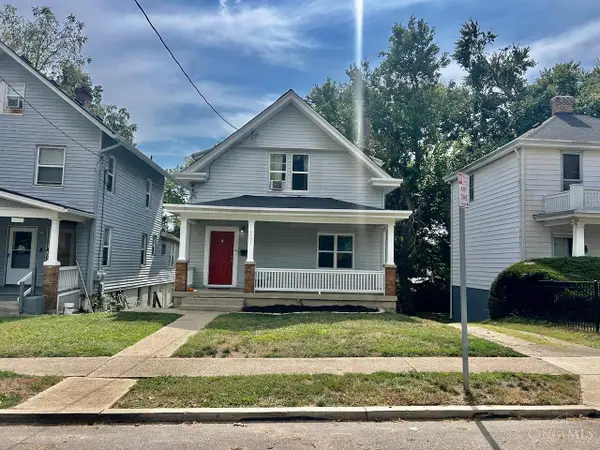 $224,900Pending3 beds 1 baths1,402 sq. ft.
6001 Bramble Avenue, Cincinnati, OH 45227
MLS# 1871183Listed by: RE/MAX VICTORY + AFFILIATES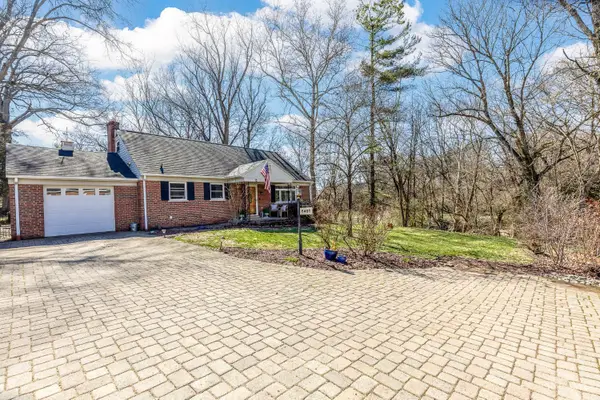 $379,000Pending3 beds 2 baths2,064 sq. ft.
6497 Merwin Avenue, Cincinnati, OH 45227
MLS# 1871059Listed by: COMEY & SHEPHERD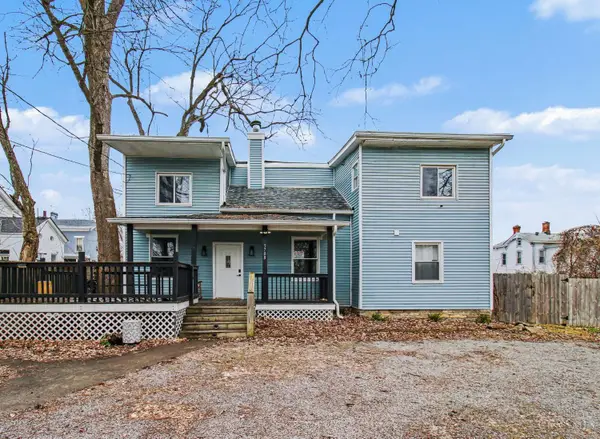 $280,000Active4 beds 2 baths1,786 sq. ft.
5708 Carothers, Cincinnati, OH 45227
MLS# 1870891Listed by: COLDWELL BANKER REALTY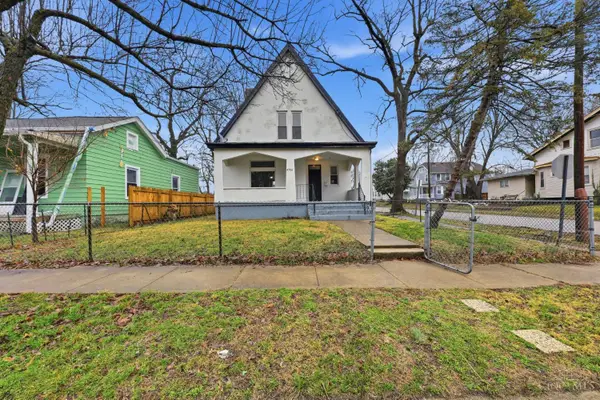 $249,900Active2 beds 2 baths1,573 sq. ft.
4700 Ward Street, Cincinnati, OH 45227
MLS# 1870882Listed by: TRELORA REALTY, INC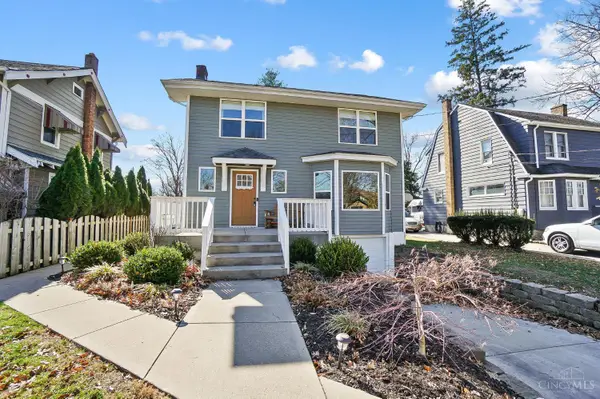 $525,000Pending3 beds 3 baths1,477 sq. ft.
6613 Bramble Avenue, Cincinnati, OH 45227
MLS# 1868285Listed by: KELLER WILLIAMS ADVISORS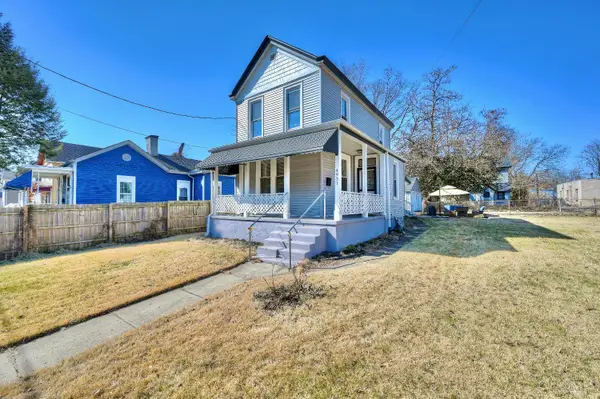 $350,000Pending3 beds 2 baths1,346 sq. ft.
4931 Jameson Street, Cincinnati, OH 45227
MLS# 1868047Listed by: HUFF REALTY $249,000Active3 beds 2 baths1,344 sq. ft.
4817 Plainville Road, Cincinnati, OH 45227
MLS# 1870145Listed by: KELLER WILLIAMS SEVEN HILLS RE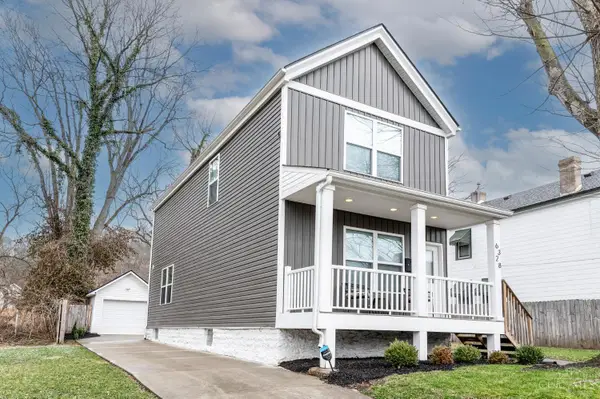 $399,900Active3 beds 3 baths1,280 sq. ft.
6328 Desmond Street, Cincinnati, OH 45227
MLS# 1869895Listed by: COLDWELL BANKER REALTY $450,000Active4 beds 3 baths2,624 sq. ft.
4703 Stewart Avenue, Cincinnati, OH 45227
MLS# 1869269Listed by: KELLER WILLIAMS ADVISORS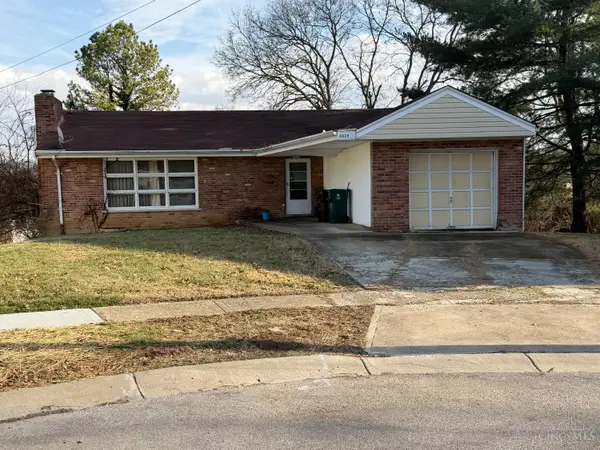 $250,000Pending4 beds 2 baths2,385 sq. ft.
4928 Kelsch Lane, Cincinnati, OH 45227
MLS# 1869200Listed by: COMEY & SHEPHERD $480,000Active5 beds 2 baths2,459 sq. ft.
5317 Whetsel Avenue, Cincinnati, OH 45227
MLS# 1868523Listed by: PLUM TREE REALTY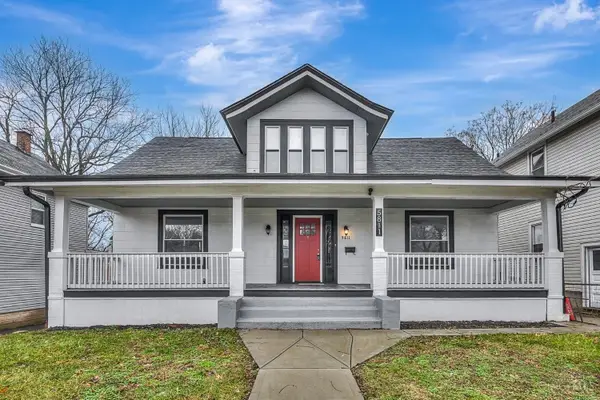 $424,990Active4 beds 4 baths2,343 sq. ft.
5811 Bramble Avenue, Cincinnati, OH 45227
MLS# 1870219Listed by: LOHMILLER REAL ESTATE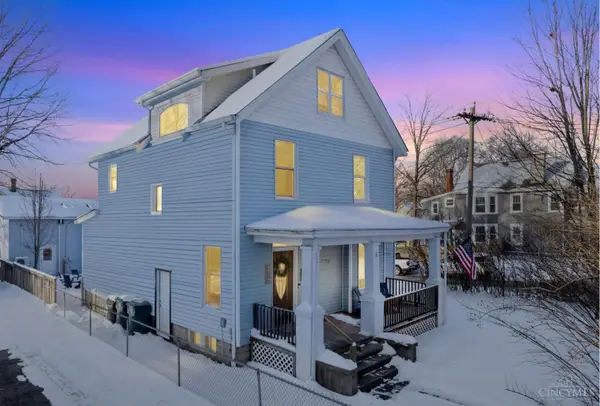 $529,000Active3 beds 4 baths1,930 sq. ft.
6017 Bramble Avenue, Cincinnati, OH 45227
MLS# 1867860Listed by: COLDWELL BANKER REALTY $150,000Active2 beds 1 baths1,002 sq. ft.
5116 Ravenna Street, Cincinnati, OH 45227
MLS# 1867392Listed by: KELLER WILLIAMS ADVISORS $374,900Active3 beds 2 baths1,312 sq. ft.
4424 Simpson Avenue, Cincinnati, OH 45227
MLS# 1867147Listed by: REAL ESTATE PROFESSIONALS, LLC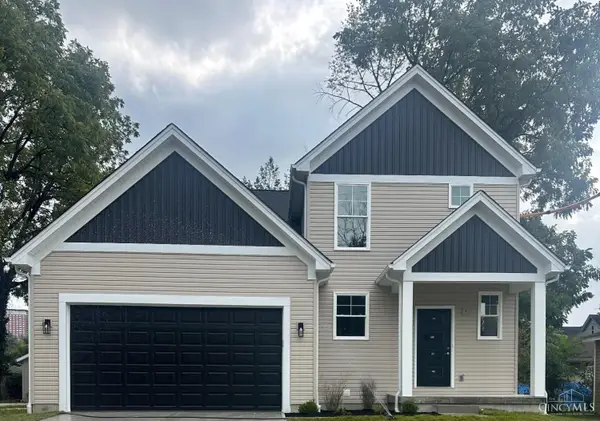 $599,900Pending5 beds 4 baths3,200 sq. ft.
5312 Dora Avenue, Cincinnati, OH 45227
MLS# 1867265Listed by: KELLER WILLIAMS SEVEN HILLS RE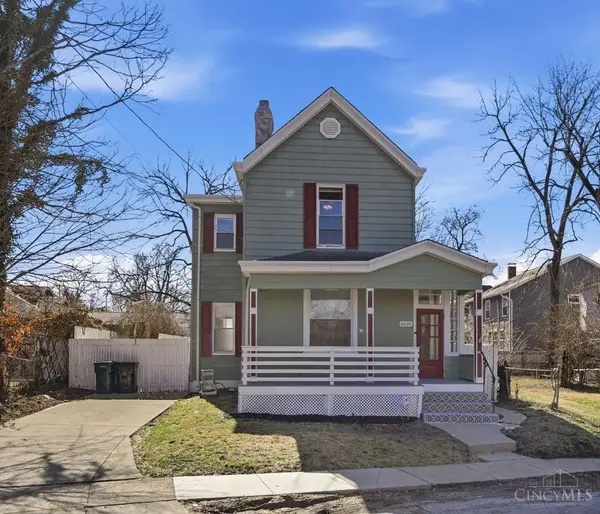 $269,000Pending3 beds 2 baths1,390 sq. ft.
6009 Erie Avenue, Cincinnati, OH 45227
MLS# 1869922Listed by: COLDWELL BANKER REALTY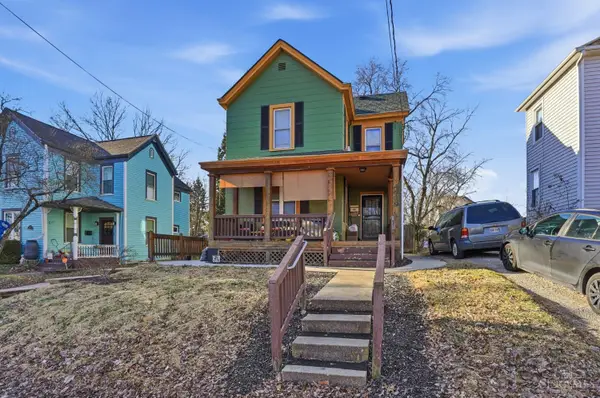 $285,000Active2 beds 3 baths1,456 sq. ft.
4719 Castle Place, Cincinnati, OH 45227
MLS# 1864892Listed by: KELLER WILLIAMS ADVISORS $279,900Active2 beds 2 baths1,066 sq. ft.
5807 Prentice Street, Cincinnati, OH 45227
MLS# 1864857Listed by: SIBCY CLINE, INC. $229,900Pending2 beds 2 baths1,308 sq. ft.
5708 Sierra Park Place, Cincinnati, OH 45227
MLS# 1864748Listed by: CHOSEN REAL ESTATE GROUP $173,900Pending2 beds 1 baths716 sq. ft.
5320 Ward Street, Cincinnati, OH 45227
MLS# 1865309Listed by: BEYCOME BROKERAGE REALTY LLC $194,000Active3 beds 1 baths1,110 sq. ft.
5305 Charloe Street, Cincinnati, OH 45227
MLS# 1863264Listed by: HARTLAND MANAGEMENT & REALTY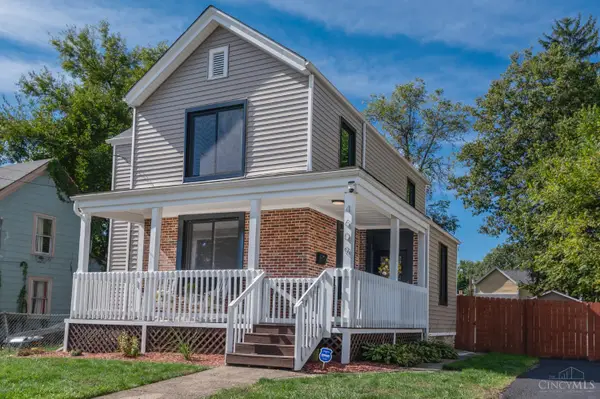 $399,900Active3 beds 4 baths1,536 sq. ft.
4609 Winona Terrace, Cincinnati, OH 45227
MLS# 1864597Listed by: COLDWELL BANKER REALTY $229,999Active4 beds 1 baths1,408 sq. ft.
5213 Kenwood Road, Cincinnati, OH 45227
MLS# 1858055Listed by: COLDWELL BANKER REALTY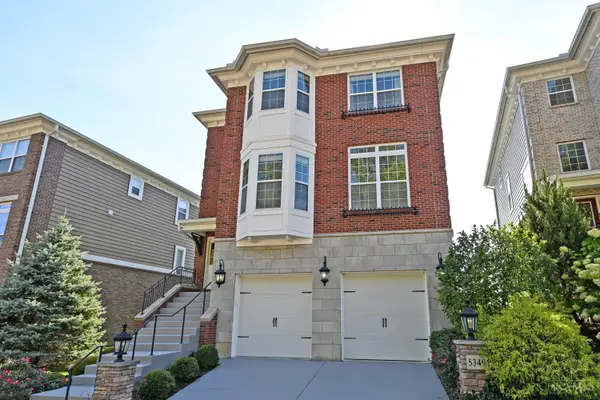 $870,000Active4 beds 5 baths3,506 sq. ft.
5349 Grand Vista Court, Cincinnati, OH 45227
MLS# 1864853Listed by: COMEY & SHEPHERD $990,000Active3 beds 5 baths
3767 Miami Run #lot 8, Mariemont, OH 45227
MLS# 1825828Listed by: JORDAN, INC. $125,000Active1 beds 1 baths816 sq. ft.
5619 Chandler Street, Cincinnati, OH 45227
MLS# 1843024Listed by: COLDWELL BANKER REALTY $519,900Pending3 beds 4 baths2,031 sq. ft.
5007 Anderson Place #5, Cincinnati, OH 45227
MLS# 1841981Listed by: REAL LINK $508,900Active2 beds 4 baths1,910 sq. ft.
5005 Anderson Place #6, Cincinnati, OH 45227
MLS# 1841983Listed by: REAL LINK $519,900Active3 beds 4 baths2,000 sq. ft.
5001 Anderson Place #8, Cincinnati, OH 45227
MLS# 1841947Listed by: REAL LINK $499,900Active2 beds 4 baths1,910 sq. ft.
5003 Anderson Place #7, Cincinnati, OH 45227
MLS# 1841965Listed by: REAL LINK $1,060,000Active3 beds 5 baths
3746 Miami Run #lot18, Mariemont, OH 45227
MLS# 1825841Listed by: JORDAN, INC.
Local realty services provided by:CENTURY 21 Premiere Properties
Information deemed reliable but not guaranteed. The data relating to real estate for sale on this web site comes in part from the Broker Reciprocity program of the Multiple Listing Service of Greater Cincinnati. Real estate listings held by brokerage firms other than CENTURY 21 Premiere Properties are marked with the Broker Reciprocity™ logo (the small house as shown to the left) and detailed information about them includes the name of the listing brokers. 2026, MLS of Greater Cincinnati, Inc. All rights reserved.
Popular neighborhoods near Madisonville, Cincinnati, OH
Zip codes near Madisonville, Cincinnati, OH
- 41073 homes for sale
- 41074 homes for sale
- 45174 homes for sale
- 45206 homes for sale
- 45207 homes for sale
- 45208 homes for sale
- 45209 homes for sale
- 45212 homes for sale
- 45213 homes for sale
- 45216 homes for sale
- 45217 homes for sale
- 45226 homes for sale
- 45227 homes for sale
- 45229 homes for sale
- 45230 homes for sale
- 45232 homes for sale
- 45236 homes for sale
- 45237 homes for sale
- 45243 homes for sale
- 45244 homes for sale
Counties near Madisonville, Cincinnati, OH
- Boone County homes for sale
- Bracken County homes for sale
- Brown County homes for sale
- Butler County homes for sale
- Campbell County homes for sale
- Clermont County homes for sale
- Clinton County homes for sale
- Dearborn County homes for sale
- Franklin County homes for sale
- Gallatin County homes for sale
- Grant County homes for sale
- Hamilton County homes for sale
- Highland County homes for sale
- Kenton County homes for sale
- Montgomery County homes for sale
- Ohio County homes for sale
- Pendleton County homes for sale
- Preble County homes for sale
- Switzerland County homes for sale
- Warren County homes for sale
Protect your home and budget from life's surprises with an Assurant Home Warranty, backed by a partner that supports you through every step of homeownership. Explore Plans.
©2026 Century 21 Real Estate LLC. All rights reserved. CENTURY 21®, the CENTURY 21 Logo and C21® are service marks owned by Century 21 Real Estate LLC. Century 21 Real Estate LLC fully supports the principles of the Fair Housing Act and the Equal Opportunity Act. Each office is independently owned and operated. Listing information is deemed reliable but not guaranteed accurate.