- Arnold, Arnold homes for sale
- Barnhart, Barnhart homes for sale
- Carondelet, Saint Louis homes for sale
- Claremont, East Saint Louis homes for sale
- Crystal City, Crystal City homes for sale
- Dutchtown, Saint Louis homes for sale
- Fountain Place, Fairview Heights homes for sale
- Holly Hills, Saint Louis homes for sale
- Imperial, Imperial homes for sale
- Lemay, Saint Louis homes for sale
- Marine Villa, Saint Louis homes for sale
- Mehlville, Saint Louis homes for sale
- Mount Pleasant, Saint Louis homes for sale
- Oakville, Saint Louis homes for sale
- Patch, Saint Louis homes for sale
- Reunion, Belleville homes for sale
- Soulard, Saint Louis homes for sale
- South County, Saint Louis homes for sale
- Tanglewood, Caseyville homes for sale
- The Orchards, Belleville homes for sale
Makanda, IL - homes for sale
10 of 10 results displayed
 $149,900Active2.4 Acres
000 S Highway 51 Highway, Makanda, IL 62958
MLS# EB450164Listed by: COMMERCIAL REALTY ASSOCIATES
 $45,000Active1 Acres
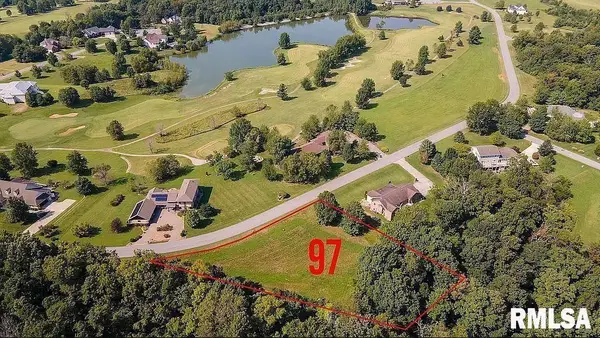
Lot 97 Stone Creek Drive, Makanda, IL 62958
MLS# EB450997Listed by: RE/MAX REALTY CENTRAL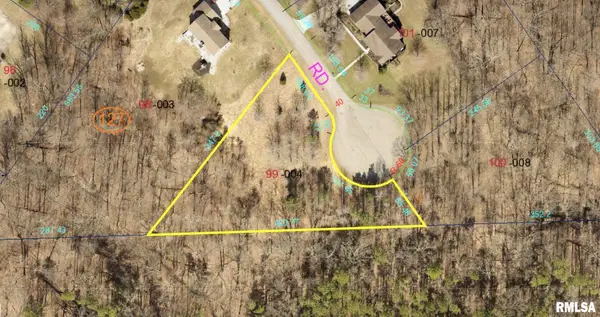 $90,000Active1.18 Acres
Lot 99 Bunker Road, Makanda, IL 62958
MLS# EB455690Listed by: RE/MAX REALTY CENTRAL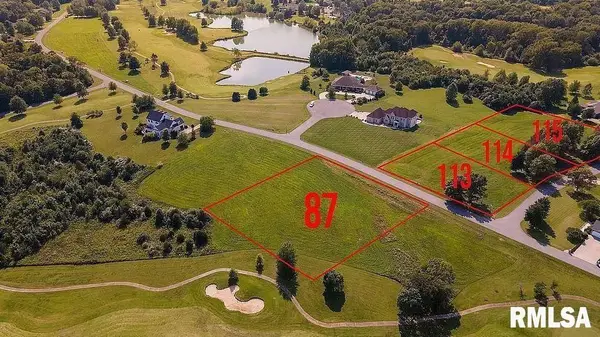 $52,000Active1.1 Acres
Lot 87 Stone Creek Drive, Makanda, IL 62958
MLS# EB459876Listed by: RE/MAX REALTY CENTRAL $75,000Active1.03 Acres
Lot 49 Stonecreek Drive, Makanda, IL 62958
MLS# EB460115Listed by: RE/MAX REALTY CENTRAL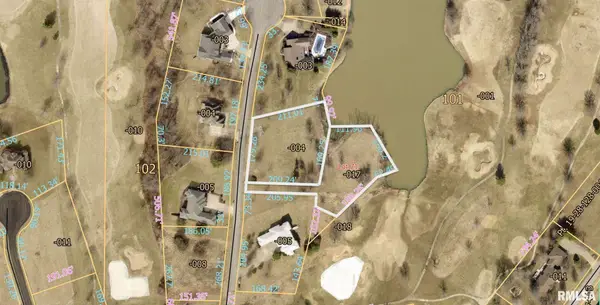 $199,000Active2 Acres
136 Stonelake Drive, Makanda, IL 62958
MLS# EB460126Listed by: RE/MAX REALTY CENTRAL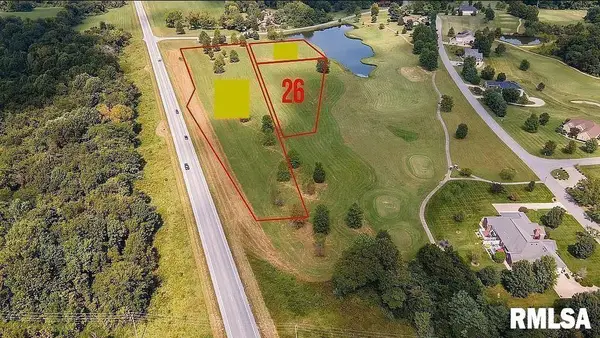 $100,000Active1.21 Acres
Lot 26 Virginia Drive, Makanda, IL 62958
MLS# EB460264Listed by: RE/MAX REALTY CENTRAL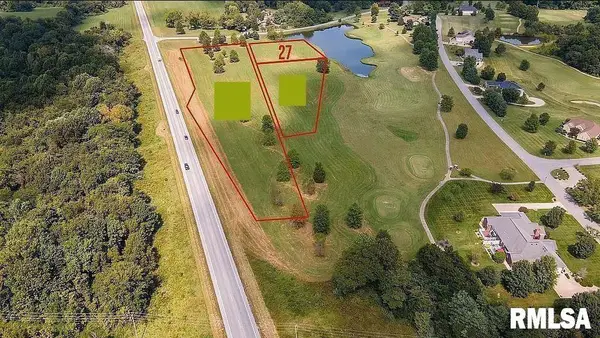 $100,000Active1.01 Acres
Lot 27 Virginia Drive, Makanda, IL 62958
MLS# EB460265Listed by: RE/MAX REALTY CENTRAL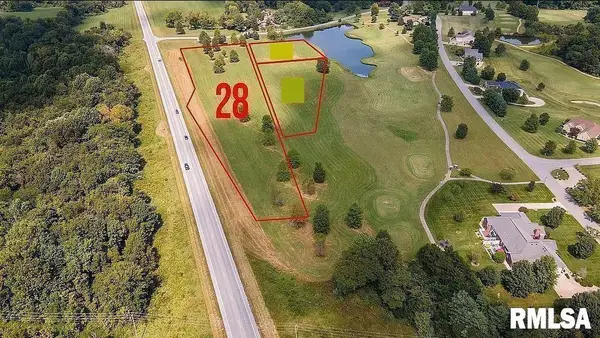 $150,000Active3.4 Acres
Lot 28 Highway 51 Highway, Makanda, IL 62958
MLS# EB460266Listed by: RE/MAX REALTY CENTRAL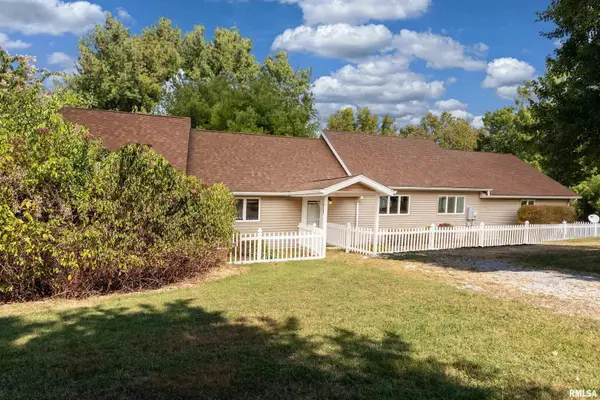 $350,000Active3 beds 2 baths2,160 sq. ft.
350 Oak Grove Road, Makanda, IL 62958
MLS# EB459867Listed by: RE/MAX REALTY CENTRAL
Local realty services provided by:CENTURY 21 North East
Copyright 2026 Midwest Real Estate Data LLC. All rights reserved. The data relating to real estate for sale on this web site comes in part from the Broker Reciprocity Program of the Midwest Real Estate Data LLC. Listing information is deemed reliable but not guaranteed.
Neighborhoods near Makanda, IL
Zip codes near Makanda, IL
- 62901 homes for sale
- 62902 homes for sale
- 62903 homes for sale
- 62905 homes for sale
- 62906 homes for sale
- 62912 homes for sale
- 62915 homes for sale
- 62918 homes for sale
- 62920 homes for sale
- 62924 homes for sale
- 62926 homes for sale
- 62933 homes for sale
- 62939 homes for sale
- 62948 homes for sale
- 62949 homes for sale
- 62952 homes for sale
- 62958 homes for sale
- 62966 homes for sale
- 62983 homes for sale
- 63732 homes for sale
Popular searches near Makanda, IL
- Alto Pass homes for sale
- Alto Pass Precinct homes for sale
- Anna homes for sale
- Cambria homes for sale
- Carbondale homes for sale
- Carbondale homes for sale
- Carbondale Township homes for sale
- Carterville homes for sale
- Carterville Precinct homes for sale
- Cobden homes for sale
- De Soto homes for sale
- Grassy homes for sale
- Jonesboro homes for sale
- Lick Creek homes for sale
- Makanda homes for sale
- Makanda Township homes for sale
- Murphysboro homes for sale
- Murphysboro Township homes for sale
- Pomona homes for sale
- Sand Ridge homes for sale
Protect your home and budget from life's surprises with an Assurant Home Warranty, backed by a partner that supports you through every step of homeownership. Explore Plans.
©2026 Century 21 Real Estate LLC. All rights reserved. CENTURY 21®, the CENTURY 21 Logo and C21® are service marks owned by Century 21 Real Estate LLC. Century 21 Real Estate LLC fully supports the principles of the Fair Housing Act and the Equal Opportunity Act. Each office is independently owned and operated. Listing information is deemed reliable but not guaranteed accurate.