- Anderson Creek Club, Spring Lake homes for sale
- Bonnie Doone, Fayetteville homes for sale
- Brookwood, Fayetteville homes for sale
- Carolina Trace, Sanford homes for sale
- College Lakes, Fayetteville homes for sale
- Cumberland Heights, Fayetteville homes for sale
- Eutaw, Fayetteville homes for sale
- Fort Bragg, Vass homes for sale
- Hillendale, Fayetteville homes for sale
- Holly Glen, Holly Springs homes for sale
- King's Grant, Fayetteville homes for sale
- Kings Grant Club, Fayetteville homes for sale
- LaGrange, Fayetteville homes for sale
- Scotts Mill, Apex homes for sale
- Scotty Hill, Fayetteville homes for sale
- Sunset Ridge, Holly Springs homes for sale
- Terry Sanford, Fayetteville homes for sale
- Twelve Oaks, Holly Springs homes for sale
- Westover, Fayetteville homes for sale
- Woodlake, Vass homes for sale
Mamers, NC - homes for sale
15 of 15 results displayed
 $399,900Active3 beds 3 baths1,964 sq. ft.
542 C P Stewart Road, Lillington, NC 27546
MLS# 10152120Listed by: EXP REALTY LLC $325,000Active-- beds 3 baths1,792 sq. ft.
8063 Old Us 421 S, Lillington, NC 27546
MLS# 10151712Listed by: NCRE GROUP INC.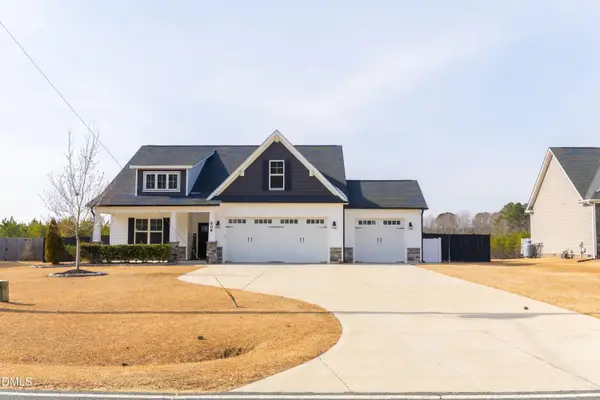 $530,000Active3 beds 3 baths3,020 sq. ft.
606 C P Stewart Road, Lillington, NC 27546
MLS# 10143981Listed by: LPT REALTY, LLC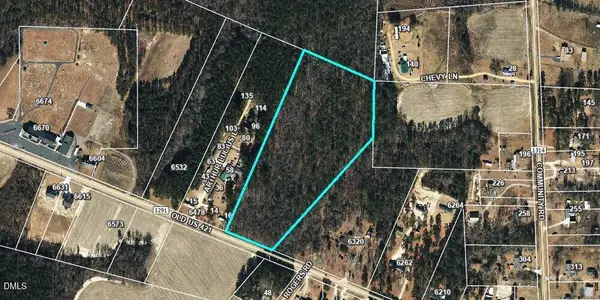 $194,900Active10.35 Acres
0 Old Us 421 Highway, Lillington, NC 27546
MLS# 10143267Listed by: RE/MAX SIGNATURE REALTY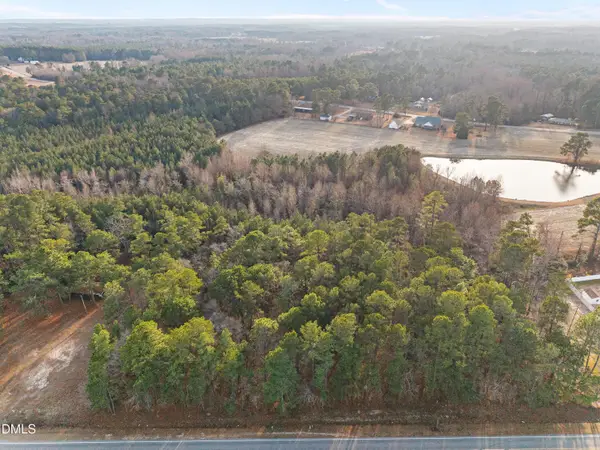 $65,000Active0.68 Acres
8431 Old Us Highway 421, Lillington, NC 27546
MLS# 10140469Listed by: PEAK REALTY GROUP NC LLC $65,000Active0.68 Acres
8407 Old Us Hwy 421, Lillington, NC 27546
MLS# 10140474Listed by: PEAK REALTY GROUP NC LLC $275,000Active13.03 Acres
683 Adcock Parent And Tract A Road, Lillington, NC 27546
MLS# 10138798Listed by: CHOICE RESIDENTIAL REAL ESTATE $194,900Active10.35 Acres
Old Us 421 Highway, Lillington, NC 27546
MLS# 748953Listed by: RE/MAX SIGNATURE REALTY $675,000Pending1 beds 1 baths607 sq. ft.
1285 Cool Springs Road, Lillington, NC 27546
MLS# LP750977Listed by: ONNIT REALTY GROUP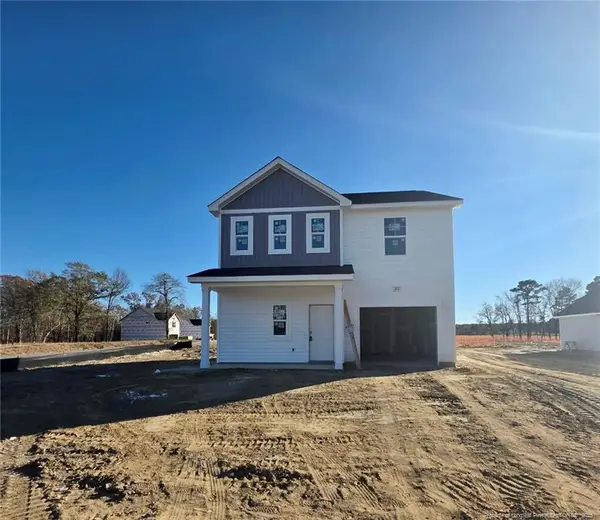 $314,900Active3 beds 3 baths1,790 sq. ft.
372 Hookbill (lot 106) Lane, Lillington, NC 27546
MLS# LP747572Listed by: COLDWELL BANKER ADVANTAGE - FAYETTEVILLE $301,900Active3 beds 2 baths1,584 sq. ft.
355 Hookbill (lot 25) Lane, Lillington, NC 27546
MLS# LP747575Listed by: COLDWELL BANKER ADVANTAGE - FAYETTEVILLE $294,900Active3 beds 2 baths1,536 sq. ft.
369 Hookbill (lot 26) Lane, Lillington, NC 27546
MLS# LP747554Listed by: COLDWELL BANKER ADVANTAGE - FAYETTEVILLE $364,000Pending3 beds 3 baths1,964 sq. ft.
70 Camp Rock Road, Lillington, NC 27546
MLS# LP745387Listed by: LGI REALTY NC, LLC. $414,900Active4 beds 3 baths2,397 sq. ft.
136 Camp Rock Road, Lillington, NC 27546
MLS# LP744494Listed by: LGI REALTY NC, LLC. $388,900Active4 beds 2 baths1,871 sq. ft.
127 Camp Rock Road, Lillington, NC 27546
MLS# LP744486Listed by: LGI REALTY NC, LLC.
Local realty services provided by:CENTURY 21 Total Real Estate Solutions, CENTURY 21 The Realty Group
Listings marked with a Doorify MLS icon are provided courtesy of the Doorify MLS, of North Carolina, Internet Data Exchange Database. Brokers make an effort to deliver accurate information, but buyers should independently verify any information on which they will rely in a transaction. The listing broker shall not be responsible for any typographical errors, misinformation, or misprints, and they shall be held totally harmless from any damages arising from reliance upon this data. This data is provided exclusively for consumers’ personal, non-commercial use. Copyright 2026 Doorify MLS of North Carolina. All rights reserved.
Neighborhoods near Mamers, NC
Zip codes near Mamers, NC
- 27330 homes for sale
- 27332 homes for sale
- 27501 homes for sale
- 27502 homes for sale
- 27505 homes for sale
- 27521 homes for sale
- 27526 homes for sale
- 27539 homes for sale
- 27540 homes for sale
- 27546 homes for sale
- 27559 homes for sale
- 27562 homes for sale
- 27592 homes for sale
- 28310 homes for sale
- 28311 homes for sale
- 28323 homes for sale
- 28326 homes for sale
- 28339 homes for sale
- 28356 homes for sale
- 28390 homes for sale
Popular searches near Mamers, NC
- 2, Jonesboro homes for sale
- 3, Cape Fear homes for sale
- 5, East Sanford homes for sale
- Anderson Creek homes for sale
- Anderson Creek Township homes for sale
- Barbecue homes for sale
- Black River homes for sale
- Broadway homes for sale
- Broadway homes for sale
- Buckhorn homes for sale
- Buies Creek homes for sale
- Bunnlevel homes for sale
- Fuquay-Varina homes for sale
- Hectors Creek homes for sale
- Lillington township homes for sale
- Lillington homes for sale
- Neills Creek homes for sale
- Spout Springs homes for sale
- Stewarts Creek homes for sale
- Upper Little River homes for sale
Protect your home and budget from life's surprises with an Assurant Home Warranty, backed by a partner that supports you through every step of homeownership. Explore Plans.
©2026 Century 21 Real Estate LLC. All rights reserved. CENTURY 21®, the CENTURY 21 Logo and C21® are service marks owned by Century 21 Real Estate LLC. Century 21 Real Estate LLC fully supports the principles of the Fair Housing Act and the Equal Opportunity Act. Each office is independently owned and operated. Listing information is deemed reliable but not guaranteed accurate.