- Bullard, Fresno homes for sale
- Copper River Ranch, Fresno homes for sale
- Dakota, Fresno homes for sale
- Deauville, Clovis homes for sale
- Harlan Ranch, Clovis homes for sale
- Hoover, Fresno homes for sale
- Juniper Ridge, Mammoth Lakes homes for sale
- Loma Vista, Clovis homes for sale
- Madera Ranchos, Madera homes for sale
- Mayfair, Fresno homes for sale
- McLane, Fresno homes for sale
- Old Fig Garden, Fresno homes for sale
- Old Mammoth, Mammoth Lakes homes for sale
- Pinedale, Fresno homes for sale
- Sierra Sky Park, Fresno homes for sale
- Southeast Growth Area, Sanger homes for sale
- Sunnyside, Fresno homes for sale
- Tarpey Village, Fresno homes for sale
- Van Ness Extension, Fresno homes for sale
- Woodward Park, Fresno homes for sale
Mammoth Slopes, Mammoth Lakes, CA - homes for sale
5 of 5 results displayed
 $649,000Active1 beds 3 baths972 sq. ft.
261 Lakeview #54, Mammoth Lakes, CA 93546
MLS# NP26033902Listed by: COMPASS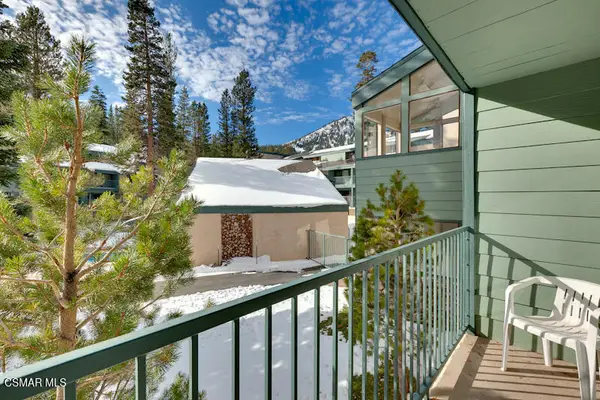 $549,000Active1 beds 1 baths689 sq. ft.
895 Canyon Boulevard #15, Mammoth Lakes, CA 93546
MLS# 226000625Listed by: COMPASS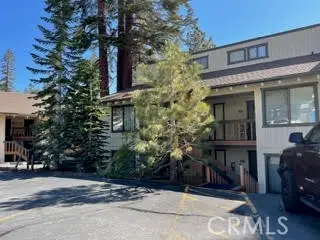 $499,000Active1 beds 1 baths736 sq. ft.
25 Lee #143, Mammoth Lakes, CA 93546
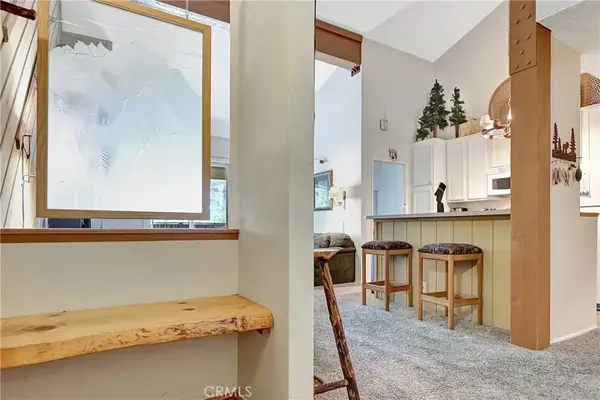
MLS# SW26004447Listed by: WAVES TO RIDGES REALTY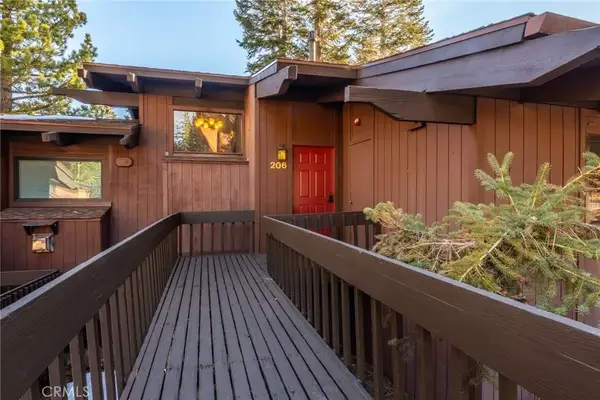 $1,150,000Active3 beds 3 baths1,493 sq. ft.
221 Canyon Blvd #206, Mammoth Lakes, CA 93546
MLS# PV25277557Listed by: ESTATE PROPERTIES $1,150,000Active3 beds 3 baths1,493 sq. ft.
221 Canyon Blvd #206, Mammoth Lakes, CA 93546
MLS# PV25277557Listed by: ESTATE PROPERTIES
Local realty services provided by:CENTURY 21 Affiliated, CENTURY 21 Coastal Properties
This information is deemed reliable but not guaranteed. You should rely on this information only to decide whether or not to further investigate a particular property. BEFORE MAKING ANY OTHER DECISION, YOU SHOULD PERSONALLY INVESTIGATE THE FACTS (e.g. square footage and lot size) with the assistance of an appropriate professional. You may use this information only to identify properties you may be interested in investigating further. All uses except for personal, non-commercial use in accordance with the foregoing purpose are prohibited. Redistribution or copying of this information, any photographs or video tours is strictly prohibited. This information is derived from the Internet Data Exchange (IDX) service provided by San Diego MLS®. Displayed property listings may be held by a brokerage firm other than the broker and/or agent responsible for this display. The information and any photographs and video tours and the compilation from which they are derived is protected by copyright. Compilation © 2020 San Diego MLS®, Inc.
The information being provided by California Regional MLS (Southern California) is for the consumer's personal, non-commercial use and may not be used for any purpose other than to identify prospective properties consumer may be interested in purchasing. Any information relating to real estate for sale referenced on this web site comes from the Internet Data Exchange (IDX) program of the California Regional MLS (Southern California). CENTURY 21 Coastal Properties is not a Multiple Listing Service (MLS), nor does it offer MLS access. This website is a service of CENTURY 21 Coastal Properties, a broker participant of California Regional MLS (Southern California). This web site may reference real estate listing(s) held by a brokerage firm other than the broker and/or agent who owns this web site.
The accuracy of all information, regardless of source, including but not limited to open house information, square footages and lot sizes, is deemed reliable but not guaranteed and should be personally verified through personal inspection by and/or with the appropriate professionals. The data contained herein is copyrighted by California Regional MLS (Southern California) and is protected by all applicable copyright laws. Any unauthorized dissemination of this information is in violation of copyright laws and is strictly prohibited.
Copyright 2021 California Regional MLS (Southern California). All rights reserved.
Popular neighborhoods near Mammoth Slopes, Mammoth Lakes, CA
Zip codes near Mammoth Slopes, Mammoth Lakes, CA
- 89010 homes for sale
- 93546 homes for sale
- 93601 homes for sale
- 93602 homes for sale
- 93604 homes for sale
- 93614 homes for sale
- 93623 homes for sale
- 93634 homes for sale
- 93642 homes for sale
- 93643 homes for sale
- 93644 homes for sale
- 93645 homes for sale
- 93651 homes for sale
- 93664 homes for sale
- 93667 homes for sale
- 93669 homes for sale
- 95321 homes for sale
- 95338 homes for sale
- 95345 homes for sale
- 95389 homes for sale
Counties near Mammoth Slopes, Mammoth Lakes, CA
- Alpine County homes for sale
- Calaveras County homes for sale
- Douglas County homes for sale
- Esmeralda County homes for sale
- Fresno County homes for sale
- Lyon County homes for sale
- Madera County homes for sale
- Mariposa County homes for sale
- Merced County homes for sale
- Mineral County homes for sale
- Mono County homes for sale
- Tulare County homes for sale
- Tuolumne County homes for sale
Protect your home and budget from life's surprises with an Assurant Home Warranty, backed by a partner that supports you through every step of homeownership. Explore Plans.
©2026 Century 21 Real Estate LLC. All rights reserved. CENTURY 21®, the CENTURY 21 Logo and C21® are service marks owned by Century 21 Real Estate LLC. Century 21 Real Estate LLC fully supports the principles of the Fair Housing Act and the Equal Opportunity Act. Each office is independently owned and operated. Listing information is deemed reliable but not guaranteed accurate.