- Douglas homes for sale
- Fort Berthold homes for sale
- Garrison homes for sale
- Mandan homes for sale
- Mandan City homes for sale
- North Central McLean homes for sale
- Sawyer Township homes for sale
- Sawyer homes for sale
- Snow homes for sale
- Spring Lake homes for sale
- Sundre homes for sale
- Velva homes for sale
- Velva Township homes for sale
- West McLean homes for sale
- White Shield homes for sale
58554, ND - homes for sale
11 of 11 results displayed
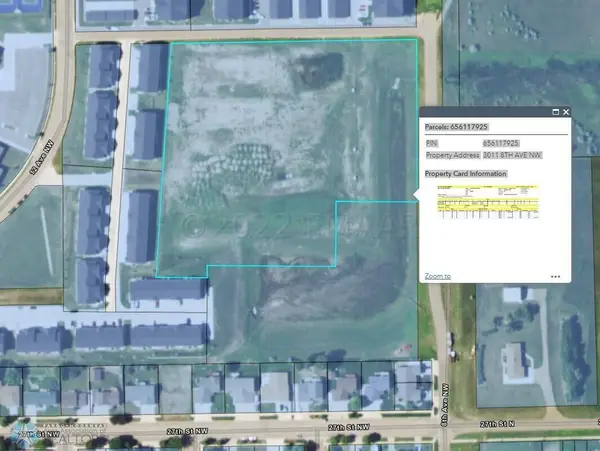 $1,523,704Active7.07 Acres
3011 8th Avenue Nw, Mandan, ND 58554
MLS# 7366944Listed by: BETTER HOMES AND GARDENS REAL ESTATE ADVANTAGE ONE $329,900Active2 beds 2 baths1,550 sq. ft.
1416 Prairie Lane, Wahpeton, ND 58075
MLS# 6687914Listed by: TRILOGY REAL ESTATE $329,900Active2 beds 2 baths1,550 sq. ft.
1412 Prairie Lane, Wahpeton, ND 58075
MLS# 6687856Listed by: TRILOGY REAL ESTATE $329,900Active2 beds 2 baths1,550 sq. ft.
1414 Prairie Lane, Wahpeton, ND 58075
MLS# 6687875Listed by: TRILOGY REAL ESTATE $329,900Active2 beds 2 baths1,550 sq. ft.
1408 Prairie Lane, Wahpeton, ND 58075
MLS# 6679798Listed by: TRILOGY REAL ESTATE $329,900Active2 beds 2 baths1,550 sq. ft.
1410 Prairie Lane, Wahpeton, ND 58075
MLS# 6679812Listed by: TRILOGY REAL ESTATE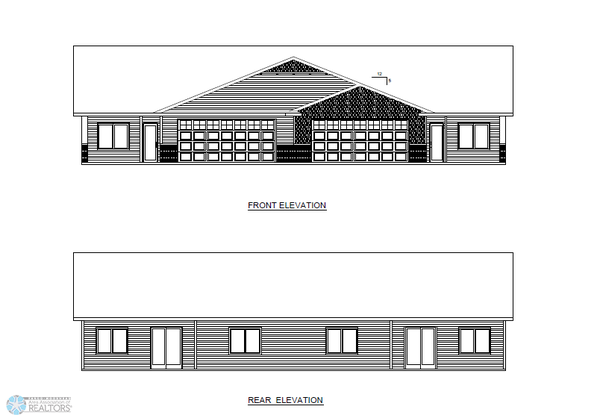 $329,900Active2 beds 2 baths1,550 sq. ft.
1400 Prairie Lane, Wahpeton, ND 58075
MLS# 6679752Listed by: TRILOGY REAL ESTATE $329,900Active2 beds 2 baths1,550 sq. ft.
1406 Prairie Lane, Wahpeton, ND 58075
MLS# 6679633Listed by: TRILOGY REAL ESTATE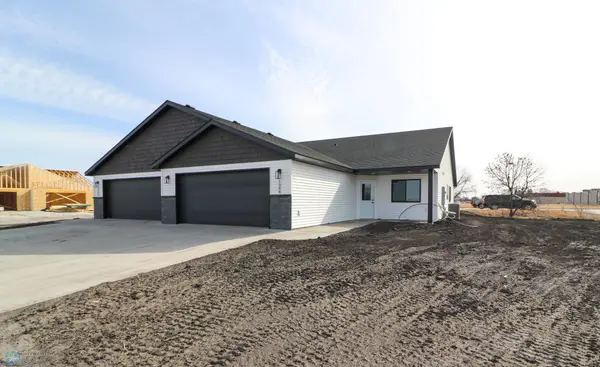 $329,900Active2 beds 2 baths1,550 sq. ft.
1404 Prairie Lane, Wahpeton, ND 58075
MLS# 6679524Listed by: TRILOGY REAL ESTATE $329,900Active2 beds 2 baths1,550 sq. ft.
1396 Prairie Lane, Wahpeton, ND 58075
MLS# 6659017Listed by: TRILOGY REAL ESTATE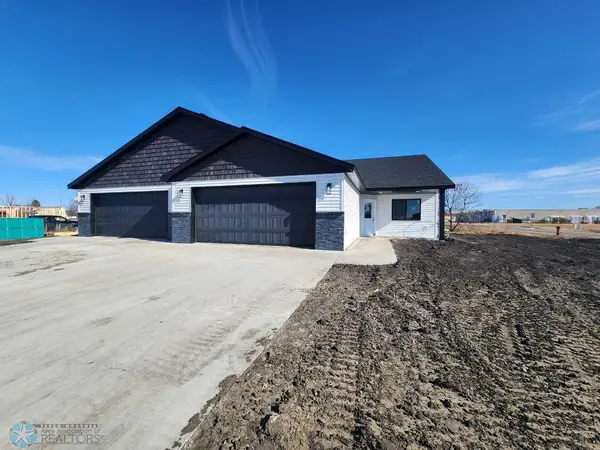 $329,900Active2 beds 2 baths1,550 sq. ft.
1398 Prairie Lane, Wahpeton, ND 58075
MLS# 6659026Listed by: TRILOGY REAL ESTATE
Local realty services provided by:CENTURY 21 Brainerd Realty, Inc.
Popular searches near 58554
Counties near Mandan, 58554
Protect your home and budget from life's surprises with an Assurant Home Warranty, backed by a partner that supports you through every step of homeownership. Explore Plans.
©2026 Century 21 Real Estate LLC. All rights reserved. CENTURY 21®, the CENTURY 21 Logo and C21® are service marks owned by Century 21 Real Estate LLC. Century 21 Real Estate LLC fully supports the principles of the Fair Housing Act and the Equal Opportunity Act. Each office is independently owned and operated. Listing information is deemed reliable but not guaranteed accurate.