- Blanco Gardens, San Marcos homes for sale
- Blanco River North, San Marcos homes for sale
- Cottonwood Creek, San Marcos homes for sale
- Downtown, San Marcos homes for sale
- Dunbar, San Marcos homes for sale
- East Guadalupe, San Marcos homes for sale
- Fairlawn, San Marcos homes for sale
- Forest Hills, San Marcos homes for sale
- Heritage, San Marcos homes for sale
- Holland Hills, San Marcos homes for sale
- Millview East, San Marcos homes for sale
- Millview West, San Marcos homes for sale
- Rio Vista, San Marcos homes for sale
- Sessom Creek, San Marcos homes for sale
- Sierra Circle, San Marcos homes for sale
- Southwest Hills, San Marcos homes for sale
- Sunset Acres, San Marcos homes for sale
- Tanglewood, San Marcos homes for sale
- Two Rivers East, San Marcos homes for sale
- Victory Gardens, San Marcos homes for sale
Martindale, TX - homes for sale
28 of 28 results displayed
- New
 $270,000Active2.69 Acres
Lot 5 FM 1979, Martindale, TX 78655
MLS# 26004152Listed by: PINNACLE REALTY ADVISORS - New
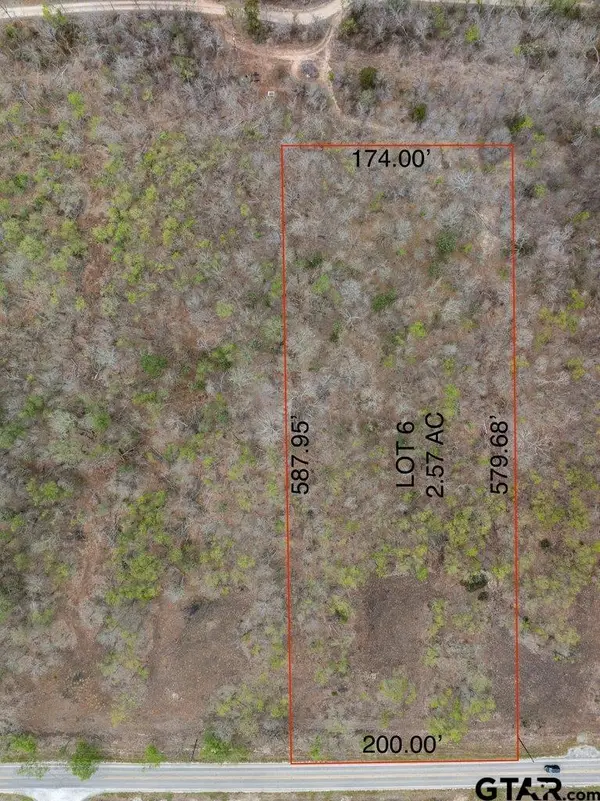 $270,000Active2.69 Acres
Lot 6 FM 1979, Martindale, TX 78655
MLS# 26004154Listed by: PINNACLE REALTY ADVISORS - New
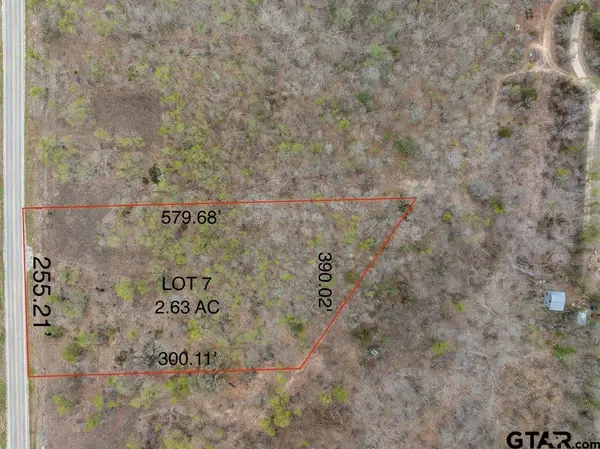 $285,000Active2.63 Acres
Lot 7 FM 1979, Martindale, TX 78655
MLS# 26004155Listed by: PINNACLE REALTY ADVISORS - New
 $399,000Active0 Acres
108 River Lakes Lane, Martindale, TX 78655
MLS# 3420375Listed by: KELLER WILLIAMS HERITAGE - New
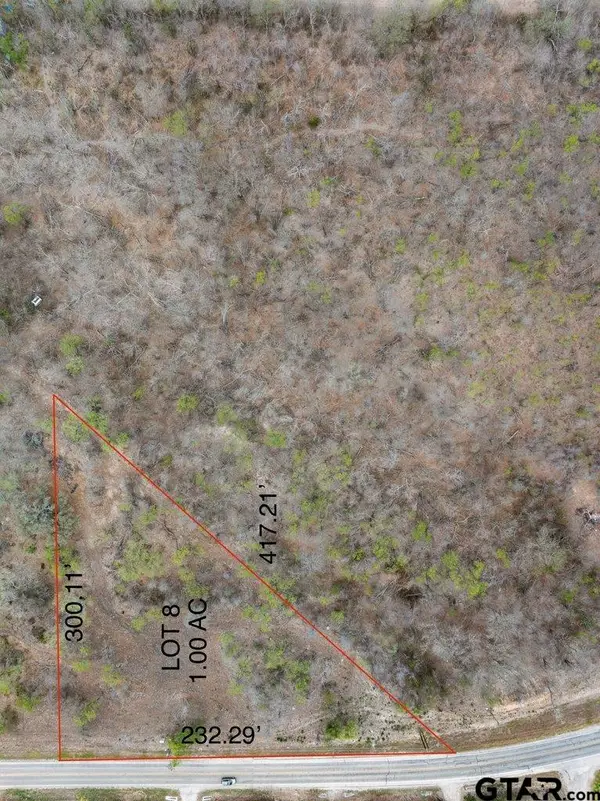 $160,000Active1 Acres
Lot 8 FM 1979, Martindale, TX 78655
MLS# 26004006Listed by: PINNACLE REALTY ADVISORS - New
 $410,000Active3 beds 2 baths1,641 sq. ft.
502 NW River Rd, Martindale, TX 78655
MLS# 6940515Listed by: ALL CITY REAL ESTATE LTD. CO  $949,000Active4 beds 5 baths3,246 sq. ft.
925 River Ranch Circle, Martindale, TX 78655
MLS# 607472Listed by: ANDERS PIERCE REALTY, LLC $465,000Active0 Acres
108 Lakeside Cv, Martindale, TX 78655
MLS# 4997584Listed by: CHRISTIE'S INT'L REAL ESTATE $319,900Active-- beds -- baths2,320 sq. ft.
208 NW River Rd, Martindale, TX 78655
MLS# 7672272Listed by: LAND UP REALTY & INVESTMENTS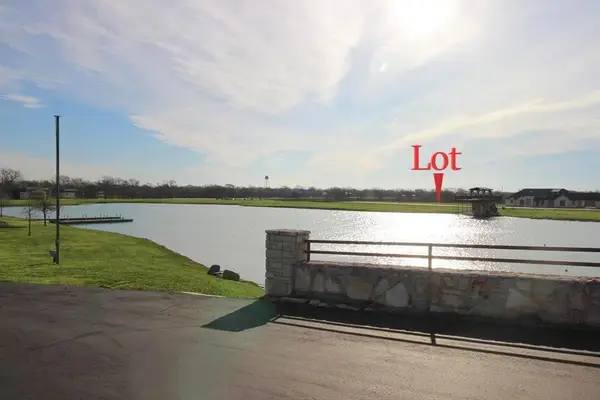 $128,900Active1 Acres
510 River Ranch Circle, Martindale, TX 78655
MLS# 38481840Listed by: REALM REAL ESTATE PROFESSIONALS - KATY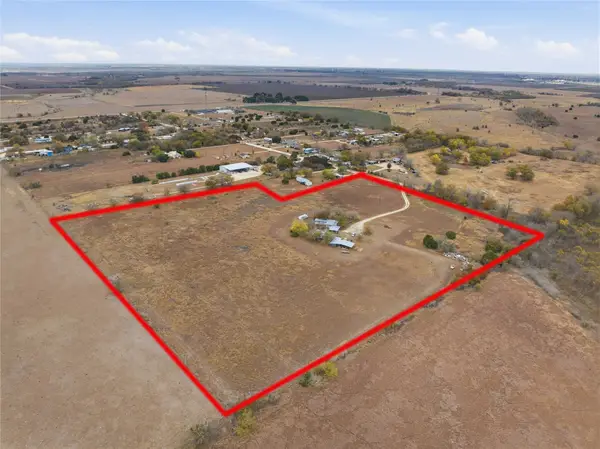 $389,999Pending17.34 Acres
498 Greenhouse Road, Martindale, TX 78655
MLS# 57407198Listed by: LOGOS INVESTMENT PROPERTIES & REAL ESTATE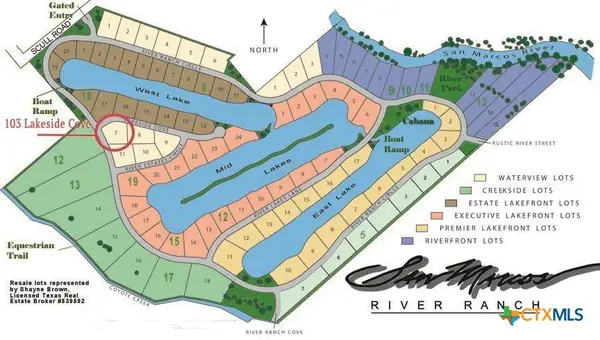 $399,000Active1.42 Acres
108 River Lakes Lane, Martindale, TX 78655
MLS# 603977Listed by: KELLER WILLIAMS HERITAGE $141,900Active0.5 Acres
620 NW River Road, Martindale, TX 78655
MLS# 603828Listed by: LAND UNLIMITED $106,900Active0.5 Acres
536 NW River Road, Martindale, TX 78655
MLS# 603830Listed by: LAND UNLIMITED $138,900Active0.79 Acres
528 NW River Road, Martindale, TX 78655
MLS# 603831Listed by: LAND UNLIMITED $112,900Active0 Acres
333 Quail Run Rd, Martindale, TX 78655
MLS# 7868960Listed by: LAND UNLIMITED $129,900Active0 Acres
598 Nw River Rd, Martindale, TX 78655
MLS# 2151080Listed by: LAND UNLIMITED $580,000Active7.56 Acres
185 Westglen, Martindale, TX 78655
MLS# 1937938Listed by: VIP REALTY $165,000Active0 Acres
103 Lakeside Cv, Martindale, TX 78655
MLS# 4378998Listed by: JPAR AUSTIN $599,000Active3 beds 2 baths1,875 sq. ft.
608 Nw River Road Rd, Martindale, TX 78655
MLS# 6118305Listed by: KELLER WILLIAMS HERITAGE $599,999Active3 beds 2 baths1,875 sq. ft.
608 River Road, Martindale, TX 78655
MLS# 595450Listed by: KELLER WILLIAMS HERITAGE $1,500,000Active0 Acres
15350 San Marcos Highway, Martindale, TX 78655
MLS# 7374700Listed by: LAND UNLIMITED $365,000Active3 beds 2 baths1,638 sq. ft.
184 Meadow Ln, Martindale, TX 78655
MLS# 1894921Listed by: LEVI RODGERS REAL ESTATE GROUP $160,000Active0 Acres
602 NW River Road, Martindale, TX 78655
MLS# 7833648Listed by: KELLER WILLIAMS HERITAGE $650,000Active4 beds 3 baths2,526 sq. ft.
81 Butler Lane, Martindale, TX 78655
MLS# 1878279Listed by: LEGENDARY REALTY $299,000Active0 Acres
100 Arlene Ln, Martindale, TX 78655
MLS# 9022187Listed by: TS REALTY $295,000Active0 Acres
Lots 1 & 2 NW River Rd, Martindale, TX 78655
MLS# 6034707Listed by: EXP REALTY, LLC $20,000Pending0.03 Acres
403 Fm 1979, Martindale, TX 78655
MLS# 1676725Listed by: COLDWELL BANKER REALTY
Local realty services provided by:CENTURY 21 Judge Fite Company, CENTURY 21 North East, CENTURY 21 Premier Realtors, CENTURY 21 Scott Myers Realtors
Some properties that appear for sale on this web site may subsequently have been sold and may no longer be available. The data relating to real estate for sale on this web site comes in part from the FHAAR IDX INFO SHARE PROGRAM. Real estate listings held by brokerage firms other than CENTURY 21 Premier Realtors include the name of the listing agent. Copyright 2026 FHAAR IDX INFO SHARE PROGRAM. Last Updated March 25, 2026
Copyright 2026, Houston Realtors Information Service, Inc. All information provided is deemed reliable but is not guaranteed and should be independently verified. IDX information is provided exclusively for consumers' personal, non-commercial use, it may not be used for any purpose other than to identify prospective properties consumers may be interested in purchasing, and the data is deemed reliable but is not guaranteed accurate by the MLS.
Neighborhoods near Martindale, TX
Zip codes near Martindale, TX
- 78123 homes for sale
- 78130 homes for sale
- 78132 homes for sale
- 78133 homes for sale
- 78155 homes for sale
- 78610 homes for sale
- 78616 homes for sale
- 78619 homes for sale
- 78638 homes for sale
- 78640 homes for sale
- 78644 homes for sale
- 78648 homes for sale
- 78652 homes for sale
- 78655 homes for sale
- 78656 homes for sale
- 78666 homes for sale
- 78676 homes for sale
- 78739 homes for sale
- 78747 homes for sale
- 78748 homes for sale
Popular searches near Martindale, TX
- Buda homes for sale
- Creedmoor homes for sale
- Dale homes for sale
- Geronimo homes for sale
- Kingsbury homes for sale
- Kyle homes for sale
- Kyle-Buda homes for sale
- Lake Dunlap homes for sale
- Lockhart homes for sale
- Luling homes for sale
- Maxwell homes for sale
- Mustang Ridge homes for sale
- New Braunfels homes for sale
- Niederwald homes for sale
- Northeast Guadalupe homes for sale
- Redwood homes for sale
- San Marcos homes for sale
- Seguin homes for sale
- Uhland homes for sale
- Wimberley homes for sale
Protect your home and budget from life's surprises with an Assurant Home Warranty, backed by a partner that supports you through every step of homeownership. Explore Plans.
©2026 Century 21 Real Estate LLC. All rights reserved. CENTURY 21®, the CENTURY 21 Logo and C21® are service marks owned by Century 21 Real Estate LLC. Century 21 Real Estate LLC fully supports the principles of the Fair Housing Act and the Equal Opportunity Act. Each office is independently owned and operated. Listing information is deemed reliable but not guaranteed accurate.