- Briarwood, Little Rock homes for sale
- Chenal Valley, Little Rock homes for sale
- Evergreen, Little Rock homes for sale
- Hall High, Little Rock homes for sale
- Heights, Little Rock homes for sale
- Hillcrest, Little Rock homes for sale
- Kingwood, Little Rock homes for sale
- Leawood, Little Rock homes for sale
- Meriwether, Little Rock homes for sale
- Parkway Place, Little Rock homes for sale
- Pinnacle Valley, Little Rock homes for sale
- Pleasant Valley, Little Rock homes for sale
- Pulaski Heights, Little Rock homes for sale
- River Ridge, Little Rock homes for sale
- Secluded Hills, Little Rock homes for sale
- Sturbridge, Little Rock homes for sale
- The Country Club of Arkansas, Maumelle homes for sale
- The Villages of Wellington, Little Rock homes for sale
- Walnut Valley, Little Rock homes for sale
- West Village, Little Rock homes for sale
Maumelle, AR - homes for sale
5 of 5 results displayed
- New
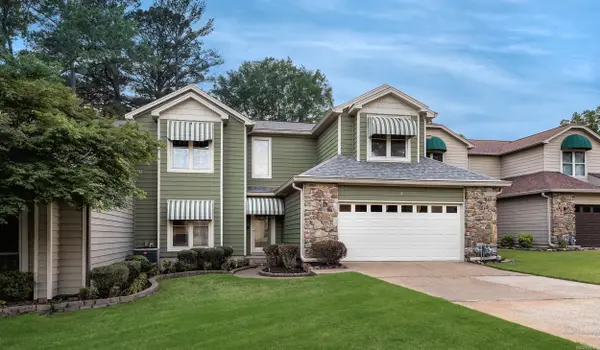 $330,000Active3 beds 3 baths2,896 sq. ft.
5 Caddy Cove, Maumelle, AR 72113
MLS# 26018010Listed by: GLORIA RAND REALTY, INC. 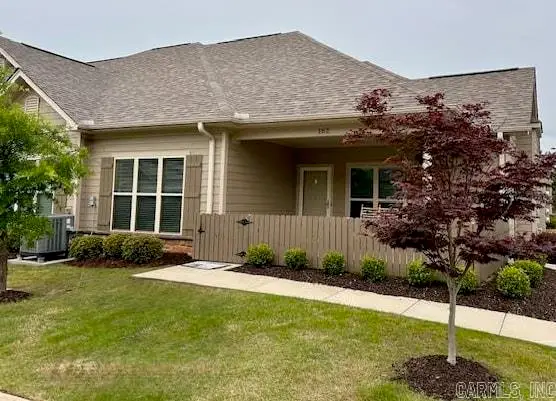 $319,900Active2 beds 2 baths1,800 sq. ft.
162 Mountain Terrace Circle, Maumelle, AR 72113
MLS# 26017746Listed by: CRYE-LEIKE REALTORS KANIS BRANCH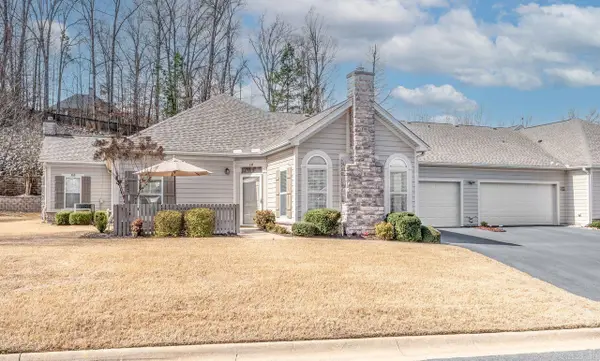 $249,900Active2 beds 2 baths1,320 sq. ft.
111 Mountain Terrace Circle, Maumelle, AR 72113
MLS# 26011175Listed by: CRYE-LEIKE REALTORS MAUMELLE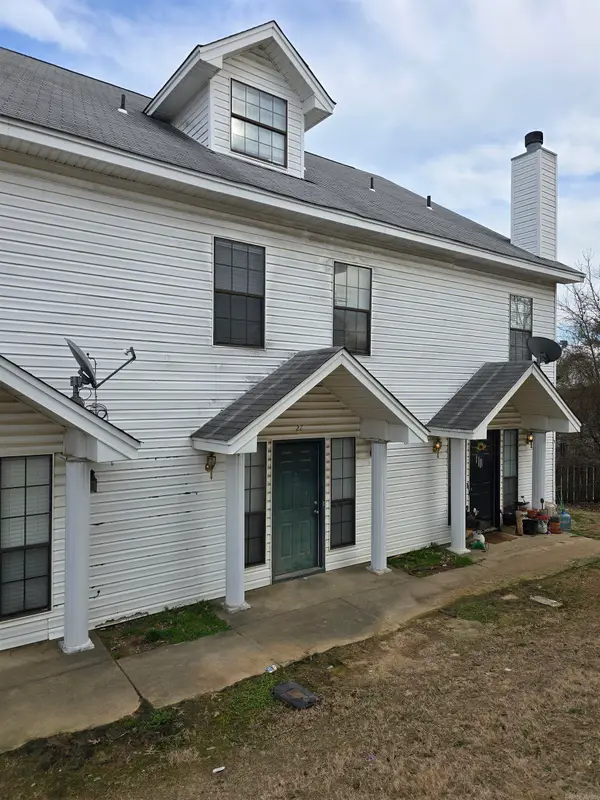 $149,000Active3 beds 2 baths1,544 sq. ft.
27 Edgehill Cove, Maumelle, AR 72113
MLS# 26009418Listed by: EXP REALTY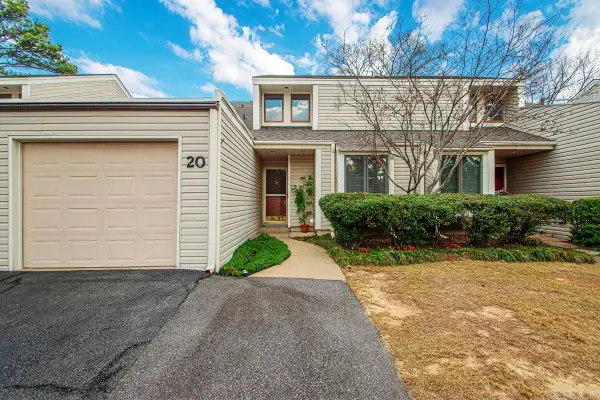 $228,000Active3 beds 2 baths1,883 sq. ft.
20 Fairway Woods Cir, Maumelle, AR 72113
MLS# 26008139Listed by: EPIC REAL ESTATE
Local realty services provided by:CENTURY 21 PORTFOLIO
Neighborhoods near Maumelle, AR
Zip codes near Maumelle, AR
- 72106 homes for sale
- 72113 homes for sale
- 72114 homes for sale
- 72116 homes for sale
- 72118 homes for sale
- 72120 homes for sale
- 72135 homes for sale
- 72199 homes for sale
- 72201 homes for sale
- 72202 homes for sale
- 72204 homes for sale
- 72205 homes for sale
- 72207 homes for sale
- 72209 homes for sale
- 72210 homes for sale
- 72211 homes for sale
- 72212 homes for sale
- 72217 homes for sale
- 72223 homes for sale
- 72227 homes for sale
Popular searches near Maumelle, AR
- Avilla homes for sale
- Beaver homes for sale
- Benedict homes for sale
- Big Rock homes for sale
- Cammack Village homes for sale
- Danley homes for sale
- Gibson homes for sale
- Hill homes for sale
- Little Rock homes for sale
- Mayflower homes for sale
- McAlmont homes for sale
- Natural Steps homes for sale
- North Little Rock homes for sale
- Owen homes for sale
- Palarm homes for sale
- Pine Mountain homes for sale
- Roland homes for sale
- Sherwood homes for sale
- Wilson homes for sale
- Wye homes for sale
Protect your home and budget from life's surprises with an Assurant Home Warranty, backed by a partner that supports you through every step of homeownership. Explore Plans.
©2026 Century 21 Real Estate LLC. All rights reserved. CENTURY 21®, the CENTURY 21 Logo and C21® are service marks owned by Century 21 Real Estate LLC. Century 21 Real Estate LLC fully supports the principles of the Fair Housing Act and the Equal Opportunity Act. Each office is independently owned and operated. Listing information is deemed reliable but not guaranteed accurate.