- Ball Bluff properties for sale
- Buhl properties for sale
- Chisholm properties for sale
- Cloquet properties for sale
- Colvin Township properties for sale
- Cotton properties for sale
- Cotton Township properties for sale
- Eveleth properties for sale
- Floodwood properties for sale
- Forbes properties for sale
- Goodland Township properties for sale
- Grand Lake properties for sale
- Greenway properties for sale
- Hibbing properties for sale
- Jacobson properties for sale
- Makinen properties for sale
- Nashwauk properties for sale
- Pengilly properties for sale
- Saginaw properties for sale
- Solway Township properties for sale
55765, MN - homes for sale
5 of 5 results displayed
 $80,000Active36.15 Acres
10650 W Toivola Rd, Toivola, MN 55765
MLS# 6122672Listed by: NORTHBOUND REALTY LLC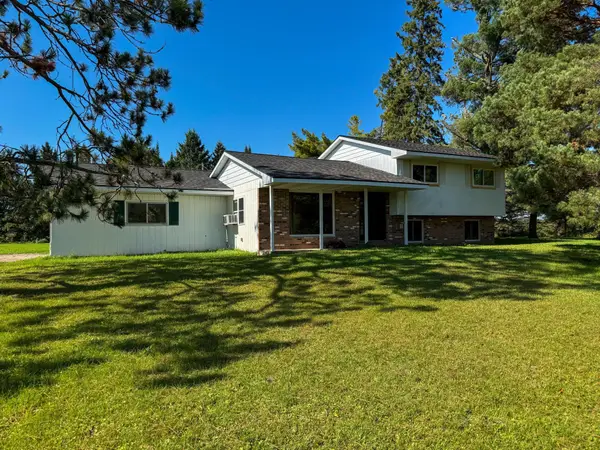 $374,900Active4 beds 2 baths1,600 sq. ft.
7663 Highway 29, Meadowlands Twp, MN 55765
MLS# 6794579Listed by: 218 REAL ESTATE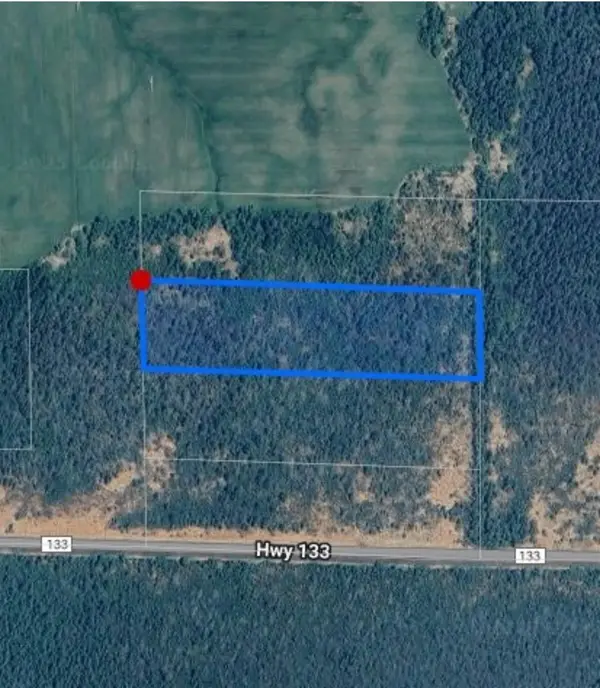 $30,000Active10 Acres
XXX Hwy 133, Meadowlands, MN 55765
MLS# 6122121Listed by: RE/MAX CLOQUET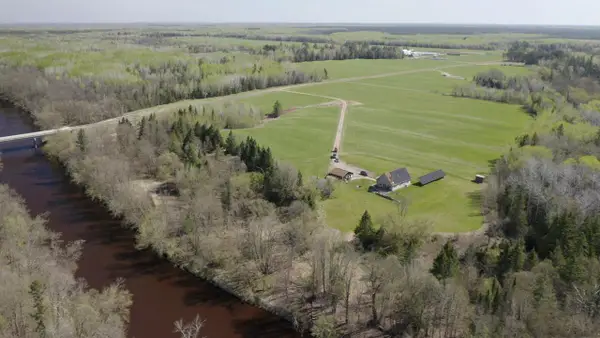 $474,000Pending3 beds 2 baths1,826 sq. ft.
10362 Arkola Road, Toivola Twp, MN 55765
MLS# 6722333Listed by: JANISCH REALTY, INC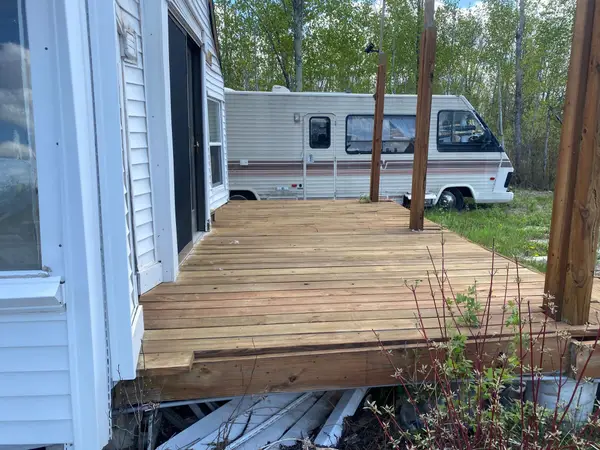 $85,000Active40 Acres
7773 Condor Road, Meadowlands, MN 55765
MLS# 6652540Listed by: MCGREGOR REALTY & PROPERTY
Local realty services provided by:CENTURY 21 Atwood, CENTURY 21 FM Realty
2025, Lake Superior Area REALTORS, Inc.
Popular searches near 55765
Popular neighborhoods near 55765
- Arnold, Duluth properties for sale
- Bayview Heights, Duluth properties for sale
- Central Hillside, Duluth properties for sale
- Cody, Duluth properties for sale
- Congdon Park, Duluth properties for sale
- Denfeld, Duluth properties for sale
- Downtown, Duluth properties for sale
- Duluth Heights, Duluth properties for sale
- East Hillside, Duluth properties for sale
- Endion, Duluth properties for sale
- Hermantown, Duluth properties for sale
- Hunters Park, Duluth properties for sale
- Irving, Duluth properties for sale
- Kenwood, Duluth properties for sale
- Lakeside/Lester Park, Duluth properties for sale
- Lincoln Park, Duluth properties for sale
- Morley Heights, Duluth properties for sale
- Piedmont Heights, Duluth properties for sale
- Proctor, Duluth properties for sale
- Woodland, Duluth properties for sale
Counties near Meadowlands, 55765
- Aitkin County properties for sale
- Bayfield County properties for sale
- Burnett County properties for sale
- Carlton County properties for sale
- Cass County properties for sale
- Crow Wing County properties for sale
- Douglas County properties for sale
- Itasca County properties for sale
- Kanabec County properties for sale
- Koochiching County properties for sale
- Lake County properties for sale
- Mille Lacs County properties for sale
- Pine County properties for sale
- St. Louis County properties for sale
- Washburn County properties for sale
©2025 Century 21 Real Estate LLC. All rights reserved. CENTURY 21®, the CENTURY 21 Logo and C21® are service marks owned by Century 21 Real Estate LLC. Century 21 Real Estate LLC fully supports the principles of the Fair Housing Act and the Equal Opportunity Act. Each office is independently owned and operated. Listing information is deemed reliable but not guaranteed accurate.
©2025 Century 21 Real Estate LLC. All rights reserved. CENTURY 21®, the CENTURY 21 Logo and C21® are service marks owned by Century 21 Real Estate LLC. Century 21 Real Estate LLC fully supports the principles of the Fair Housing Act and the Equal Opportunity Act. Each office is independently owned and operated. Listing information is deemed reliable but not guaranteed accurate.