- Bay Point, Miami homes for sale
- Bayshore, Miami Beach homes for sale
- Belle Isle, Miami Beach homes for sale
- City Center, Miami Beach homes for sale
- Di Lido Island, Miami Beach homes for sale
- Flamingo / Lummus, Miami Beach homes for sale
- Flamingo Terrace, Miami Beach homes for sale
- Hibiscus Island, Miami Beach homes for sale
- La Gorce, Miami Beach homes for sale
- Miami Beach, Miami Beach homes for sale
- Nautilus, Miami Beach homes for sale
- Normandy Isle, Miami Beach homes for sale
- North Bay Village, Miami Beach homes for sale
- Ocean Front, Miami Beach homes for sale
- Orchard, Miami Beach homes for sale
- Rivo Alto Island, Miami Beach homes for sale
- San Marco Island, Miami Beach homes for sale
- San Marino Island, Miami Beach homes for sale
- South Beach, Miami Beach homes for sale
- West Avenue, Miami Beach homes for sale
Miami Beach, FL - homes for sale
45 of 45 results displayed
 $949,500Active2 beds 3 baths
619 Meridian Ave #4, Miami Beach, FL 33139
MLS# A11979070Listed by: ANCONA REAL ESTATE INC $759,000Active2 beds 2 baths1,700 sq. ft.
6000 Collins Ave #313, Miami Beach, FL 33140
MLS# A11974257Listed by: CANVAS REAL ESTATE $990,000Active2 beds 3 baths1,278 sq. ft.
1061 Michigan Ave #4, Miami Beach, FL 33139
MLS# A11970961Listed by: BEACHFRONT REALTY INC $2,150,000Active4 beds 5 baths2,504 sq. ft.
95 N Shore Dr, Miami Beach, FL 33141
MLS# A11962986Listed by: DOUGLAS ELLIMAN $1,485,000Active3 beds 2 baths1,300 sq. ft.
325 Meridian Ave #12, Miami Beach, FL 33139
MLS# A11962649Listed by: VENDOME PROPERTY MANAGEMENT $1,595,000Pending3 beds 3 baths1,632 sq. ft.
7286 Gary Ave, Miami Beach, FL 33141
MLS# A11944599Listed by: REJOICE REALTY GROUP, INC.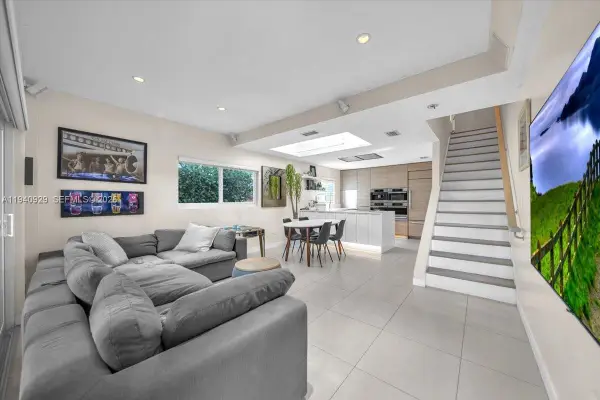 $2,099,000Active3 beds 3 baths1,270 sq. ft.
208 Jefferson Ave #113, Miami Beach, FL 33139
MLS# A11940929Listed by: SOUTH POINTE DRIVE REALTY INC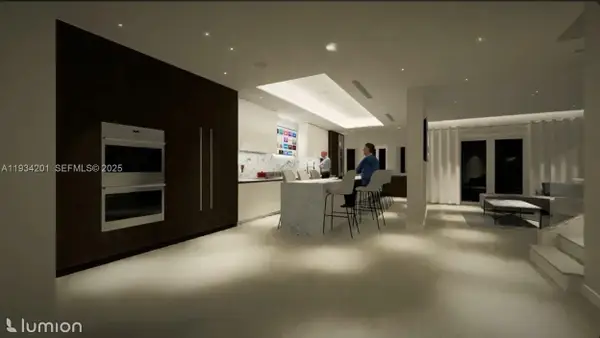 $3,900,000Active3 beds 3 baths2,420 sq. ft.
1413 Sunset Harbour Dr #120, Miami Beach, FL 33139
MLS# A11934201Listed by: STERLING EQUITY REALTY LLC $615,000Active3 beds 2 baths1,632 sq. ft.
7270 Gary Ave, Miami Beach, FL 33141
MLS# A11931122Listed by: FORTUNE CHRISTIE'S INTERNATIONAL REAL ESTATE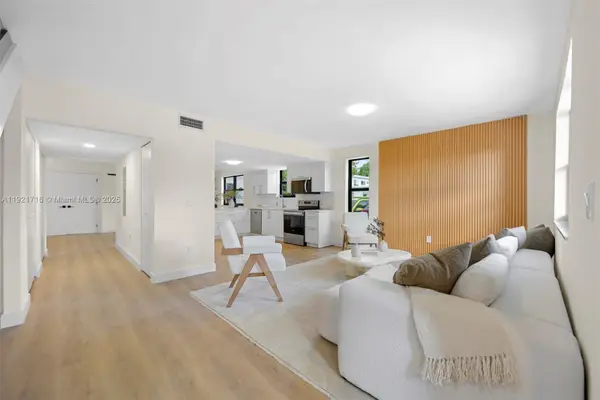 $1,050,000Active4 beds 3 baths1,820 sq. ft.
7994 Crespi Blvd, Miami Beach, FL 33141
MLS# A11921716Listed by: LIV REAL ESTATE GROUP $1,150,000Active5 beds 3 baths1,891 sq. ft.
7996 Crespi Blvd #4, Miami Beach, FL 33141
MLS# A11919306Listed by: CHARLES RUTENBERG REALTY FTL $2,295,000Active3 beds 3 baths2,640 sq. ft.
1413 Sunset Harbour Dr #208, Miami Beach, FL 33139
MLS# A11915503Listed by: COLDWELL BANKER REALTY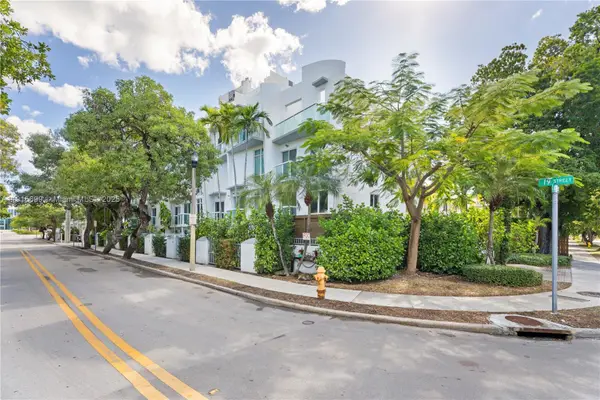 $1,175,000Active3 beds 4 baths1,430 sq. ft.
1853 Jefferson Ave #6, Miami Beach, FL 33139
MLS# A11915699Listed by: DOUGLAS ELLIMAN $549,888Pending2 beds 3 baths1,068 sq. ft.
8041 Harding Ave #105, Miami Beach, FL 33141
MLS# A11914749Listed by: COLDWELL BANKER REALTY $446,725Active1 beds 1 baths302 sq. ft.
1619 Jefferson Ave #101, Miami Beach, FL 33139
MLS# 2025019965Listed by: GOLDPEN REALTY GROUP $419,170Active1 beds 1 baths502 sq. ft.
1619 Jefferson Ave #302, Miami Beach, FL 33139
MLS# 2025019977Listed by: GOLDPEN REALTY GROUP $419,170Active1 beds 1 baths462 sq. ft.
1619 Jefferson Ave #308, Miami Beach, FL 33139
MLS# 2025019998Listed by: GOLDPEN REALTY GROUP $385,770Active1 beds 1 baths462 sq. ft.
1619 Jefferson Ave #208, Miami Beach, FL 33139
MLS# 2025020013Listed by: GOLDPEN REALTY GROUP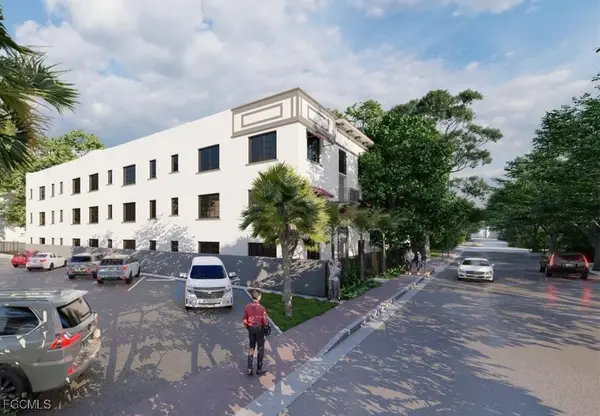 $385,770Active1 beds 1 baths462 sq. ft.
1619 Jefferson Ave #108, Miami Beach, FL 33139
MLS# 2025020020Listed by: GOLDPEN REALTY GROUP $384,100Active1 beds 1 baths460 sq. ft.
1619 Jefferson Ave #309, Miami Beach, FL 33139
MLS# 2025020045Listed by: GOLDPEN REALTY GROUP $384,100Active1 beds 1 baths460 sq. ft.
1619 Jefferson Ave #300, Miami Beach, FL 33139
MLS# 2025020056Listed by: GOLDPEN REALTY GROUP $384,100Active1 beds 1 baths460 sq. ft.
1619 Jefferson Ave #107, Miami Beach, FL 33139
MLS# 2025020069Listed by: GOLDPEN REALTY GROUP $9,750,000Active4 beds 5 baths4,054 sq. ft.
1445 Bay Rd, Miami Beach, FL 33139
MLS# A11911861Listed by: COMPASS FLORIDA, LLC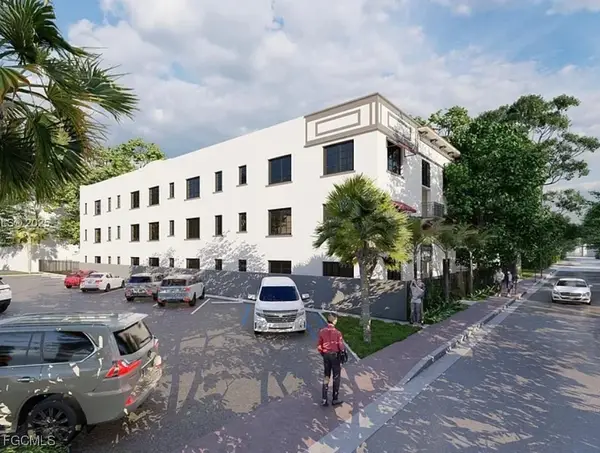 $500,165Active1 beds 1 baths599 sq. ft.
1619 Jefferson Ave #103, Miami Beach, FL 33139
MLS# 2025019647Listed by: GOLDPEN REALTY GROUP $446,725Active1 beds 1 baths535 sq. ft.
1619 Jefferson Ave #201, Miami Beach, FL 33139
MLS# 2025019666Listed by: GOLDPEN REALTY GROUP $500,165Active1 beds 1 baths599 sq. ft.
1619 Jefferson Ave #303, Miami Beach, FL 33139
MLS# 2025019607Listed by: GOLDPEN REALTY GROUP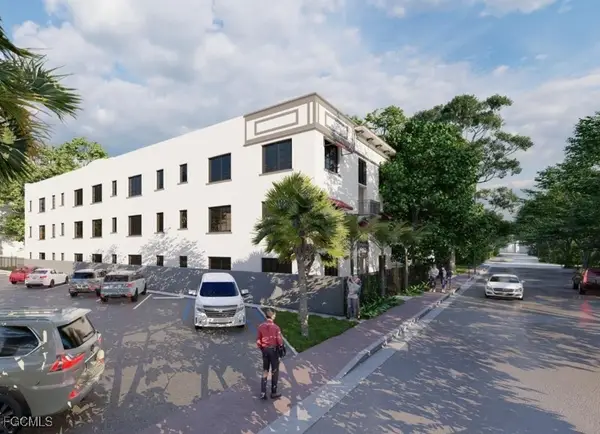 $500,165Active1 beds 1 baths599 sq. ft.
1619 Jefferson Ave #203, Miami Beach, FL 33139
MLS# 2025019632Listed by: GOLDPEN REALTY GROUP $1,975,000Pending4 beds 5 baths2,482 sq. ft.
33 N Shore Dr #33, Miami Beach, FL 33141
MLS# A11894407Listed by: DOUGLAS ELLIMAN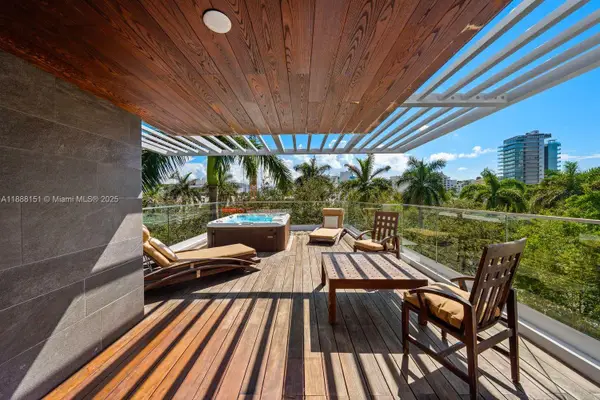 $3,599,000Active3 beds 3 baths2,463 sq. ft.
234 Washington Ave #A, Miami Beach, FL 33139
MLS# A11888151Listed by: COMPASS FLORIDA, LLC $1,874,900Pending3 beds 4 baths2,508 sq. ft.
65 N Shore Dr #31C, Miami Beach, FL 33141
MLS# A11883784Listed by: THE PROPERTY GALLERY $1,475,000Pending3 beds 4 baths2,504 sq. ft.
89 N Shore Dr, Miami Beach, FL 33141
MLS# A11962258Listed by: STUDER REALTY LLC $6,000,000Active5 beds 6 baths5,349 sq. ft.
6001 Laguna Path, Miami Beach, FL 33141
MLS# F10499919Listed by: GRAND REAL ESTATE COMPANY $1,390,000Active4 beds 3 baths26,336 sq. ft.
1975 Calais Dr #1, Miami Beach, FL 33141
MLS# A11844134Listed by: MIAMI BEACH REAL ESTATE GROUP $3,150,000Active4 beds 5 baths2,770 sq. ft.
1709 Jefferson Ave #TH-03, Miami Beach, FL 33139
MLS# A11839806Listed by: ONE SOTHEBY'S INTERNATIONAL REALTY $3,599,000Active4 beds 9 baths3,391 sq. ft.
1709 Jefferson Ave #TH-08, Miami Beach, FL 33139
MLS# A11839903Listed by: ONE SOTHEBY'S INTERNATIONAL REALTY $2,550,000Active3 beds 4 baths
1425 Bay Rd, Miami Beach, FL 33139
MLS# A11789038Listed by: MIAMI BEACH REAL ESTATE GROUP $1,187,000Active2 beds 3 baths1,410 sq. ft.
90 Alton Rd #TH-1, Miami Beach, FL 33139
MLS# A11951184Listed by: BHHS EWM REALTY $2,500,000Active1 beds 2 baths730 sq. ft.
Address Withheld By Seller, Miami Beach, FL 33140
MLS# A11541395Listed by: PRIME BEACH REALTY INC. $1,500,000Active3 beds 4 baths2,265 sq. ft.
1985 Calais #3, Miami Beach, FL 33141
MLS# A11744569Listed by: MIAMI BEACH REAL ESTATE GROUP $2,950,000Active4 beds 4 baths2,604 sq. ft.
2005 Calais Dr #7, Miami Beach, FL 33141
MLS# A11710949Listed by: MIAMI BEACH REAL ESTATE GROUP $1,550,000Active3 beds 3 baths1,775 sq. ft.
2005 Calais Dr #1, Miami Beach, FL 33141
MLS# A11710982Listed by: MIAMI BEACH REAL ESTATE GROUP $2,300,000Active3 beds 3 baths2,640 sq. ft.
1415 Sunset Harbour Dr #202, Miami Beach, FL 33139
MLS# A11978320Listed by: COLDWELL BANKER REALTY $1,200,000Active2 beds 2 baths1,128 sq. ft.
1600 Michigan Ave #7, Miami Beach, FL 33139
MLS# A11907495Listed by: COLDWELL BANKER REALTY $2,686,000Active5 beds 6 baths3,741 sq. ft.
230 Water Way, Miami Beach, FL 33141
MLS# A11908210Listed by: COMPASS FLORIDA, LLC $2,500,000Active4 beds 3 baths2,770 sq. ft.
7300 Trouville Esplanade #3, Miami Beach, FL 33141
MLS# A11378478Listed by: MIAMI BEACH REAL ESTATE GROUP
Local realty services provided by:CENTURY 21 World Connection, CENTURY 21 Results, CENTURY 21 Move With Us
Information deemed reliable but not guaranteed. Information is provided, in part, by Greater Miami MLS. This information being provided is for consumer's personal, non-commercial use and may not be used for any other purpose other than to identify prospective properties consumers may be interested in purchasing.
Neighborhoods near Miami Beach, FL
Zip codes near Miami Beach, FL
- 33109 homes for sale
- 33125 homes for sale
- 33127 homes for sale
- 33128 homes for sale
- 33129 homes for sale
- 33130 homes for sale
- 33131 homes for sale
- 33132 homes for sale
- 33136 homes for sale
- 33137 homes for sale
- 33138 homes for sale
- 33139 homes for sale
- 33140 homes for sale
- 33141 homes for sale
- 33142 homes for sale
- 33147 homes for sale
- 33150 homes for sale
- 33154 homes for sale
- 33161 homes for sale
- 33181 homes for sale
Popular searches near Miami Beach, FL
- Bal Harbour homes for sale
- Bay Harbor Islands homes for sale
- Biscayne Gardens homes for sale
- Biscayne Park homes for sale
- Brownsville homes for sale
- Coconut Grove homes for sale
- El Portal homes for sale
- Fisher Island homes for sale
- Gladeview homes for sale
- Golden Glades homes for sale
- Miami homes for sale
- Miami Shores homes for sale
- North Bay Village homes for sale
- North Miami homes for sale
- North Miami Beach homes for sale
- Pinewood homes for sale
- Sunny Isles Beach homes for sale
- Surfside homes for sale
- West Little River homes for sale
- Westview homes for sale
Protect your home and budget from life's surprises with an Assurant Home Warranty, backed by a partner that supports you through every step of homeownership. Explore Plans.
©2026 Century 21 Real Estate LLC. All rights reserved. CENTURY 21®, the CENTURY 21 Logo and C21® are service marks owned by Century 21 Real Estate LLC. Century 21 Real Estate LLC fully supports the principles of the Fair Housing Act and the Equal Opportunity Act. Each office is independently owned and operated. Listing information is deemed reliable but not guaranteed accurate.