- Blue Hills, Kansas City homes for sale
- Broadway Gillham, Kansas City homes for sale
- Country Club District, Kansas City homes for sale
- Countryside, Kansas City homes for sale
- Hanover Place, Kansas City homes for sale
- Hyde Park, Kansas City homes for sale
- Ivanhoe Southeast, Kansas City homes for sale
- Ivanhoe Southwest, Kansas City homes for sale
- Manheim Park, Kansas City homes for sale
- Old Westport, Kansas City homes for sale
- Plaza Westport, Kansas City homes for sale
- Roanoke, Kansas City homes for sale
- South Plaza, Kansas City homes for sale
- Southmoreland, Kansas City homes for sale
- Squier Park, Kansas City homes for sale
- Sunset Hill, Kansas City homes for sale
- Valentine, Kansas City homes for sale
- Volker, Kansas City homes for sale
- West Plaza, Kansas City homes for sale
- Wornall Homestead, Kansas City homes for sale
Midtown, Kansas City, MO - homes for sale
29 of 29 results displayed
- New
 $590,000Active-- beds -- baths
4515 Virginia Avenue, Kansas City, MO 64110
MLS# 2608554Listed by: REALTY EXECUTIVES - New
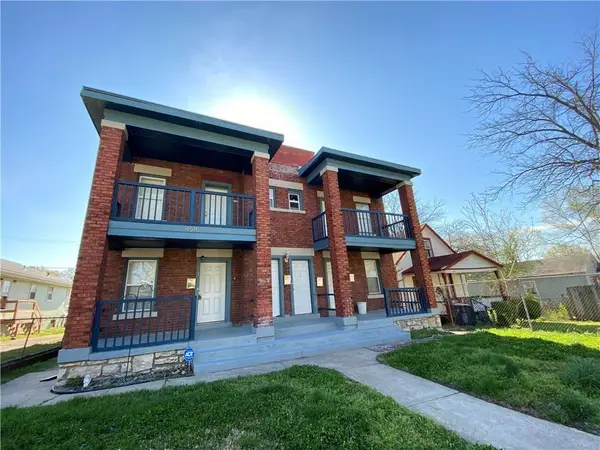
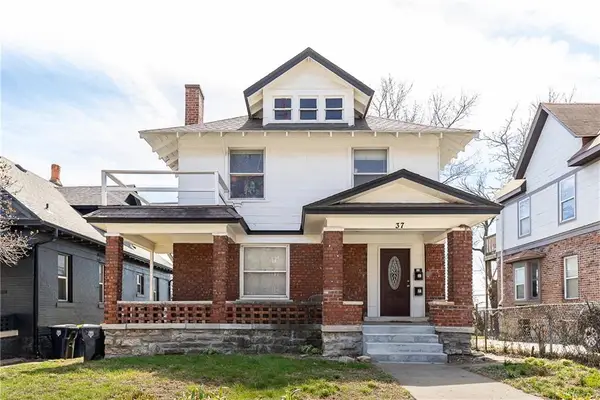 $395,000Active-- beds -- baths
37 E 32nd Street, Kansas City, MO 64111
MLS# 2608692Listed by: REECENICHOLS - LEAWOOD - New
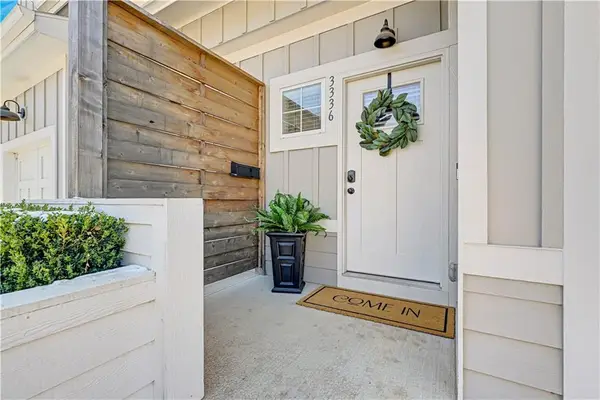 $340,000Active3 beds 3 baths1,502 sq. ft.
3336 Tracy Avenue, Kansas City, MO 64109
MLS# 2607319Listed by: REECENICHOLS - LEAWOOD  $850,000Active-- beds -- baths
3412 Charlotte Street, Kansas City, MO 64109
MLS# 2607696Listed by: KELLER WILLIAMS KC NORTH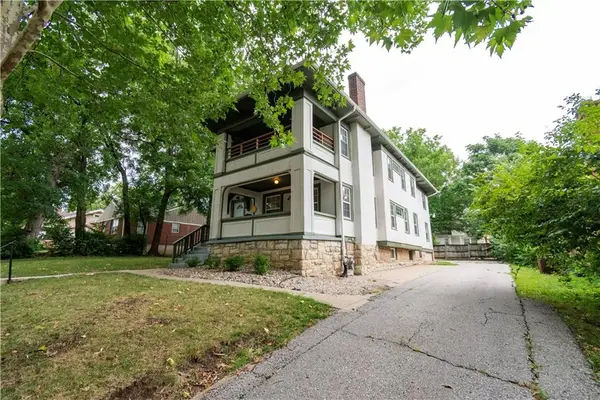 $519,000Active-- beds -- baths
5331 Charlotte Street, Kansas City, MO 64110
MLS# 2607670Listed by: LUTZ SALES + INVESTMENTS $1,350,000Active-- beds -- baths
3401 Central Street, Kansas City, MO 64105
MLS# 2606059Listed by: LEGENDARY APARTMENT BROKERS $849,000Active-- beds -- baths
4121-4123 Walnut Street, Kansas City, MO 64111
MLS# 2594894Listed by: LUTZ SALES + INVESTMENTS $495,000Active-- beds -- baths
4000 Campbell Street, Kansas City, MO 64110
MLS# 2599048Listed by: PETRA $539,000Active-- beds -- baths
3627-3629 Wyandotte Street, Kansas City, MO 64111
MLS# 2598148Listed by: LUTZ SALES + INVESTMENTS $875,000Pending-- beds -- baths
206 W 34th Street, Kansas City, MO 64111
MLS# 2601030Listed by: PEAK REAL ESTATE PARTNERS, LLC $5,800,000Active-- beds -- baths
3201-3211 Broadway Street, Kansas City, MO 64111
MLS# 2600487Listed by: CLEMONS REAL ESTATE LLC $3,189,000Active-- beds -- baths
112-120 E 43rd Street, Kansas City, MO 64111
MLS# 2598249Listed by: LUTZ SALES + INVESTMENTS $389,000Active-- beds -- baths
3621 Central Street, Kansas City, MO 64111
MLS# 2598289Listed by: CLEMONS REAL ESTATE LLC $550,000Active-- beds -- baths
4244 Terrace Street, Kansas City, MO 64111
MLS# 2598281Listed by: PEAK REAL ESTATE PARTNERS, LLC $525,000Active-- beds -- baths
4128 Locust Street, Kansas City, MO 64110
MLS# 2597682Listed by: REAL BROKER, LLC $799,000Active-- beds -- baths
4200 Harrison Street, Kansas City, MO 64110
MLS# 2582010Listed by: 1ST CLASS REAL ESTATE KC $429,000Active-- beds -- baths
1115 E 41st Street, Kansas City, MO 64110
MLS# 2592461Listed by: DANREEDY, INC. $1,699,900Active-- beds -- baths
3841-5 Wyandotte Street, Kansas City, MO 64111
MLS# 2591733Listed by: THE CASTER TEAM REAL ESTATE $659,000Active-- beds -- baths
1017 W 39th Street, Kansas City, MO 64111
MLS# 2591468Listed by: COMPASS REALTY GROUP $524,900Active-- beds -- baths
3619 Wyandotte Street, Kansas City, MO 64111
MLS# 2588396Listed by: LEGENDARY APARTMENT BROKERS $590,000Active-- beds -- baths
3951 Warwick Street, Kansas City, MO 64111
MLS# 2584715Listed by: PLATINUM REALTY LLC $375,000Active-- beds -- baths
3826 Warwick Boulevard, Kansas City, MO 64111
MLS# 2583628Listed by: CLEMONS REAL ESTATE LLC $525,000Active-- beds -- baths
3933 Warwick Boulevard, Kansas City, MO 64111
MLS# 2583616Listed by: CLEMONS REAL ESTATE LLC $3,950,000Pending-- beds -- baths
3727 Southwest Trafficway, Kansas City, MO 64111
MLS# 2581382Listed by: LUTZ SALES + INVESTMENTS $639,000Active-- beds -- baths
201 W 51st Terrace, Kansas City, MO 64112
MLS# 2578366Listed by: CHARTWELL REALTY LLC $2,690,000Pending-- beds -- baths
806 W 38th Street, Kansas City, MO 64111
MLS# 2575914Listed by: LUTZ SALES + INVESTMENTS $849,900Active-- beds -- baths
4063 Warwick Boulevard, Kansas City, MO 64111
MLS# 2563729Listed by: CASCADE FINANCIAL INVESTMENTS $450,000Active-- beds -- baths
4527 Forest Avenue, Kansas City, MO 64110
MLS# 2549026Listed by: COMPASS REALTY GROUP $450,000Active-- beds -- baths
4521 Forest Avenue, Kansas City, MO 64110
MLS# 2522612Listed by: COMPASS REALTY GROUP
Local realty services provided by:CENTURY 21 Crossroads
Popular neighborhoods near Midtown, Kansas City, MO
Zip codes near Midtown, Kansas City, MO
- 64105 homes for sale
- 64106 homes for sale
- 64108 homes for sale
- 64109 homes for sale
- 64110 homes for sale
- 64111 homes for sale
- 64112 homes for sale
- 64113 homes for sale
- 64124 homes for sale
- 64127 homes for sale
- 64128 homes for sale
- 64129 homes for sale
- 64130 homes for sale
- 64132 homes for sale
- 66101 homes for sale
- 66103 homes for sale
- 66105 homes for sale
- 66202 homes for sale
- 66205 homes for sale
- 66208 homes for sale
Counties near Midtown, Kansas City, MO
- Atchison County homes for sale
- Bates County homes for sale
- Buchanan County homes for sale
- Caldwell County homes for sale
- Cass County homes for sale
- Clay County homes for sale
- Clinton County homes for sale
- Douglas County homes for sale
- Franklin County homes for sale
- Jackson County homes for sale
- Jefferson County homes for sale
- Johnson County homes for sale
- Johnson County homes for sale
- Lafayette County homes for sale
- Leavenworth County homes for sale
- Linn County homes for sale
- Miami County homes for sale
- Platte County homes for sale
- Ray County homes for sale
- Wyandotte County homes for sale
Protect your home and budget from life's surprises with an Assurant Home Warranty, backed by a partner that supports you through every step of homeownership. Explore Plans.
©2026 Century 21 Real Estate LLC. All rights reserved. CENTURY 21®, the CENTURY 21 Logo and C21® are service marks owned by Century 21 Real Estate LLC. Century 21 Real Estate LLC fully supports the principles of the Fair Housing Act and the Equal Opportunity Act. Each office is independently owned and operated. Listing information is deemed reliable but not guaranteed accurate.