- Addison properties for sale
- Bridport properties for sale
- Cornwall properties for sale
- Crown Point properties for sale
- Elizabethtown properties for sale
- Essex properties for sale
- Ferrisburgh properties for sale
- Keene properties for sale
- Lewis properties for sale
- Middlebury properties for sale
- Mineville properties for sale
- Moriah properties for sale
- New Russia properties for sale
- Port Henry properties for sale
- Shoreham properties for sale
- Ticonderoga town properties for sale
- Vergennes properties for sale
- Westport properties for sale
- Westport town properties for sale
- Weybridge properties for sale
12956, NY - homes for sale
12 of 12 results displayed
- New
 $135,000Active3 beds 1 baths1,456 sq. ft.
109 Joyce Road, Moriah, NY 12956
MLS# 202530786Listed by: COUNTRY ROAD REAL ESTATE  $179,900Active3 beds 2 baths1,189 sq. ft.
19 Foote Street, Moriah, NY 12956
MLS# 202529307Listed by: COUNTRY ROAD REAL ESTATE $59,000Active3 beds 2 baths720 sq. ft.
36 Champlain Drive, Moriah, NY 12956
MLS# 202528255Listed by: COUNTRY ROAD REAL ESTATE $65,000Active3 beds 1 baths1,170 sq. ft.
3186 Plank Road, Moriah, NY 12956
MLS# 202528064Listed by: ADVANTAGE REALTY LLC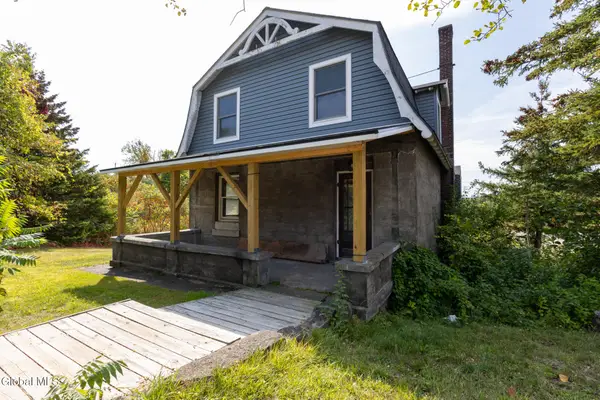 $170,000Pending3 beds 2 baths2,105 sq. ft.
29 Veterans Way, Moriah, NY 12956
MLS# 202526579Listed by: EXP REALTY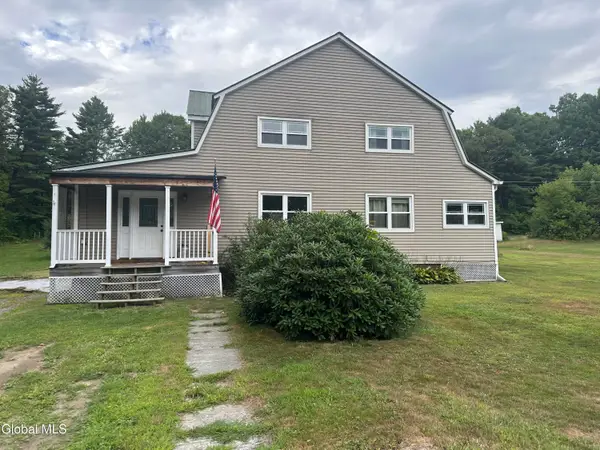 $150,000Pending6 beds 2 baths1,984 sq. ft.
26 Republic Street, Moriah, NY 12956
MLS# 202524239Listed by: COUNTRY ROAD REAL ESTATE $199,900Active3 beds 1 baths1,254 sq. ft.
107 Champlain Drive, Moriah, NY 12956
MLS# 202524116Listed by: COLDWELL BANKER WHITBECK ASSOC $69,900Pending3 beds 1 baths1,092 sq. ft.
13 Foote Street, Moriah, NY 12956
MLS# 202521934Listed by: HOWARD HANNA
 $219,999Active2 beds 1 baths1,224 sq. ft.
92 Riddle Road, Moriah, NY 12956
MLS# 202519429Listed by: CENTURY 21 - ADIRONDACKS $329,900Active4 beds 1 baths2,966 sq. ft.
2940 Plank Road, Moriah, NY 12956
MLS# 202518687Listed by: JULIE & CO REALTY LLC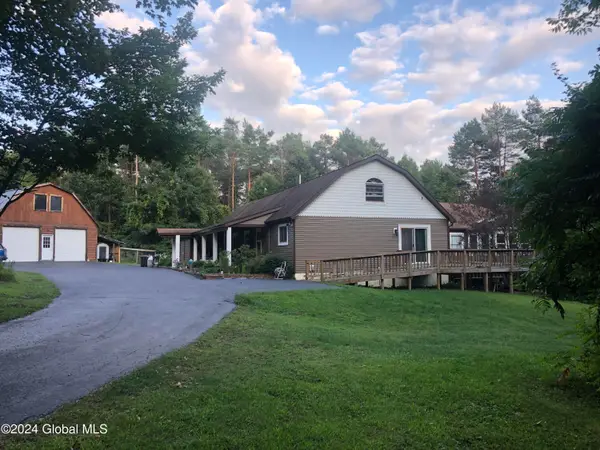 $419,900Active3 beds 3 baths3,160 sq. ft.
2842 Plank Road, Moriah, NY 12956
MLS# 202423980Listed by: COLDWELL BANKER WHITBECK ASSOC $125,000Active-- beds -- baths2,604 sq. ft.
3197 Plank Road, Mineville, NY 12956
MLS# 206158Listed by: COLDWELL BANKER WHITBECK ASSOC. PLATTSBURGH
Local realty services provided by:CENTURY 21 North East, CENTURY 21 TheOne
Popular searches near 12956
Popular neighborhoods near 12956
- Arrowhead Lake, Milton properties for sale
- Catamount, Milton properties for sale
- Central Burlington, Burlington properties for sale
- Clifton Park Town Center, Clifton Park properties for sale
- Downtown Burlington, Burlington properties for sale
- East Side, Claremont properties for sale
- Lamoille, Milton properties for sale
- Milton Village Center, Milton properties for sale
- New North End, Burlington properties for sale
- Old North End, Burlington properties for sale
- Riverside, Burlington properties for sale
- Shelburne Center, Shelburne properties for sale
- South End, Burlington properties for sale
- South End, Claremont properties for sale
- Town Core, Milton properties for sale
- UVM, Burlington properties for sale
- West Claremont, Claremont properties for sale
- West Lebanon, West Lebanon properties for sale
- West Milton, Milton properties for sale
- West Side, Claremont properties for sale
Counties near Mineville, 12956
- Addison County properties for sale
- Bennington County properties for sale
- Caledonia County properties for sale
- Chittenden County properties for sale
- Clinton County properties for sale
- Essex County properties for sale
- Franklin County properties for sale
- Franklin County properties for sale
- Grand Isle County properties for sale
- Hamilton County properties for sale
- Lamoille County properties for sale
- Orange County properties for sale
- Orleans County properties for sale
- Rutland County properties for sale
- Saratoga County properties for sale
- Sullivan County properties for sale
- Warren County properties for sale
- Washington County properties for sale
- Washington County properties for sale
- Windsor County properties for sale
©2025 Century 21 Real Estate LLC. All rights reserved. CENTURY 21®, the CENTURY 21 Logo and C21® are service marks owned by Century 21 Real Estate LLC. Century 21 Real Estate LLC fully supports the principles of the Fair Housing Act and the Equal Opportunity Act. Each office is independently owned and operated. Listing information is deemed reliable but not guaranteed accurate.
©2025 Century 21 Real Estate LLC. All rights reserved. CENTURY 21®, the CENTURY 21 Logo and C21® are service marks owned by Century 21 Real Estate LLC. Century 21 Real Estate LLC fully supports the principles of the Fair Housing Act and the Equal Opportunity Act. Each office is independently owned and operated. Listing information is deemed reliable but not guaranteed accurate.