- Arden Hills homes for sale
- Brooklyn Center homes for sale
- Brooklyn Park homes for sale
- Circle Pines homes for sale
- Columbia Heights homes for sale
- Crystal homes for sale
- Falcon Heights homes for sale
- Fridley homes for sale
- Golden Valley homes for sale
- Lauderdale homes for sale
- Minneapolis homes for sale
- Mounds View homes for sale
- New Brighton homes for sale
- New Hope homes for sale
- Robbinsdale homes for sale
- Roseville homes for sale
- St Anthony homes for sale
- St Anthony homes for sale
- Shoreview homes for sale
- Spring Lake Park homes for sale
55421, MN - homes for sale
102 of 102 results displayed
- New
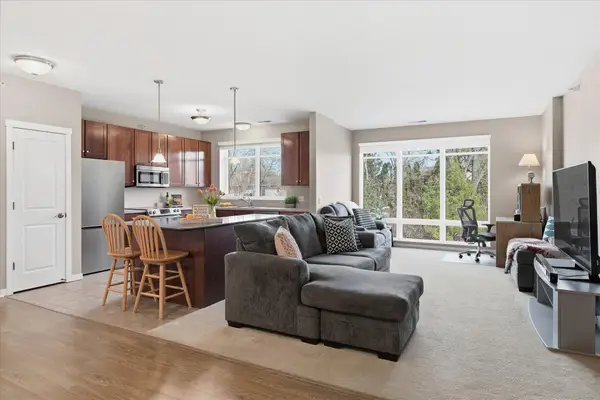 $239,900Active2 beds 2 baths1,389 sq. ft.
1070 Grandview Court Ne #414, Columbia Heights, MN 55421
MLS# 7041307Listed by: RE/MAX RESULTS - Coming Soon
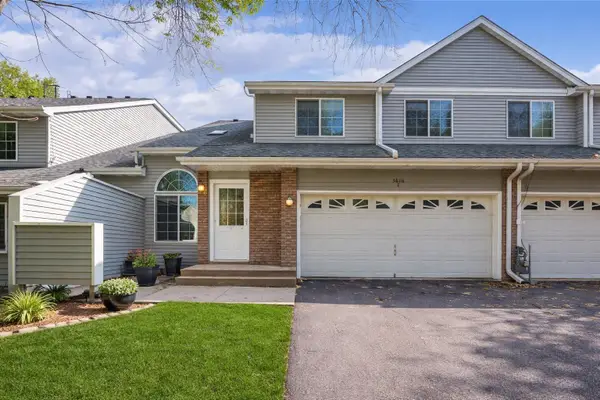 $299,900Coming Soon3 beds 3 baths
3816 Foss Road #7, Saint Anthony, MN 55421
MLS# 7044058Listed by: RE/MAX PROFESSIONALS - New
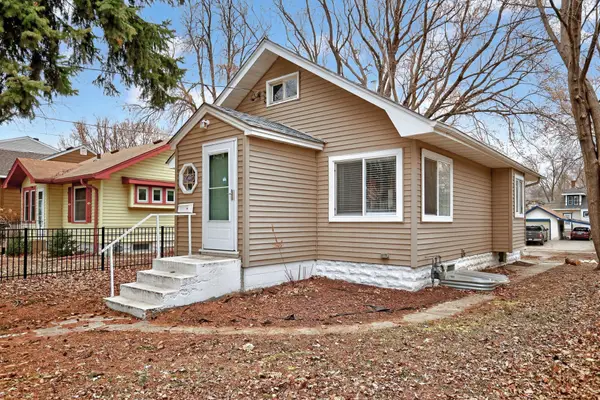 $275,000Active2 beds 2 baths1,260 sq. ft.
4017 4th Street Ne, Columbia Heights, MN 55421
MLS# 7016147Listed by: KELLER WILLIAMS CLASSIC REALTY - New
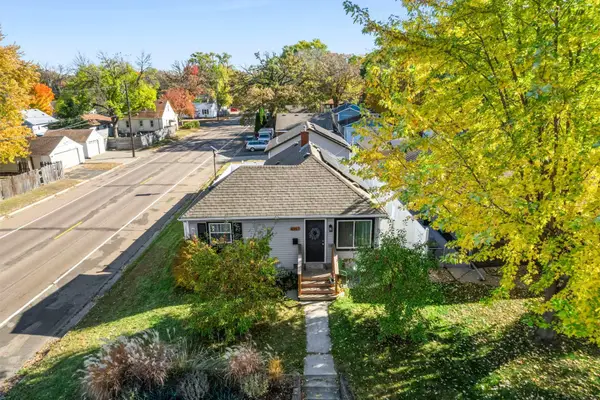 $285,000Active2 beds 1 baths1,155 sq. ft.
4357 4th Street Ne, Columbia Heights, MN 55421
MLS# 7016730Listed by: REAL BROKER, LLC - New
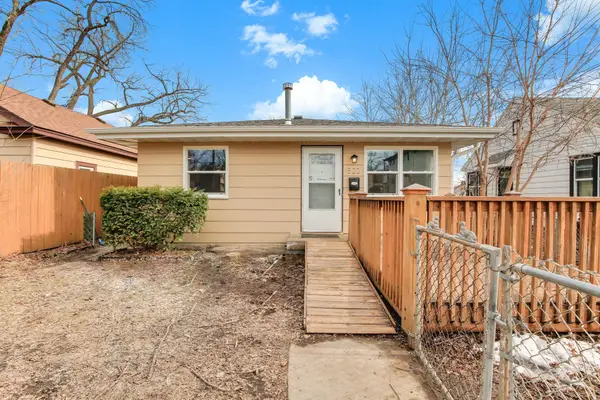 $325,000Active4 beds 2 baths1,872 sq. ft.
522 Summit Street Ne, Columbia Heights, MN 55421
MLS# 7029016Listed by: EXIT REALTY NEXUS - New
 $399,900Active4 beds 3 baths2,464 sq. ft.
3938 Jackson Street Ne, Columbia Heights, MN 55421
MLS# 7032707Listed by: COLDWELL BANKER REALTY - Coming SoonOpen Fri, 4:30 to 6:30pm
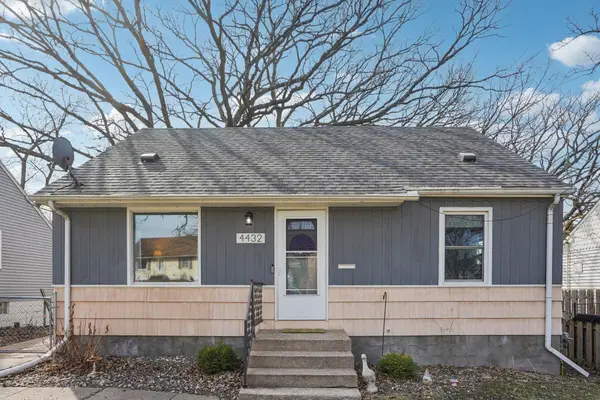 $285,000Coming Soon3 beds 1 baths
4432 3rd Street Ne, Columbia Heights, MN 55421
MLS# 7033880Listed by: JASON MITCHELL REAL ESTATE - New
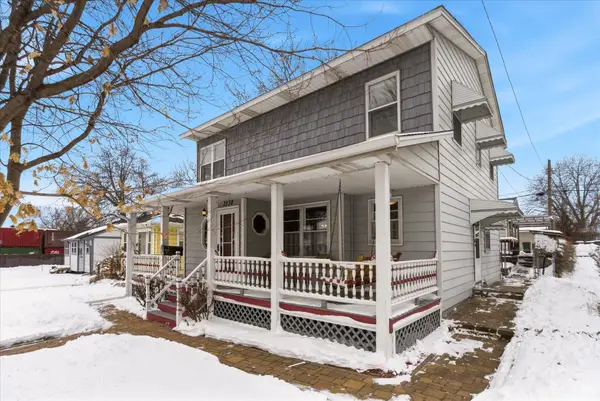
 $535,900Active5 beds 3 baths3,312 sq. ft.
1463 Trollhagen Drive Ne, Fridley, MN 55421
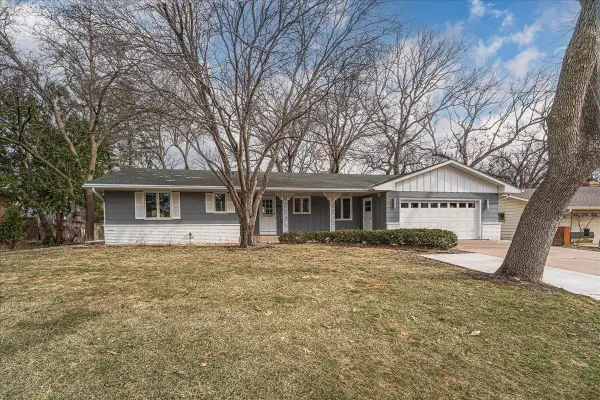
MLS# 7035890Listed by: METROHOMESMARKET.COM - New
 $325,000Active4 beds 3 baths2,122 sq. ft.
5492 Altura Road Ne, Fridley, MN 55421
MLS# 7041801Listed by: COLDWELL BANKER REALTY - LAKES - New
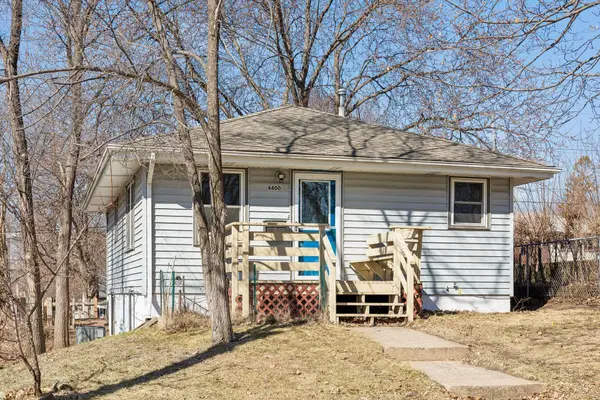 $280,000Active3 beds 2 baths1,336 sq. ft.
4400 Jefferson Street Ne, Columbia Heights, MN 55421
MLS# 7042586Listed by: RE/MAX RESULTS - New
 $285,000Active2 beds 2 baths1,896 sq. ft.
3923 2nd Street Ne, Minneapolis, MN 55421
MLS# 7031955Listed by: EXP REALTY - New
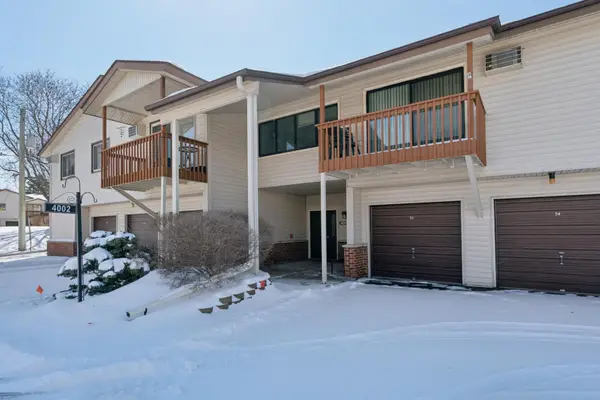 $129,000Active1 beds 1 baths753 sq. ft.
4002 Foss Road #102, Saint Anthony, MN 55421
MLS# 7039725Listed by: EXP REALTY  $300,000Active3 beds 1 baths988 sq. ft.
4412 2 1/2 Street Ne, Columbia Heights, MN 55421
MLS# 7036376Listed by: EDINA REALTY, INC. $325,000Active3 beds 1 baths1,660 sq. ft.
3722 Hayes Street Ne, Columbia Heights, MN 55421
MLS# 7013449Listed by: KELLER WILLIAMS PREMIER REALTY LAKE MINNETONKA $270,000Pending3 beds 2 baths1,221 sq. ft.
4018 5th Street Ne, Columbia Heights, MN 55421
MLS# 7037018Listed by: COMPASS $414,900Active5 beds 3 baths3,497 sq. ft.
1145 Polk Place Ne, Columbia Heights, MN 55421
MLS# 7036367Listed by: SAVVY AVENUE, LLC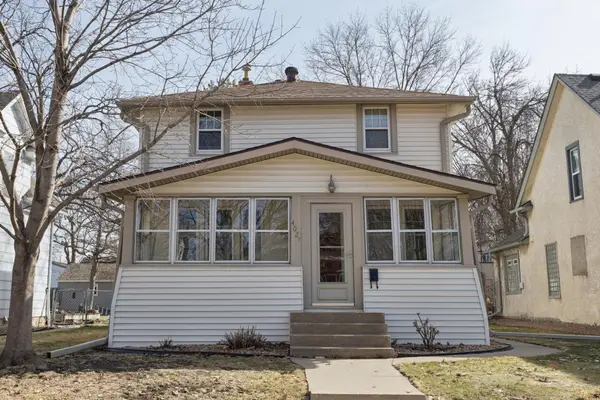 $275,000Active3 beds 2 baths1,368 sq. ft.
4027 5th Street Ne, Columbia Heights, MN 55421
MLS# 7035780Listed by: RE/MAX SYNERGY $415,000Pending6 beds 3 baths2,386 sq. ft.
401 46th Avenue Ne, Columbia Heights, MN 55421
MLS# 7033989Listed by: EDINA REALTY, INC.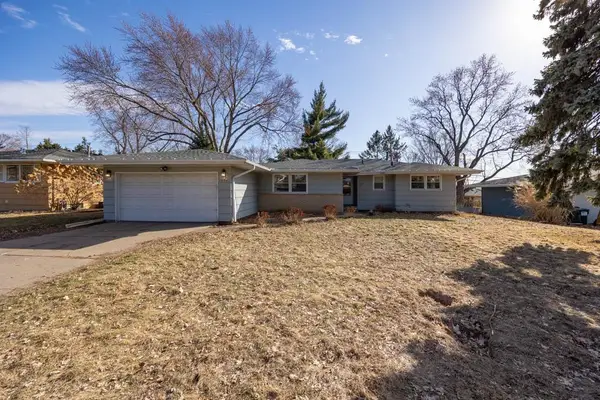 $360,000Active3 beds 2 baths2,324 sq. ft.
1040 Lincoln Terrace, Columbia Heights, MN 55421
MLS# 7033742Listed by: RE/MAX RESULTS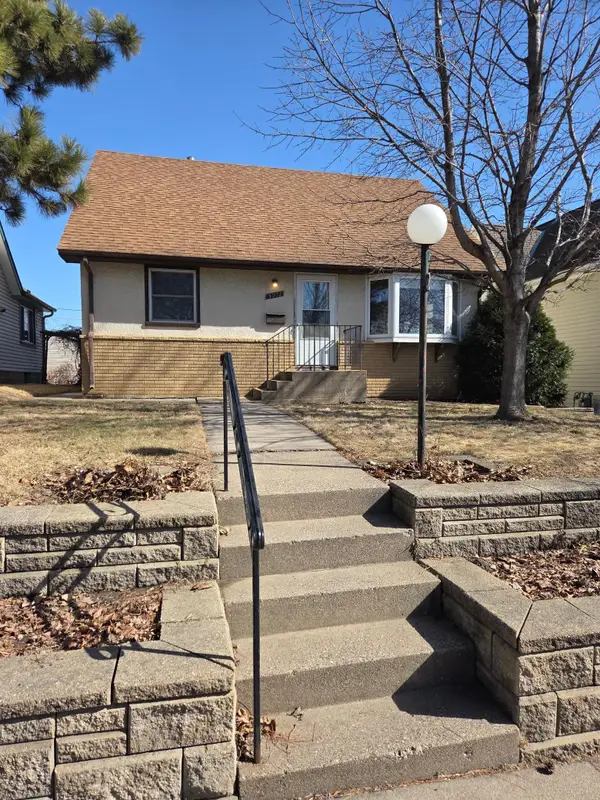 $340,000Active6 beds 3 baths2,500 sq. ft.
3971 Quincy Street Ne, Minneapolis, MN 55421
MLS# 7033831Listed by: KELLY'S DIAMOND REALTY LLC $340,000Pending6 beds 3 baths2,300 sq. ft.
3971 Quincy Street Ne, Columbia Heights, MN 55421
MLS# 7033831Listed by: KELLY'S DIAMOND REALTY LLC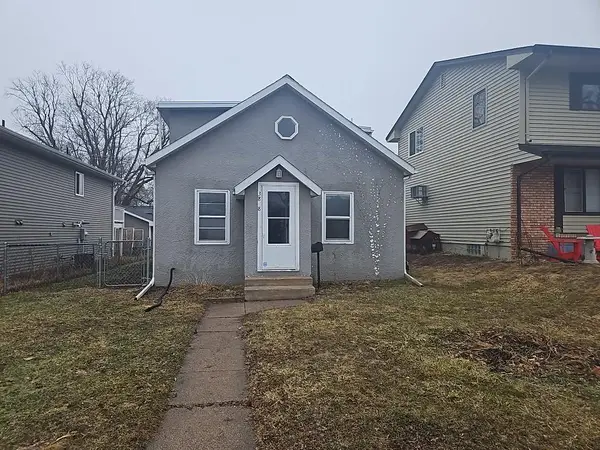 $175,000Pending2 beds 2 baths1,403 sq. ft.
3848 2nd Street Ne, Columbia Heights, MN 55421
MLS# 7033569Listed by: REALTY EXECUTIVES TOP RESULTS $299,000Pending3 beds 1 baths1,440 sq. ft.
136 Panorama Avenue, Fridley, MN 55421
MLS# 7031712Listed by: CALL IT CLOSED INTERNATIONAL REALTY $275,000Active4 beds 1 baths1,197 sq. ft.
5168 Hughes Avenue, Fridley, MN 55421
MLS# 7022578Listed by: EDINA REALTY, INC. $320,000Pending4 beds 2 baths1,925 sq. ft.
2308 Maiden Lane, Columbia Heights, MN 55421
MLS# 7033240Listed by: MOLINA REALTORS $570,000Pending5 beds 4 baths4,100 sq. ft.
1142 Cheery Lane Ne, Columbia Heights, MN 55421
MLS# 7031051Listed by: ERA PROSPERA REAL ESTATE $339,900Active4 beds 2 baths1,755 sq. ft.
2139 Highland Place, Columbia Heights, MN 55421
MLS# 7028647Listed by: NATIONAL REALTY GUILD $480,000Active6 beds 4 baths2,340 sq. ft.
1321 Circle Terrace Boulevard Ne, Minneapolis, MN 55421
MLS# 7021036Listed by: COMPASS $389,900Active4 beds 2 baths1,890 sq. ft.
4615 Johnson Street Ne, Columbia Heights, MN 55421
MLS# 7031412Listed by: PEMBERTON RE $259,995Active2 beds 2 baths1,728 sq. ft.
4444 Jackson Street Ne, Minneapolis, MN 55421
MLS# 7030140Listed by: PROPERTY EXECUTIVES REALTY $259,995Active2 beds 2 baths1,596 sq. ft.
4444 Jackson Street Ne, Columbia Heights, MN 55421
MLS# 7030140Listed by: PROPERTY EXECUTIVES REALTY $275,000Active2 beds 3 baths2,223 sq. ft.
1070 Grandview Court Ne #304, Columbia Heights, MN 55421
MLS# 7029423Listed by: EDINA REALTY, INC $275,000Active2 beds 3 baths2,223 sq. ft.
1070 Grandview Court Ne #304, Columbia Heights, MN 55421
MLS# 7029423Listed by: EDINA REALTY, INC $375,000Pending3 beds 3 baths1,650 sq. ft.
4145 Monroe Street Ne, Minneapolis, MN 55421
MLS# 7009172Listed by: COLDWELL BANKER REALTY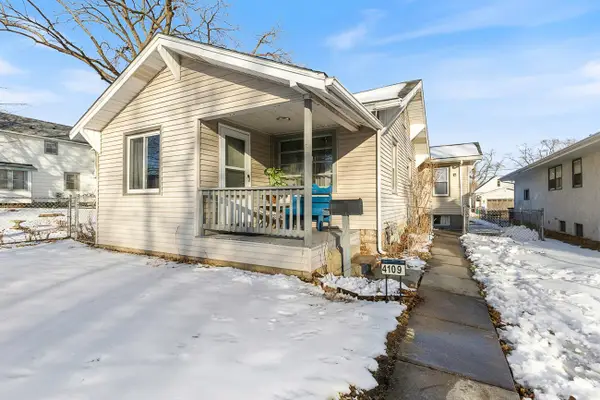 $289,900Active4 beds 2 baths1,634 sq. ft.
4109 Madison Street Ne, Columbia Heights, MN 55421
MLS# 7022633Listed by: NEXT GENERATION REALTY LLC $134,900Active1 beds 1 baths781 sq. ft.
1000 41st Avenue Ne #306, Columbia Heights, MN 55421
MLS# 7024284Listed by: PEMBERTON RE $134,900Active1 beds 1 baths781 sq. ft.
1000 41st Avenue Ne #306, Columbia Heights, MN 55421
MLS# 7024284Listed by: PEMBERTON RE $425,000Pending4 beds 2 baths2,312 sq. ft.
4017 Shamrock Drive Ne, Saint Anthony, MN 55421
MLS# 7001164Listed by: RE/MAX RESULTS $530,000Active7 beds 4 baths2,727 sq. ft.
5370 5th Street Ne, Fridley, MN 55421
MLS# 7027674Listed by: HOME-MART REALTY $200,000Pending1 beds 2 baths1,092 sq. ft.
1070 Grandview Court Ne #207, Columbia Heights, MN 55421
MLS# 7024514Listed by: EDINA REALTY, INC. $269,999Active3 beds 1 baths949 sq. ft.
1108 45th Avenue Ne, Columbia Heights, MN 55421
MLS# 7006696Listed by: KRIS LINDAHL REAL ESTATE $324,000Active3 beds 2 baths2,013 sq. ft.
3960 Arthur Street Ne, Columbia Heights, MN 55421
MLS# 7020237Listed by: RE/MAX RESULTS $470,000Active8 beds 2 baths3,975 sq. ft.
4144 Quincy Street Ne, Minneapolis, MN 55421
MLS# 7025332Listed by: FUZE REAL ESTATE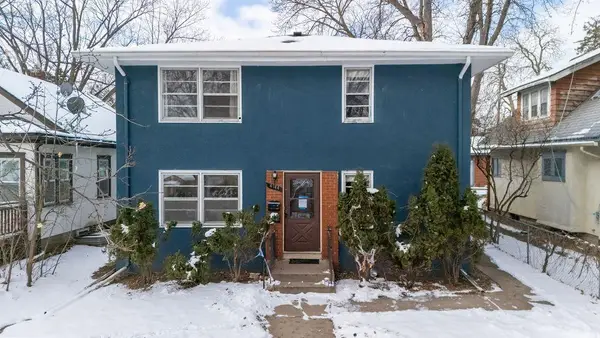 $470,000Active8 beds 2 baths2,650 sq. ft.
4144 Quincy Street Ne, Columbia Heights, MN 55421
MLS# 7025332Listed by: FUZE REAL ESTATE $200,000Pending1 beds 2 baths1,092 sq. ft.
1070 Grandview Court Ne #207, Columbia Heights, MN 55421
MLS# 7024514Listed by: EDINA REALTY, INC.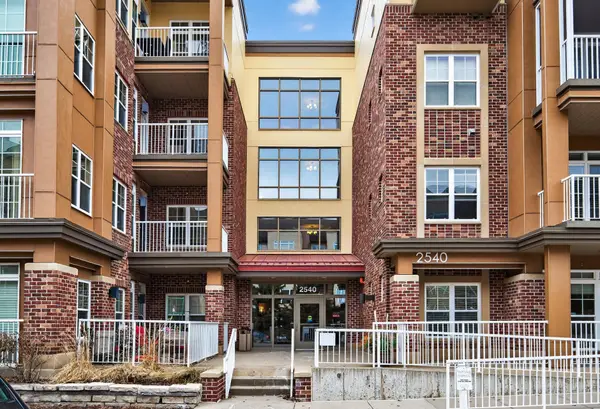 $285,000Active1 beds 2 baths1,398 sq. ft.
2540 38th Avenue Ne #203, Saint Anthony, MN 55421
MLS# 7023905Listed by: LPT REALTY, LLC $285,000Active1 beds 2 baths1,398 sq. ft.
2540 38th Avenue Ne #203, Saint Anthony, MN 55421
MLS# 7023905Listed by: LPT REALTY, LLC $374,900Active5 beds 2 baths2,137 sq. ft.
2113 Fairway Drive Ne, Columbia Heights, MN 55421
MLS# 7023729Listed by: NATIONAL REALTY GUILD $339,900Active5 beds 2 baths1,922 sq. ft.
4121 2nd Street Ne, Columbia Heights, MN 55421
MLS# 7023367Listed by: NATIONAL REALTY GUILD $233,000Pending3 beds 1 baths1,052 sq. ft.
513 54th Avenue Ne, Fridley, MN 55421
MLS# 7023237Listed by: REALTY ONE GROUP CHOICE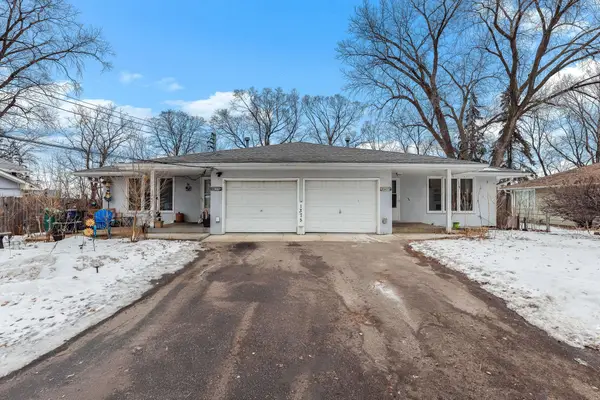 $435,000Pending6 beds 4 baths2,730 sq. ft.
1375 Skywood Lane Ne, Fridley, MN 55421
MLS# 7022768Listed by: COLDWELL BANKER REALTY - SOUTHWEST REGIONAL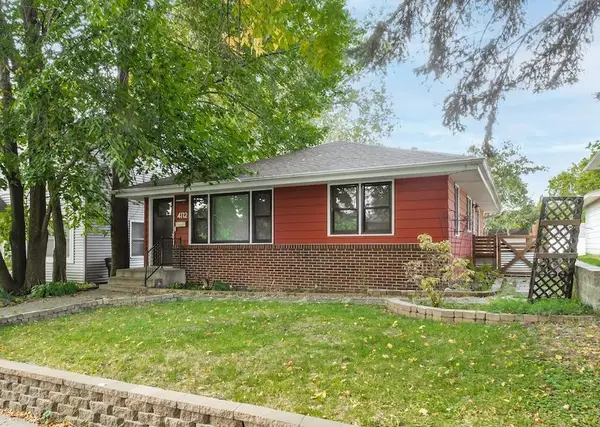 $325,000Pending2 beds 1 baths1,526 sq. ft.
4112 7th Street Ne, Columbia Heights, MN 55421
MLS# 7021517Listed by: ANDERSON REALTY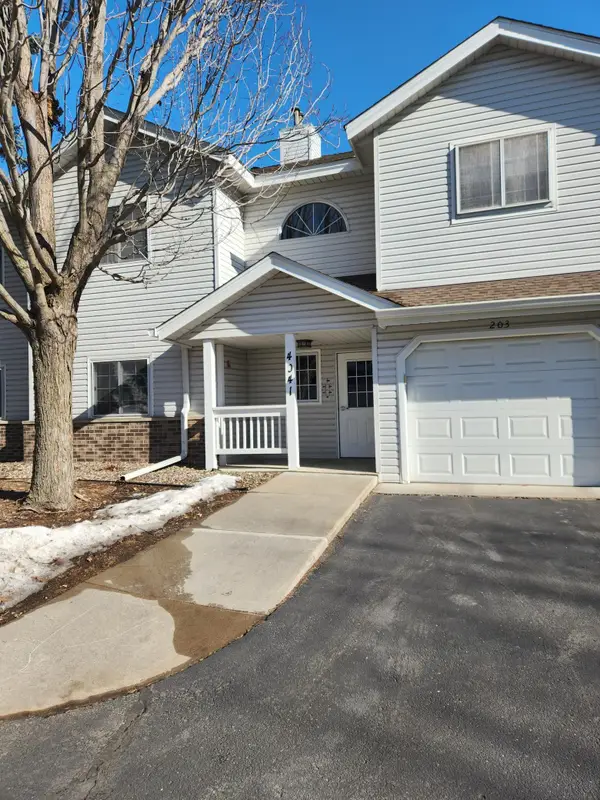 $195,000Active3 beds 2 baths1,303 sq. ft.
4041 Maureen Drive Ne #103, Minneapolis, MN 55421
MLS# 7020125Listed by: COUNSELOR REALTY, INC $195,000Active3 beds 2 baths1,303 sq. ft.
4041 Maureen Drive Ne #103, Columbia Heights, MN 55421
MLS# 7020125Listed by: COUNSELOR REALTY, INC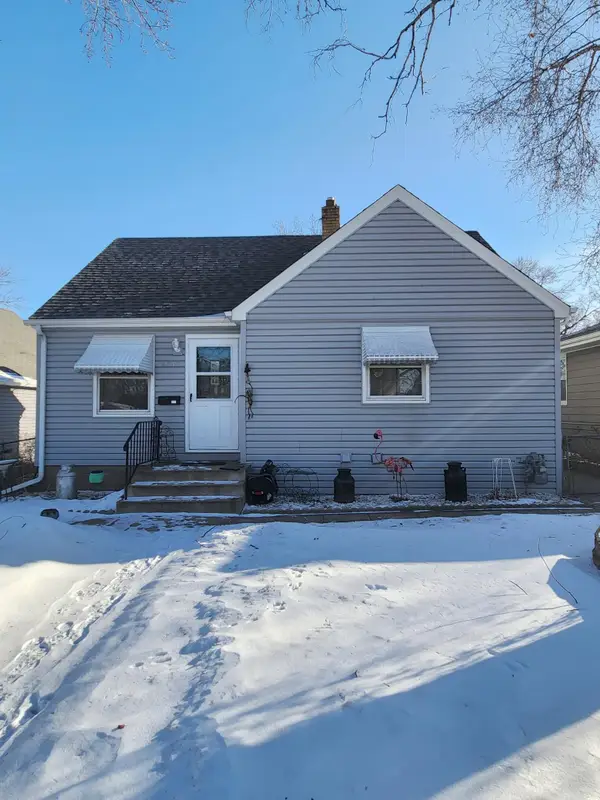 $230,000Pending3 beds 2 baths1,536 sq. ft.
4737 4th Street Ne, Minneapolis, MN 55421
MLS# 7013082Listed by: COUNSELOR REALTY, INC $230,000Pending3 beds 2 baths1,536 sq. ft.
4737 4th Street Ne, Columbia Heights, MN 55421
MLS# 7013082Listed by: COUNSELOR REALTY, INC $349,900Pending4 beds 2 baths1,896 sq. ft.
714 50th Avenue Ne, Columbia Heights, MN 55421
MLS# 7014007Listed by: KELLER WILLIAMS PREMIER REALTY LAKE MINNETONKA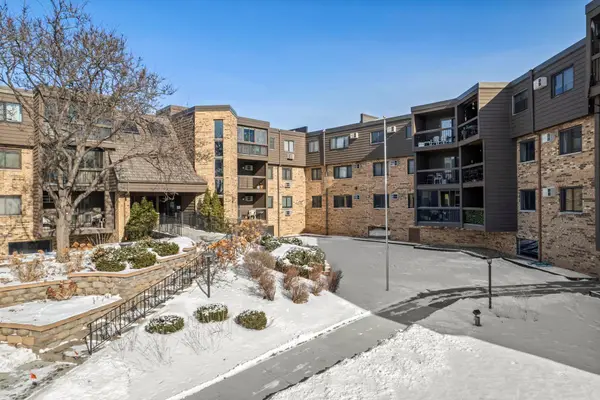 $133,000Pending1 beds 1 baths748 sq. ft.
999 41st Avenue Ne #203, Columbia Heights, MN 55421
MLS# 7018707Listed by: KELLER WILLIAMS PREMIER REALTY $133,000Pending1 beds 1 baths748 sq. ft.
999 41st Avenue Ne #203, Columbia Heights, MN 55421
MLS# 7018707Listed by: KELLER WILLIAMS PREMIER REALTY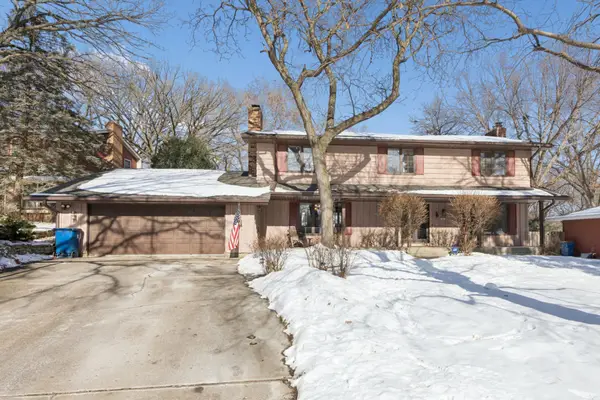 $499,000Pending4 beds 3 baths3,302 sq. ft.
1601 Berne Road Ne, Fridley, MN 55421
MLS# 7017460Listed by: RE/MAX SYNERGY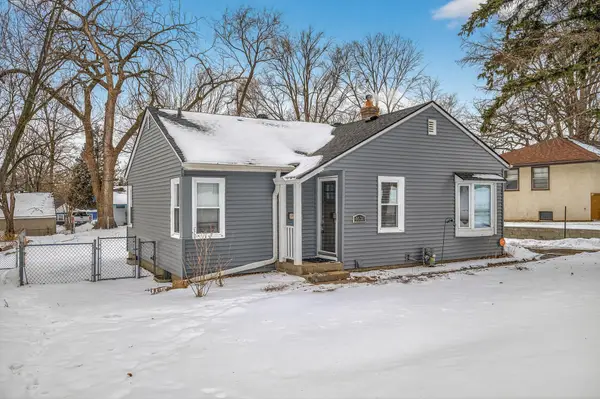 $290,000Active2 beds 1 baths1,718 sq. ft.
4630 7th Street Ne, Columbia Heights, MN 55421
MLS# 7016801Listed by: EXP REALTY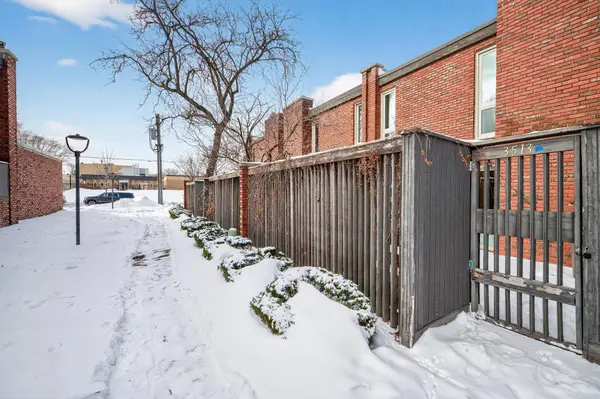 $250,000Active3 beds 2 baths1,554 sq. ft.
3513 37th Avenue Ne, Minneapolis, MN 55421
MLS# 6814899Listed by: COLDWELL BANKER REALTY $374,900Active5 beds 2 baths2,112 sq. ft.
4507 Taylor Street Ne, Minneapolis, MN 55421
MLS# 7015826Listed by: EXIT REALTY NEXUS $250,000Active3 beds 2 baths1,554 sq. ft.
3513 37th Avenue Ne, Saint Anthony, MN 55421
MLS# 6814899Listed by: COLDWELL BANKER REALTY $315,000Pending2 beds 3 baths1,880 sq. ft.
327 Naegele Avenue, Columbia Heights, MN 55421
MLS# 7015104Listed by: NATIONAL REALTY GUILD $315,000Pending2 beds 3 baths1,880 sq. ft.
327 Naegele Avenue, Minneapolis, MN 55421
MLS# 7015104Listed by: NATIONAL REALTY GUILD $195,000Pending2 beds 1 baths707 sq. ft.
4217 Washington Street Ne, Columbia Heights, MN 55421
MLS# 6801050Listed by: KELLER WILLIAMS CLASSIC REALTY $120,000Active1 beds 1 baths777 sq. ft.
1000 41st Avenue Ne #204, Minneapolis, MN 55421
MLS# 7012628Listed by: EXP REALTY $120,000Active1 beds 1 baths777 sq. ft.
1000 41st Avenue Ne #204, Columbia Heights, MN 55421
MLS# 7012628Listed by: EXP REALTY $145,000Active2 beds 2 baths1,175 sq. ft.
4088 Foss Road #137, Saint Anthony, MN 55421
MLS# 7012445Listed by: COLDWELL BANKER REALTY - LAKES $145,000Active2 beds 2 baths1,787 sq. ft.
4088 Foss Road #137, Minneapolis, MN 55421
MLS# 7012445Listed by: COLDWELL BANKER REALTY - LAKES $350,000Pending4 beds 2 baths1,592 sq. ft.
5110 Washington Street Ne, Columbia Heights, MN 55421
MLS# 7009429Listed by: ASHWORTH REAL ESTATE $345,000Pending4 beds 2 baths2,250 sq. ft.
4561 2 1/2 Street Ne, Minneapolis, MN 55421
MLS# 7010761Listed by: KELLER WILLIAMS INTEGRITY REALTY $360,000Active4 beds 2 baths1,900 sq. ft.
4235 Royce Street Ne, Columbia Heights, MN 55421
MLS# 7009060Listed by: RE/MAX RESULTS $360,000Active5 beds 2 baths1,895 sq. ft.
3723 Johnson Street Ne, Columbia Heights, MN 55421
MLS# 7006350Listed by: EDINA REALTY, INC. $299,900Active4 beds 2 baths2,266 sq. ft.
5027 6th Street Ne, Columbia Heights, MN 55421
MLS# 7030357Listed by: ASHWORTH REAL ESTATE $189,500Active2 beds 2 baths1,131 sq. ft.
4040 Maureen Drive Ne #202, Columbia Heights, MN 55421
MLS# 6825334Listed by: THEMLSONLINE.COM, INC. $189,500Active2 beds 2 baths
4040 Maureen Drive Ne #202, Columbia Heights, MN 55421
MLS# 6825334Listed by: THEMLSONLINE.COM, INC. $299,900Pending3 beds 2 baths1,388 sq. ft.
3959 Arthur Street Ne, Columbia Heights, MN 55421
MLS# 6750510Listed by: KELLER WILLIAMS CLASSIC REALTY $339,500Pending5 beds 2 baths2,028 sq. ft.
960 43 1/2 Avenue Ne, Columbia Heights, MN 55421
MLS# 6824791Listed by: PARTNERS REALTY INC. $99,500Pending1 beds 1 baths868 sq. ft.
1011 41st Avenue Ne #306, Minneapolis, MN 55421
MLS# 6821398Listed by: NORTH OAKS REALTY, LLC $99,500Pending1 beds 1 baths868 sq. ft.
1011 41st Avenue Ne #306, Columbia Heights, MN 55421
MLS# 6821398Listed by: NORTH OAKS REALTY, LLC $285,000Pending3 beds 2 baths1,508 sq. ft.
4035 Silver Lake Road Ne, Saint Anthony, MN 55421
MLS# 6814827Listed by: BRIDGE REALTY, LLC $285,000Pending3 beds 2 baths1,508 sq. ft.
4035 Silver Lake Road Ne, Saint Anthony, MN 55421
MLS# 6814827Listed by: BRIDGE REALTY, LLC $279,900Active3 beds 1 baths1,512 sq. ft.
4105 4th Street Ne, Columbia Heights, MN 55421
MLS# 6809056Listed by: HOT MARKET REALTY.COM $359,900Active5 beds 2 baths2,016 sq. ft.
4630 Taylor Street Ne, Columbia Heights, MN 55421
MLS# 6807727Listed by: RE/MAX RESULTS $337,000Pending3 beds 2 baths974 sq. ft.
4501 Jefferson Street Ne, Columbia Heights, MN 55421
MLS# 6793622Listed by: BRIDGE REALTY, LLC $330,000Active2 beds 2 baths1,827 sq. ft.
3434 Silver Lane Ne, Saint Anthony, MN 55421
MLS# 7029662Listed by: RE/MAX ADVANTAGE PLUS $330,000Active2 beds 2 baths1,827 sq. ft.
3434 Silver Lane Ne, Saint Anthony, MN 55421
MLS# 7029662Listed by: RE/MAX ADVANTAGE PLUS $139,900Active2 beds 2 baths1,348 sq. ft.
4685 Monroe Street Ne, Fridley, MN 55421
MLS# 6800480Listed by: BRIDGE REALTY, LLC $424,900Pending3 beds 2 baths1,902 sq. ft.
5230 Lincoln Street Ne, Fridley, MN 55421
MLS# 6795792Listed by: EXP REALTY $284,900Pending3 beds 2 baths1,287 sq. ft.
4256 Jackson Street Ne, Columbia Heights, MN 55421
MLS# 6781012Listed by: KELLER WILLIAMS INTEGRITY REALTY $474,900Active3 beds 2 baths1,769 sq. ft.
TBD Lots B & C 389th Avenue, Aitkin, MN 56431
MLS# 6750859Listed by: RE/MAX RESULTS - NISSWA $230,000Active3 beds 2 baths1,207 sq. ft.
4559 Washington Street Ne, Columbia Heights, MN 55421
MLS# 6721029Listed by: EXP REALTY $399,900Pending5 beds 4 baths2,475 sq. ft.
4139 Jefferson Street Ne, Minneapolis, MN 55421
MLS# 6690246Listed by: ENGEL & VOLKERS MINNEAPOLIS BLAINE $169,995Active2 beds 1 baths1,115 sq. ft.
4415 Madison Street Ne, Columbia Heights, MN 55421
MLS# 6643454Listed by: BRIDGE REALTY, LLC $269,900Pending3 beds 1 baths1,902 sq. ft.
5201 Horizon Drive Ne, Minneapolis, MN 55421
MLS# 6641955Listed by: COUNSELOR REALTY, INC $1,399,000Active3 beds 4 baths3,793 sq. ft.
1070 Grandview Court Ne #405, Columbia Heights, MN 55421
MLS# 6823248Listed by: COLDWELL BANKER REALTY $1,299,000Active3 beds 4 baths3,680 sq. ft.
1070 Grandview Court Ne #406, Columbia Heights, MN 55421
MLS# 6823249Listed by: COLDWELL BANKER REALTY $1,399,000Active3 beds 4 baths3,793 sq. ft.
1070 Grandview Court Ne #405, Columbia Heights, MN 55421
MLS# 6823248Listed by: COLDWELL BANKER REALTY - LAKES $1,299,000Active3 beds 4 baths5,184 sq. ft.
1070 Grandview Court Ne #406, Columbia Heights, MN 55421
MLS# 6823249Listed by: COLDWELL BANKER REALTY - LAKES $219,900Pending3 beds 1 baths1,600 sq. ft.
4552 Heights Drive, Columbia Heights, MN 55421
MLS# 6479112Listed by: HOMESTEAD ROAD
Local realty services provided by:CENTURY 21 FM Realty, CENTURY 21 Brainerd Realty, Inc.
Popular searches near 55421
Popular neighborhoods near 55421
- Audubon Park, Minneapolis homes for sale
- Bellvue, Minneapolis homes for sale
- Black Forest, New Brighton homes for sale
- Camden, Minneapolis homes for sale
- Columbia Park, Minneapolis homes for sale
- Evergreen, Minneapolis homes for sale
- Firehouse, Minneapolis homes for sale
- Hilltop, Columbia Heights homes for sale
- Holland, Minneapolis homes for sale
- Lind-Bohanon, Minneapolis homes for sale
- Lions, Minneapolis homes for sale
- McKinley, Minneapolis homes for sale
- New Brighton, Saint Paul homes for sale
- Northeast, Minneapolis homes for sale
- St. Anthony, Minneapolis homes for sale
- St. Anthony, Minneapolis homes for sale
- Summit Manor, Columbia Heights homes for sale
- Waite Park, Minneapolis homes for sale
- Webber-Camden, Minneapolis homes for sale
- Windom Park, Minneapolis homes for sale
Counties near Columbia Heights, 55421
- Anoka County homes for sale
- Benton County homes for sale
- Carver County homes for sale
- Chisago County homes for sale
- Dakota County homes for sale
- Goodhue County homes for sale
- Hennepin County homes for sale
- Isanti County homes for sale
- Le Sueur County homes for sale
- McLeod County homes for sale
- Pierce County homes for sale
- Polk County homes for sale
- Ramsey County homes for sale
- Rice County homes for sale
- St. Croix County homes for sale
- Scott County homes for sale
- Sherburne County homes for sale
- Sibley County homes for sale
- Washington County homes for sale
- Wright County homes for sale
Protect your home and budget from life's surprises with an Assurant Home Warranty, backed by a partner that supports you through every step of homeownership. Explore Plans.
©2026 Century 21 Real Estate LLC. All rights reserved. CENTURY 21®, the CENTURY 21 Logo and C21® are service marks owned by Century 21 Real Estate LLC. Century 21 Real Estate LLC fully supports the principles of the Fair Housing Act and the Equal Opportunity Act. Each office is independently owned and operated. Listing information is deemed reliable but not guaranteed accurate.