- 28 Palms, Fremont homes for sale
- Cameron Hills, Fremont homes for sale
- Canyon Heights, Fremont homes for sale
- Centerville, Fremont homes for sale
- Central, Fremont homes for sale
- Cherry, Fremont homes for sale
- East Industrial, Fremont homes for sale
- Glenmoor, Fremont homes for sale
- Grimmer, Fremont homes for sale
- Irvington, Fremont homes for sale
- Kimber, Fremont homes for sale
- Mission Hills, Fremont homes for sale
- Mission Valley, Fremont homes for sale
- Niles, Fremont homes for sale
- Parkmont, Fremont homes for sale
- South Sundale, Fremont homes for sale
- Sundale, Fremont homes for sale
- Sunnyhills, Milpitas homes for sale
- Vineyards, Fremont homes for sale
- Warm Springs, Fremont homes for sale
Mission San Jose, Fremont, CA - homes for sale
10 of 10 results displayed
- New
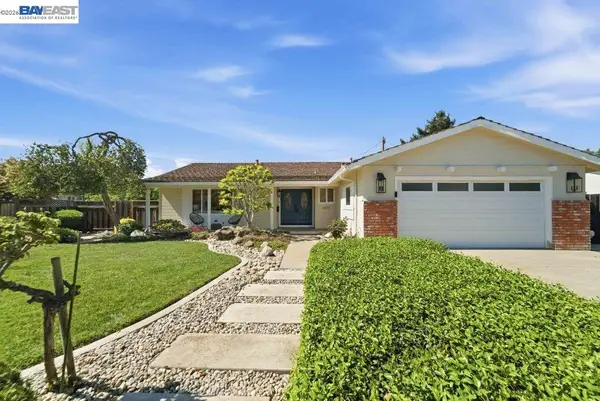 $1,988,888Active3 beds 2 baths1,682 sq. ft.
43075 Gallegos, Fremont, CA 94539
MLS# 41128557Listed by: GOLDEN GATE SOTHEBY'S INT'L
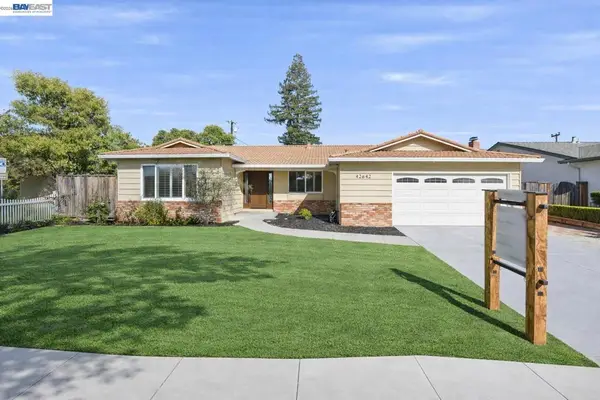 $2,495,000Pending4 beds 3 baths2,028 sq. ft.
42642 Sully St, Fremont, CA 94539
MLS# 41127241Listed by: COMPASS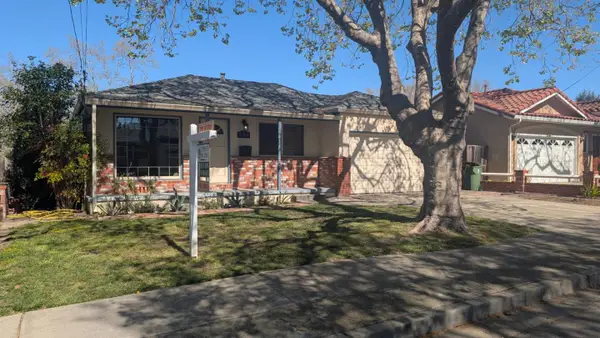 $1,538,000Pending3 beds 1 baths1,008 sq. ft.
353 Dana Street, Fremont, CA 94539
MLS# ML82038137Listed by: FIRST METRO INVESTMENTS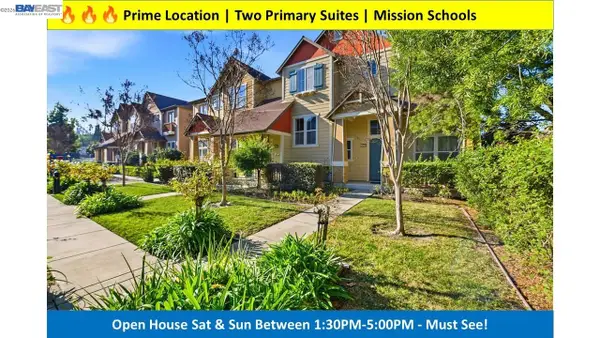 $1,088,000Active2 beds 3 baths1,196 sq. ft.
43220 Giovanni Terrace, Fremont, CA 94539
MLS# 41126195Listed by: LEGACY REAL ESTATE & ASSOC. $1,350,000Active3 beds 3 baths1,556 sq. ft.
43896 Paso Pino Common, Fremont, CA 94539
MLS# ML82034358Listed by: ALLIANCE BAY REALTY $1,500,000Active0.35 Acres
43342 Bryant St, Fremont, CA 94539
MLS# 41125713Listed by: PACIFIC REALTY PARTNERS $1,986,000Pending4 beds 4 baths2,238 sq. ft.
43147 Calle Sagrada, Fremont, CA 94539
MLS# 41124472Listed by: STARRIVER INC $1,299,950Pending0.17 Acres
43518 Bryant Street, Fremont, CA 94539
MLS# ML82030298Listed by: COMPASS $3,388,000Pending4 beds 3 baths2,939 sq. ft.
646 Bella Vista Ct, Fremont, CA 94539
MLS# 41109659Listed by: EXP REALTY OF CALIFORNIA, INC $1,894,500Active3 beds 2 baths1,206 sq. ft.
341 Dana Street, Fremont, CA 94539
MLS# 41122814Listed by: PACIFIC REALTY PARTNERS
Local realty services provided by:CENTURY 21 Epic, CENTURY 21 Valley Properties, CENTURY 21 Wildwood Properties, Inc.
Bay East 2026. CCAR 2026 bridgeMLS 2026. Information Deemed Reliable But Not Guaranteed. This information is being provided by the Bay East MLS, or CCAR MLS, or bridgeMLS. The listings presented here may or may not be listed by the Broker/Agent operating this website. This information is intended for the personal use of consumers and may not be used for any purpose other than to identify prospective properties consumers may be interested in purchasing. Data last updated at April 1, 2026
The information being provided by California Regional MLS (Southern California) is for the consumer's personal, non-commercial use and may not be used for any purpose other than to identify prospective properties consumer may be interested in purchasing. Any information relating to real estate for sale referenced on this web site comes from the Internet Data Exchange (IDX) program of the California Regional MLS (Southern California). CENTURY 21 Valley Properties is not a Multiple Listing Service (MLS), nor does it offer MLS access. This website is a service of CENTURY 21 Valley Properties, a broker participant of California Regional MLS (Southern California). This web site may reference real estate listing(s) held by a brokerage firm other than the broker and/or agent who owns this web site.
The accuracy of all information, regardless of source, including but not limited to open house information, square footages and lot sizes, is deemed reliable but not guaranteed and should be personally verified through personal inspection by and/or with the appropriate professionals. The data contained herein is copyrighted by California Regional MLS (Southern California) and is protected by all applicable copyright laws. Any unauthorized dissemination of this information is in violation of copyright laws and is strictly prohibited.
Copyright 2021 California Regional MLS (Southern California). All rights reserved.
Popular neighborhoods near Mission San Jose, Fremont, CA
Zip codes near Mission San Jose, Fremont, CA
- 94043 homes for sale
- 94085 homes for sale
- 94089 homes for sale
- 94536 homes for sale
- 94538 homes for sale
- 94539 homes for sale
- 94542 homes for sale
- 94544 homes for sale
- 94555 homes for sale
- 94560 homes for sale
- 94566 homes for sale
- 94586 homes for sale
- 94587 homes for sale
- 94588 homes for sale
- 95035 homes for sale
- 95054 homes for sale
- 95131 homes for sale
- 95132 homes for sale
- 95133 homes for sale
- 95134 homes for sale
Counties near Mission San Jose, Fremont, CA
- Alameda County homes for sale
- Amador County homes for sale
- Calaveras County homes for sale
- Contra Costa County homes for sale
- Marin County homes for sale
- Merced County homes for sale
- Monterey County homes for sale
- Napa County homes for sale
- Sacramento County homes for sale
- San Benito County homes for sale
- San Francisco County homes for sale
- San Joaquin County homes for sale
- San Mateo County homes for sale
- Santa Clara County homes for sale
- Santa Cruz County homes for sale
- Solano County homes for sale
- Sonoma County homes for sale
- Stanislaus County homes for sale
- Yolo County homes for sale
Protect your home and budget from life's surprises with an Assurant Home Warranty, backed by a partner that supports you through every step of homeownership. Explore Plans.
©2026 Century 21 Real Estate LLC. All rights reserved. CENTURY 21®, the CENTURY 21 Logo and C21® are service marks owned by Century 21 Real Estate LLC. Century 21 Real Estate LLC fully supports the principles of the Fair Housing Act and the Equal Opportunity Act. Each office is independently owned and operated. Listing information is deemed reliable but not guaranteed accurate.